MONTHLY ECONOMIC BRIEF - Office of the Executive Mayor Economic Intelligence - Tshwane Economic Development ...
←
→
Page content transcription
If your browser does not render page correctly, please read the page content below
Office of the Executive Mayor
Economic Intelligence

Issue 7                                               January 2018

              MONTHLY ECONOMIC
                   BRIEF

                        Featured article

              A brief look into the mining and quarrying sector in Tshwane
GLOBAL ECONOMIC PROSPECTS
FIGURE 1: GROWTH OF WORLD GROSS PRODUCT AND CONTRIBUTIONS TO CHANGE IN
WORLD GROSS PRODUCT GROWTH BY COMPONENT, 2017

Source: United Nations, 2018
 1
  Purchasing power parities (PPPs) refers to the differences in the cost of living across countries. Developing countries have a higher weight when using PPP ex-
 change-rate-based aggregations than when using market exchange rates. Since developing countries have been growing significantly faster than developed
 countries, the rate of global growth is higher when using PPP exchange rates.

The United Nations (2018:19) forecasts the prospects for the world economy in 2018–2019 to be on a positive path,
with the world gross product (WGP) estimated to expand at a steady pace of 3,0% following estimated growth of 3,0%
when calculated at market exchange rate or 3,6% when adjusted for purchasing power parities in 2017. As indicated
in Figure 1, the WGP has strengthened amidst the fragile growth of the past decade which had resulted from high
investor uncertainty and periodic spikes in global financial market volatility, among other things. According to the Unit-
ed Nations, the positive growth experienced in 2017 can be attributed to accelerated industrial production, recovery in
global trade driven by stronger demand in East Asia, and an improved investment environment.
Figure 1 further disaggregates the components of contribution to change in WGP growth in 2017. The figure shows
that growth is the result of the composition of global demand that shifted towards investment, with gross fixed capital
formation (GFCF) accounting for about 60% of the acceleration in global growth. The United Nations (2018:20) states
that the acceleration of this capital formation is relative to a very low starting point, following two years of exceptional-
ly weak investment growth and a prolonged period of lacklustre global investment activity.

                                                                                2
SOUTH AFRICAN OUTLOOK
   FIGURE 2: CONTRIBUTION TO GROWTH IN GDP BY SECTOR AND CONTRIBUTIONS TO GROWTH IN
   EXPENDITURE, QUARTER 3 OF 2017

Source: Stats SA (2017), gross domestic product, third quarter of 2017
The gross domestic product (GDP) in the third quarter of 2017 eased to 2,0% from quarter to quarter, seasonally adjusted
from 2,8% in the second quarter of 2017. This growth was boosted by significant growth in the agriculture, mining and
manufacturing sectors. The manufacturing sector increased by 44,2% and contributed 0,9%, while mining increased by
6,6% and contributed 0,5%, and manufacturing increased by 4,3% and contributed a further 0,5%.
The expenditure approach of measuring GDP resulted in an increase of 2,1% in the third quarter of 2017 from 2,7% in the
second quarter of 2017. Household final consumption expenditure (HFCE) expanded by 2,6% from Quarter 2 of 2017 to
Quarter 3 of 2017, contributing 1,6% to the total growth. The government final consumption expenditure (GFCE) contract-
ed by 0,5%, contributing -0,1%, with Stats SA ascribing this to declining employment levels. Gross fixed capital formation
(GFCF) increased by 4,3%, contributing 0,8% on account of a lift in private sector investment, which comprises two-thirds
of total investment after contracting by 2,0% in Quarter 2 of 2017. Changes in inventories in the third quarter contributed -
1,5% to total growth. Exports decreased by 10,3% and imports decreased by 13,7%. Net exports contributed 1,3% to total
growth.

    2
     Household final consumption expenditure (HFCE) forms the largest part of quarterly GDP (E) at 61,0%. It consists of expenditure incurred by resident house-
    holds on consumption goods and services, regardless of where such expenditure occurs
    3
     Government final consumption expenditure (GFCE) measures expenditure incurred by general government, either on collective services or on selected indi-
    vidual goods or services. The sum of the production costs in delivering these goods and services to the public is referred to as final consumption expenditure by
    government.
    4
     Gross fixed capital formation (GFCF) is a component of GDP that groups transactions on the net acquisitions (acquisitions less disposals) of capital assets,
    both existing and new, by general government, private enterprises (ie private and quasi-corporations) and state-owned corporations (hereinafter public corpora-
    tions) and in addition households and unincorporated enterprises.
                                                                                   3
PROVINCIAL SNAPSHOT : LABOUR MARKET FOCUS

  FIGURE 3: REAL OUTPUT PER PROVINCE, ANNUAL GROWTH 2017

                                                                          Notes
                                                                          To interpret the radar chart, one should note that
                                                                          the closer to the centre a marker across a prov-
                                                                          ince is, the lower the rate of growth, and the closer
                                                                          the marker is to the outer circle, the higher the rate
                                                                          in question. The primary sector comprises of agri-
                                                                          culture and mining subsectors. The secondary
                                                                          sector comprises of manufacturing, construction
                                                                          and electricity. The tertiary sector is comprised of
                                                                          4 subsectors namely trade, transport, finance, and
                                                                          community services.

Source: Author’s own adaptation based on Stats SA Gross Domestic Product, Q3 2017

The growth in economic output for South Africa slowed to 0,37% in 2016 from 1,3% in 2015. However, some provinces
experienced growth while others had a decline in growth. Economic growth in Gauteng outperformed that of the rest of
South Africa in 2016 with growth of 1,1%, followed by the Western Cape with 0,7% and the Eastern Cape with 0,6%.
Real production in the primary sector decreased across all provinces in 2016, with the highest decline from Gauteng,
followed by KwaZulu-Natal and the Free State with declines of 10,1%, 8,6% and 8,1% respectively.
The secondary sector, which is viewed as a stimulant for growth in activities of other sectors, did not experience signifi-
cant growth across all the provinces. Gauteng outperformed all the other provinces, followed by KwaZulu-Natal and
the Eastern Cape, with growth of 0,9%, 0,6% and 0,5% respectively. The provinces that experienced the highest de-
cline were Limpopo, followed by Mpumalanga and the Free State, with declines of 1,5%, 1,4% and 0,6% respectively.
All the provinces in South Africa depend greatly on the tertiary sector; this sector has been the largest contributor to
provincial GDP compared to the primary and secondary sectors. It can be observed from the figure above that the
tertiary sector is the only sector that experienced growth across all nine provinces. Gauteng and the Western Cape
outperformed all provinces with growth of 1,6%, followed by KwaZulu-Natal with growth of 1,4% and the Northern
Cape with growth of 1,3%.

                                                            4
Tshwane at a glance!
    Major residential     Akasia, Atteridgeville, Babelegi, Bronberg, Bronkhorstspruit, Centurion, Crocodile River, Cullinan, Eersterust, Ekangala, Elands River, Ga
    areas                 -Rankuwa, Hammanskraal, Laudium, Mamelodi, Pretoria, Rayton, Refilwe, Rethabiseng, Roodeplaat, Soshanguve, Temba, Winterveld
                          and Zithobeni

    Population            3,32 million in (2017)

                          Child population: 785 182 (23,63%)

                          Working-age population: 2,35 million (70,77%)

                          Aged population 185 946 (5,60%)

    Area                  6 368 km²
                          Tshwane is the largest city in Africa and the third-largest in the world based on land area.

    Operating budget      R28,3 billion (2016/17)

    Capital budget        R3,94 billion (2017/18)5

    Municipal area GGP    R305 billion (2010 constant prices)

    GGP per capita        R94 264 GDP-R per capita (2010 constant prices)6

    GGP growth            1,0% (2016)6
    Unemployment          27,9%, (Quarter 3: 2017)

    Poverty rate          49,2% (2016) – For people living below upper bound poverty line6

    Principal languages   English, Sepedi, Afrikaans, Xitsonga and Setswana

    Industrial estates    Babelegi, Bronkhorstspruit, Despatch, Ekandustria, Ga-Rankuwa, Gateway, Hennopspark, Hermanstad, Irene, Kirkney, Klerksoord,
                          Koedoespoort, Lyttelton Manor, Pretoria North, Pretoria West, Rooihuiskraal, Rosslyn, Samcor Park, Silverton, Silvertondale, Sunderland
                          Ridge and Waltloo

    Principal economic    Principal economic activities are government and community services (28%), finance (25%), and manufacturing (13%). All figures are for
    activities            2016.6

    Focus sectors         Aerospace and defence technologies
                          Agriculture and agro-processing
                          Automotive industry and components
                          Business process outsourcing and off-shoring
                          Green economy
                          Knowledge economy
                          Manufacturing
                          Mining and mineral beneficiation
                          Tourism

    Interesting facts     Home to 138 foreign missions and organisations
    about Tshwane
                          Highest concentration of medical institutions per square kilometre in RSA
                          Knowledge and R&D capital of the RSA
                          25% of Gauteng’s GDP (2016)6
                          9% of national GDP (2016)6
                          53% of transport equipment exported from South Africa originate in Tshwane
4
  Quantec Easy Data 2017
5
  City of Tshwane Budget Speech, 2017
6
  IHS Global Insight, 2017                                                         5
7
  Statistics South Africa, 2017
A BRIEF LOOK INTO THE MINING AND QUARRYING SECTOR IN TSHWANE

                                                                                                Note

                                                                                                ²Interchangeably referred to
                                                                                                as the mining sector through-
                                                                                                out this short article

Source: Regional eXplorer 1156 (2.6a) and Quantec Easy Data

Mining and quarrying² are defined to include the extraction of minerals occurring naturally as solids (eg. coals and
ores), liquids (eg petroleum) or gases through methods such as underground or surface mining, well operation or sea-
bed mining (Statistics South Africa, 2012:56). Figure 1 indicates the gross value added by region (GDP-R) of the min-
ing sector in Tshwane over the 2012–2016 period; the period of 2017–2021 is based on projections. As indicated in
Figure 1, the mining and quarrying sector in Tshwane is not a dominant sector – it is estimated to have only contribut-
ed 1,7% to Tshwane’s gross value added by region (GVA-R) in 2016, a GVA-R of R6,027 billion. This is estimated to
have increased to R6,213 billion in 2017 – indicating an average year-on-year growth of 3,1%. It should be noted that
this percentage year-on-year growth follows from a rather volatile trend.

Furthermore, the average annual growth of the mining sector in Tshwane over the 2017–2021 period is estimated at
0,4%. Such subdued levels of growth in the mining sector have largely been attributed to political/regulatory uncertain-
ty and questions around the sustainability of the industry (PricewaterhouseCoopers, 2017:1–12). The announcement
of the widely contested Mining Charter by the Minister of Mineral Resources in 2017 exacerbates the mounting regula-
tory uncertainty in the sector.

                                                           6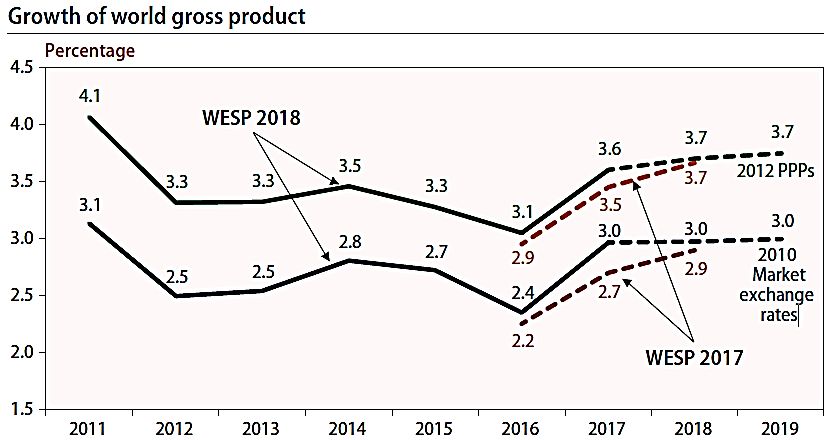
“A BRIEF LOOK INTO THE MINING AND QUARRYING SECTOR IN TSHWANE CONTINUED.”

Source: Adapted from IHS Markit Regional eXplorer version 1156 Database

The mining sector in Tshwane contributed approximately 0,6% (7 517 persons) to total employment in the city in the
third quarter of 2017 according to the Statistics South Africa’s quarterly labour force survey data – 50% of which con-
stitute the youth population. As indicated in Figure 3, there are evident high levels of volatility in the sector’s employ-
ment levels which tallies with the rather unstable and modest GVA-R growth levels as alluded to in Figure 1. It should
be noted, however, that the average quarter-on-quarter growth over Quarter 3 of 2016 to Quarter 3 of 2017 improved
to 9,1%. With the anticipated 500 jobs from the new Nokeng Fluorspar Mine over its anticipated lifespan alone and all
other mining projects planned by Sepfluor Limited in Tshwane, there is room for some optimism with regard to the fu-
ture of mining in Tshwane.

                                                            7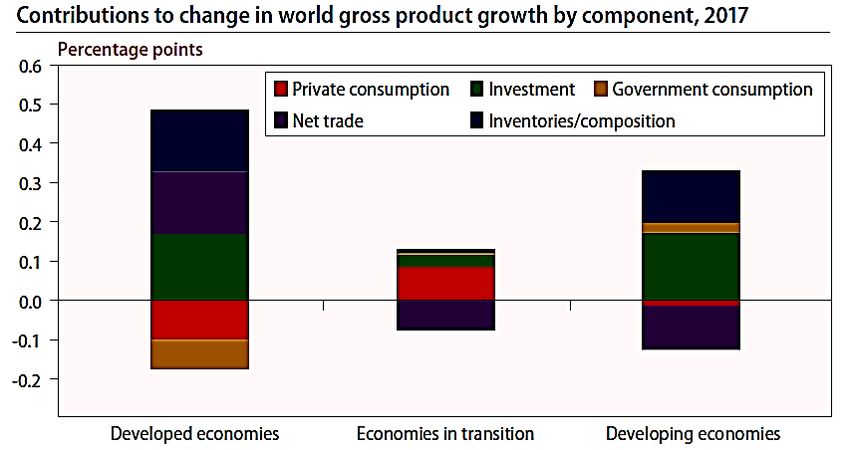
REFERENCE LIST
City of Tshwane (2017). Tshwane Budget 2017/18. Retrieved from: http://www.tshwane.gov.za/
Documents/Budget%20Speech%20Final%20201718%20(3)%20(4)%20(ChIS+VN).pdf
IHS Global Insight, (2017). Regional eXplorer 1156
PricewaterhouseCoopers, (2017). SA Mine: Highlighting Trends in the South African Mining Industry. 9th edition
Quantec Research (2017). Easy Data
Statistics South Africa (2017). Gross domestic product Third quarter 2017. Retrieved from: http://www.statssa.gov.za/
publications/P0441/P04413rdQuarter2017.pdf
United Nations (2018) World Economic Situation and Prospects 2018. Retrieved from: https://www.un.org/development/
desa/dpad/wpcontent/uploads/sites/45/publication/WESP2018_Full_Web-1.pdf

                                                           8
Contact Us:
Head Office Authored/Compiled by:
Tshwane House
320 Madiba Street Tumiso Maitisa
Pretoria TUMISOMA@TSHWANE.GOV.ZA
PO Box 440
Pretoria Ntombizodwa Mabena
South Africa NTOMBIZODWAMA@TSHWANE.GOV.ZA
0001
Economic Intelligence Division
+27(12) 358 2173
EconomicIntelligence@tshwane.gov.za
9You can also read