Monthly Highlights - EUMOFA
←
→
Page content transcription
If your browser does not render page correctly, please read the page content below
Monthly Highlights
No. 4 / 2021

  In this issue
  According to data collected by EUMOFA from 13 EU
  Member States, Norway lobster and spottail mantis
  squillid together accounted for 38% of the total
                                                          Contents
  first-sales value of the “crustaceans” commodity
  group in January 2021.                                        First sales in Europe
                                                                Norway lobster (Denmark, France,
  Both the import price and volumes of frozen crabs             Sweden) and spottail mantis squillid
  imported in the EU from Norway have shown a                   (Italy, Spain)
  downward trend since week 1 of 2021.
                                                                Extra-EU imports
  Between February 2018 and January 2021, total                 Weekly average EU import prices of
  household consumption of fresh flounder in                    selected products from
  Denmark (3.395 tonnes) was 608% higher than that              selected countries of origin
  in Sweden (480 tonnes).                                       Consumption
  The most important commercial fisheries in the                Flounder in Denmark and Sweden
  Baltic Sea in terms of volume are sprat and herring
  trawl fisheries. Cod is the most important species in         Case studies
  terms of demersal fisheries. These three species              Fisheries management in the Baltic Sea
  accounts for around 95% of total catches.                     Cuttlefish in the EU

  Cuttlefish are among the most caught and                      Global highlights
  consumed molluscs in the EU. In 2018, the EU
  landed 23.170 tonnes of cuttlefish worth
                                                                Macroeconomic context
  EUR 158 million.
                                                                Marine fuel, consumer prices, and
  In March, the EU, Norway, and the UK signed an                exchange rates
  agreement for the joint management of cod,
  haddock, saithe, whiting, plaice, and herring in the
  North Sea.

                                                            Find all data, information, and more at:
                                                                       www.eumofa.eu

                                                                   @EU_MARE #EUMOFA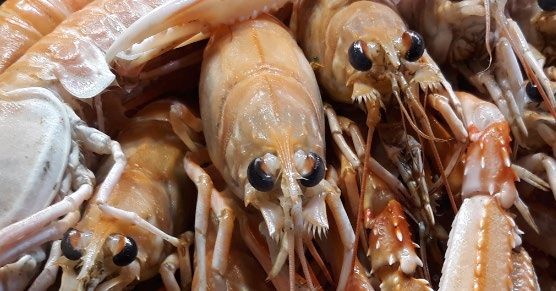
European Market Observatory for                                                                              MONTHLY HIGHLIGHTS | NO.4/2021
     Fisheries and Aquaculture Products                                                                                      FIRST SALES IN EUROPE

 1. First sales in Europe
 In January 2021, 13 EU Member States (MS), Norway, and the United Kingdom reported
 first-sales data for 10 commodity groups 1. First-sales data are based on sales notes and data collected from auction
 markets. First-sales data analysed in the section “First sales in Europe” are extracted from EUMOFA 2.

 1.1. January 2021 compared to January 2020

 Increases in value and volume: Denmark, Estonia, Lithuania, and Sweden were the only countries that recorded an
 increase in both first-sales value and volume. All four countries saw a sharp increase due to a higher supply of herring
 and sprat.

 Decreases in value and volume: Belgium, Bulgaria, France, Italy, the Netherlands, Poland, Portugal, and Spain
 recorded decreases in both first-sales value and volume. Poland recorded amongst the highest decreases due to a lower
 supply of small pelagic species, namely herring and sprat. Clam was behind the sharp decreases seen in Bulgaria.

 Table 1.      JANUARY OVERVIEW OF FIRST SALES FROM THE REPORTING COUNTRIES
               (volume in tonnes and value in million EUR) *

                               January                            January                          January                      Change from
                                2019                               2020                             2021                        January 2020
Country                Volume              Value          Volume            Value          Volume             Value           Volume           Value
Belgium                       1.466              5,08           1.322            5,74              982              3,43          -26%            -40%
Bulgaria                          26             0,07              43            0,11               26              0,05          -40%            -51%
Denmark                      28.383            31,69          16.750            27,74          50.737             29,69           203%               7%
Estonia                       6.209            1.095            5.676           1.871            9.405              2,18           66%             16%
France                       15.648           53.015          14.540          51.023           13.644             44,26             -6%           -13%
Italy                         5.734           23.666            6.628         25.787             4.513            18,66           -32%            -28%
Latvia                        4.760              825            3.819             696            3.829              0,79            0%             14%
Lithuania                       125              143              134             114              349              0,18          160%             62%
Netherlands                  11.352           23.323          12.467          22.314             6.798            14,17           -45%            -36%
Poland                        9.542            2.462            7.275           1.787            2.688              0,60          -63%            -66%
Portugal                      7.268           19.560            4.497         16.153             4.138            14,96             -8%             -7%
Spain                        31.206         112.194           27.993         102.167           23.472             80,04           -16%            -22%
Sweden                       24.433            9.141          11.455            5.713          21.824               7,27           91%             27%
Norway                      257.373         237.025          229.244         250.896          259.781            214,52            13%            -14%
United                       40.338           76.011          33.157          62.225           46.631             61,34            41%              -1%
Kingdom
 Possible discrepancies in % changes are due to rounding.
 * Volumes are reported in net weight for EU Member States and the UK, and in live weight equivalent (LWE) for Norway. Prices are reported in EUR/kg (without
 VAT). For Norway, prices are reported in EUR/kg of live weight.

     The most recent weekly first-sales data (up to week 15 of 2021) are available via the EUMOFA website, and
     can be accessed here.

     The most recent monthly first-sales data for February 2021 are available via the EUMOFA website and can
     be accessed here.

 1
   Bivalves and other molluscs and aquatic invertebrates, cephalopods, crustaceans, flatfish, freshwater fish, groundfish, salmonids, small pelagics, tuna and
 tuna-like species, and other marine fish.
 2
   First sales data updated on 16.3.2021.

                                  Overview | 1. First sales in Europe | 2. Extra-EU imports | 3. Consumption
                                                                                                                                                                 2
                          | 4. Fisheries Management in the Baltic | 5. Cuttlefish in the EU | 6. Global highlights |
                                                                 7. Macroeconomic context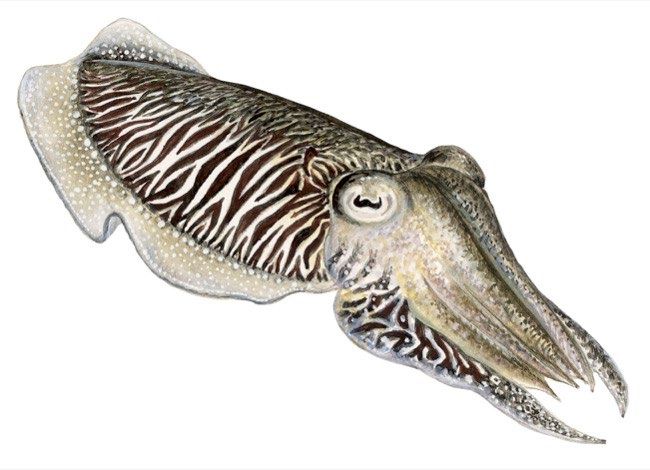
European Market Observatory for                                                                          MONTHLY HIGHLIGHTS | NO.4/2021
    Fisheries and Aquaculture Products                                                                                  FIRST SALES IN EUROPE

1.2. First sales in selected countries
First sales data analysed in this section are extracted from EUMOFA 3.

Table 2.        FIRST SALES OF THE MAIN COMMERCIAL SPECIES 4 IN BELGIUM
                              First-sales             First-sales              Main contributing species
                              value / trend %         volume / trend %
           Belgium

    Jan 2021 vs               EUR 3,4 million,        982 tonnes,              Common sole, megrim, squid, ray, cuttlefish.
    Jan 2020                  -40%                    -26%

Figure 1.       FIRST SALES OF THE MAIN COMMERCIAL SPECIES IN BELGIUM, JANUARY 2021

              -40%
     100                 -54%                                                                                                              1.200
      80                                                                                                        -41%                       900
      60
                                                                                                                                           600
      40                                                                       -52%
      20                                                                                   -49%                            -29%            300
                                               -95%       -96%

               Common sole                         Megrim                          Squid                           Ray
                                                    Volume (tonnes)                  Value (EUR 1000)
Percentages show change from the previous year.

Table 3.        FIRST SALES OF THE MAIN COMMERCIAL SPECIES IN BULGARIA
                                  First-sales             First-sales               Main contributing species
                                  value / trend %         volume / trend %
            Bulgaria

    Jan 2021 vs                   EUR 0,05 million,       26 tonnes,                Clam, red mullet, sprat.
    Jan 2020                      -51%                    -40%

Figure 2.       FIRST SALES OF THE MAIN COMMERCIAL SPECIES IN BULGARIA, JANUARY 2021

     30                                                                                                                                     60
               -37%           -51%

     20                                                                                                                                     40

     10                                                                                                                                     20

                                                           -30%            -29%                            -100% -100%
                     Clam                                  Red mullet                                            Sprat
                                                 Volume (tonnes)                   Value (EUR 1000)
Percentages show change from the previous year.

3
    First sales data updated on 16.03.2021.
4
    Data on fisheries and aquaculture products harmonised in EUMOFA allow comparisons along the different supply chain stages in EUMOFA.

                                  Overview | 1. First sales in Europe | 2. Extra-EU imports | 3. Consumption
                                                                                                                                                   3
                          | 4. Fisheries Management in the Baltic | 5. Cuttlefish in the EU | 6. Global highlights |
                                                               7. Macroeconomic context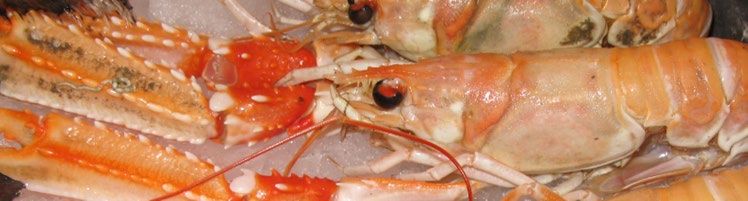
European Market Observatory for                                                                      MONTHLY HIGHLIGHTS | NO.4/2021
    Fisheries and Aquaculture Products                                                                              FIRST SALES IN EUROPE

Table 4.         FIRST SALES OF THE MAIN COMMERCIAL SPECIES IN DENMARK
                       First-sales           First-sales              Main contributing                 Notes
                       value / trend %       volume / trend %         species
       Denmark

    Jan 2021 vs        EUR 29,7 million,     50.737 tonnes,           Herring, sprat, Norway            This herring increase might partially be
    Jan 2020           +7%                   +203%                    lobster, other marine fish*,      due to the closure of the Norwegian part
                                                                      mussel Mytilus spp.               of the North Sea in January 2021, as part
                                                                                                        of the post-Brexit trilateral negotiations.
                                                                                                        This closure provoked that higher quota of
                                                                                                        herring was recorded for the North Sea
                                                                                                        basin compared to previous years since
                                                                                                        pelagic vessels in this basin focused on
                                                                                                        North Sea sprat and Norwegian pout 5
                                                                                                        fishery where herring can also be caught
                                                                                                        as by-catch.

Figure 3.        FIRST SALES OF THE MAIN COMMERCIAL SPECIES IN DENMARK, JANUARY 2021

       24.000 +557% +364%                                                                                                         10.000
       20.000                                                                                                                     8.000
                                           +16511%
       16.000
                                                                                                                                  6.000
       12.000
                                                     +8888%                                                                       4.000
         8.000                                                                    +65%
                                                                                                      +5926% +140%                2.000
         4.000
                                                                        +108%

                      Herring                   Sprat                    Norway lobster              Other marine fish*
                                               Volume (tonnes)                 Value (EUR 1000)
Percentages show change from the previous year. *EUMOFA aggregation for species (Metadata 2, Annex 3: http://eumofa.eu/supply-balance-and-other-
methodologies).

Table 5.         FIRST SALES OF THE MAIN COMMERCIAL SPECIES IN ESTONIA
                       First-sales           First-sales              Main contributing                Notes
                       value / trend %       volume / trend %         species
        Estonia

    Jan 2021 vs        EUR 2,2 million,      9.405 tonnes,            Sprat, herring.                  One of the reasons behind the increased
    Jan 2020           +16%                  +66%                     Pike-perch and other             sales of sprat in January 2021 was the
                                                                      freshwater fish* slowed          favourable weather condition compared
                                                                      the increasing trend.            with January 2020 which allowed the
                                                                                                       increase of fishing effort. Moreover, in
                                                                                                       2021, quotas for herring were reduced by
                                                                                                       31% compared to 2020 6.

5
    Belongs to main commercial species (MCS) of “other marine fish”
6
    Council Regulation (EU) 2020/1579 https://eur-lex.europa.eu/legal-content/EN/ALL/?uri=CELEX:32020R1579

                                Overview | 1. First sales in Europe | 2. Extra-EU imports | 3. Consumption
                                                                                                                                                      4
                        | 4. Fisheries Management in the Baltic | 5. Cuttlefish in the EU | 6. Global highlights |
                                                          7. Macroeconomic context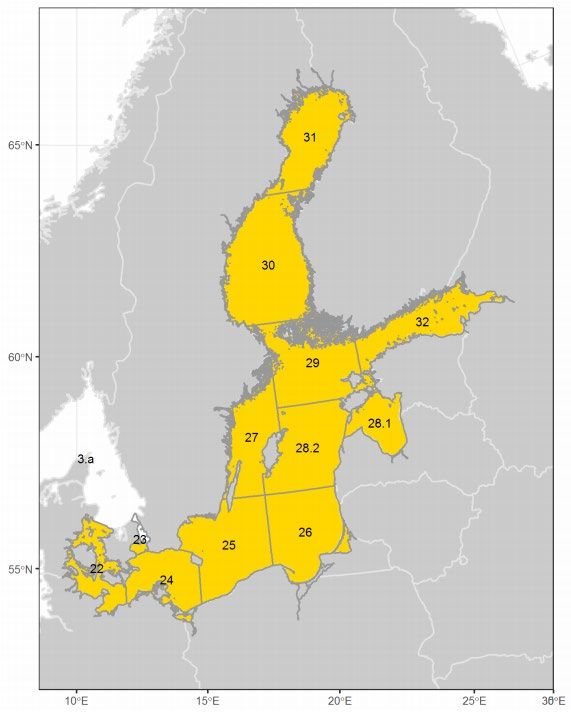
European Market Observatory for                                                                      MONTHLY HIGHLIGHTS | NO.4/2021
 Fisheries and Aquaculture Products                                                                              FIRST SALES IN EUROPE

Figure 4.     FIRST SALES OF THE MAIN COMMERCIAL SPECIES IN ESTONIA, JANUARY 2021

      6.000                  +98%                                                                                             1.000
                   +72%
      5.000                                             +93%                                                                  800
                                             +80%
      4.000
                                                                                                                              600
      3.000
                                                                                    -51%                                      400
      2.000
      1.000                                                                                                  -62%             200
                                                                            -58%                   -43%

                     Sprat                       Herring                    Pike-perch         Other freshwater fish*
                                                 Volume (tonnes)                  Value (EUR 1000)
Percentages show change from the previous year. *EUMOFA aggregation for species

Table 6.      FIRST SALES OF THE MAIN COMMERCIAL SPECIES IN FRANCE
                                  First-sales              First-sales               Main contributing species
                                  value / trend %          volume / trend %
            France

 Jan 2021 vs                      EUR 44,3 million,        13.644 tonnes,            Hake, common sole, seabream other than gilthead*,
 Jan 2020                         -13%                     -6%                       sardine.

Figure 5.     FIRST SALES OF THE MAIN COMMERCIAL SPECIES IN FRANCE, JANUARY 2021

      1.200                                                                                                                       6.000
                                                           -20%                                        -14%
                                                                                                                                  5.000
         900       -9%
                                                                                                                                  4.000
                             -30%
         600                                                                                                                      3.000
                                                 -7%
                                                                                                                                  2.000
         300                                                                 -53%                                -14%
                                                                                      -46%                                        1.000

                     Hake                        Common sole                Seabream, other*              Sardine

                                                 Volume (tonnes)                   Value (EUR 1000)
Percentages show change from the previous year. *EUMOFA aggregation for species

Table 7.      FIRST SALES OF THE MAIN COMMERCIAL SPECIES IN ITALY
                             First-sales              First-sales             Main contributing species
                             value / trend %          volume / trend %
           Italy

 Jan 2021 vs                 EUR 18,7 million,        4.513 tonnes,           Clam, miscellaneous shrimps*, hake, anchovy, deep-water rose
 Jan 2020                    -28%                     -32%                    shrimp.

                               Overview | 1. First sales in Europe | 2. Extra-EU imports | 3. Consumption
                                                                                                                                             5
                       | 4. Fisheries Management in the Baltic | 5. Cuttlefish in the EU | 6. Global highlights |
                                                             7. Macroeconomic context
European Market Observatory for                                                                         MONTHLY HIGHLIGHTS | NO.4/2021
 Fisheries and Aquaculture Products                                                                                 FIRST SALES IN EUROPE

Figure 6.     FIRST SALES OF THE MAIN COMMERCIAL SPECIES IN ITALY, JANUARY 2021

  1.000                                                                                                    -27%                         4.000
                                                                                                                      +6%
    800       -41%
                                                                                                                                        3.000
    600
                        -39%                                                              -35%                                          2.000
    400
                                                        -51%                -51%
    200                                                                                                                                 1.000
                                              -53%

                Clam                    Miscellaneous shrimps*                     Hake                      Anchovy

                                              Volume (tonnes)                             Value (EUR 1000)
Percentages show change from the previous year. *EUMOFA aggregation for species.

Table 8.      FIRST SALES OF THE MAIN COMMERCIAL SPECIES IN LATVIA
                           First-sales            First-sales              Main contributing species
                           value / trend %        volume / trend %
        Latvia

 Jan 2021 vs               EUR 0,8 million,       3.829 tonnes,            Herring, smelt, other marine fish*.
 Jan 2020                  +14%                   no change

Figure 7.     FIRST SALES OF THE MAIN COMMERCIAL SPECIES IN LATVIA, JANUARY 2021

      1.800        +8%                                                                                                                    400
                                +41%
      1.500
                                                                                                                                          300
      1.200
        900                                                                                                                               200
        600
                                                                                                                                          100
        300                                                 +25%           +45%                      +100%        +126%

                     Herring                                    Smelt                                Other marine fish*
                                              Volume (tonnes)                      Value (EUR 1000)
Percentages show change from the previous year. *EUMOFA aggregation for species

Table 9.      FIRST SALES OF THE MAIN COMMERCIAL SPECIES IN LITHUANIA
                           First-sales            First-sales              Main contributing           Notes
                           value / trend %        volume/ trend %          species
       Lithuania

 Jan 2021 vs               EUR 0,2 million,       349 tonnes,              Herring, sprat.             Herring recorded significant increases in
 Jan 2020                  +62%                   +160%                    Smelt recorded              first sales. The main reason is linked with
                                                                           increase in first-sales     the Latvian and Estonian fish processing
                                                                           value only.                 companies, which purchased a subsidiary
                                                                                                       fish company in Lithuania. Since the
                                                                                                       activities were carried out by this company
                                                                                                       but recorded in Lithuania, sales increased
                                                                                                       by a significant percentage in this country
                                                                                                       compared to the previous year.

                               Overview | 1. First sales in Europe | 2. Extra-EU imports | 3. Consumption
                                                                                                                                                     6
                       | 4. Fisheries Management in the Baltic | 5. Cuttlefish in the EU | 6. Global highlights |
                                                           7. Macroeconomic context
European Market Observatory for                                                                    MONTHLY HIGHLIGHTS | NO.4/2021
 Fisheries and Aquaculture Products                                                                            FIRST SALES IN EUROPE

Figure 8.    FIRST SALES OF THE MAIN COMMERCIAL SPECIES IN LITHUANIA, JANUARY 2021

          300      +200%                                                                                                               120
                                                                          +20%
          250
                                                                                                                                       90
          200                     +178%
          150                                                                                                                          60
          100
                                                             -7%                                 +426%           +514%                 30
           50

                        Herring                                     Smelt                                Sprat
                                                  Volume (tonnes)               Value (EUR 1000)
Percentages show change from the previous year.

Table 10. FIRST SALES OF THE MAIN COMMERCIAL SPECIES IN THE NETHERLANDS
                           First-sales              First-sales            Main contributing     Notes
                           value / trend %          volume / trend %       species
  The Netherlands

 Jan 2021 vs               EUR 14,2 million,        6.798 tonnes,          Herring, European     While the level of herring production
 Jan 2020                  -36%                     -45%                   plaice, common        recorded in January 2021 is extremely low
                                                                           sole, mackerel.       compared to the previous years, it should
                                                                                                 be noted that it is highly variable, with
                                                                                                 around 3.600 tonnes in January 2019 and
                                                                                                 5.200 tonnes in January 2018. This is
                                                                                                 mostly due to a change in fishing
                                                                                                 strategies, with only one Dutch pelagic
                                                                                                 vessel targeting herring in the Channel
                                                                                                 during the first two weeks of 2021.

Figure 9.    FIRST SALES OF THE MAIN COMMERCIAL SPECIES IN THE NETHERLANDS, JANUARY 2021

    1.500                                                                            -18%             -19%                           5.000
    1.200                                      -29%                                                                                  4.000
      900                                                                                                                            3.000
      600                                                 -37%              +29%                                                     2.000
              -96%                                                                                                -19%
      300                -96%                                                                                                        1.000

                 Herring                    European plaice                 Common sole                  Mackerel

                                                     Volume (tonnes)               Value (EUR 1000)
Percentages show change from the previous year.

Table 11. FIRST SALES OF THE MAIN COMMERCIAL SPECIES IN NORWAY
                             First-sales                First-sales            Main contributing species
                             value / trend %            volume / trend %
         Norway

 Jan 2021 vs                 EUR 214,5 million          259.781 tonnes,        Value: cod, haddock, mackerel.
 Jan 2020                    -14%                       +13%                   Volume: herring, seaweed and other algae, mackerel.

                               Overview | 1. First sales in Europe | 2. Extra-EU imports | 3. Consumption
                                                                                                                                             7
                       | 4. Fisheries Management in the Baltic | 5. Cuttlefish in the EU | 6. Global highlights |
                                                            7. Macroeconomic context
European Market Observatory for                                                                    MONTHLY HIGHLIGHTS | NO.4/2021
 Fisheries and Aquaculture Products                                                                            FIRST SALES IN EUROPE

Figure 10. FIRST SALES OF THE MAIN COMMERCIAL SPECIES IN NORWAY, JANUARY 2021

                                                                                                                 -3%
  120.000                                         +27%                                                                            80.000
    90.000                                               +23%                                                                     60.000
                             -48%                                                                    +11%
    60.000                                                                                                                        40.000
    30.000     -29%                                                                                                               20.000
                                                                          +379%
                                                                                   +366%
                     Cod                           Herring                Seaweed and other             Mackerel
                                                                               algae
                                                     Volume (tonnes)              Value (EUR 1000)
Percentages show change from the previous year.

Table 12. FIRST SALES OF THE MAIN COMMERCIAL SPECIES IN POLAND
                               First-sales            First-sales          Main contributing species
                               value / trend %        volume / trend %
          Poland

 Jan 2021 vs                   EUR 0,6 million        2.688 tonnes,        Sprat, European flounder, herring, European plaice.
 Jan 2020                      -66%                   -63%

Figure 11. FIRST SALES OF THE MAIN COMMERCIAL SPECIES IN POLAND, JANUARY 2021

                 -60%
     1.200                                                                                                                          400
                             -60%
       900                                                                                                                          300

       600                                                                 -67%     -64%                                            200
                                                  -69%
       300                                                   -81%                                                                   100
                                                                                                       -85%      -83%

                     Sprat                    European flounder               Herring                European plaice

                                                   Volume (tonnes)             Value (EUR 1000)
Percentages show change from the previous year.

Table 13. FIRST SALES OF THE MAIN COMMERCIAL SPECIES IN PORTUGAL
                           First-sales               First-sales             Main contributing species
                           value / trend %           volume / trend %
       Portugal

 Jan 2021 vs               EUR 15,0 million          4.138 tonnes,           Squid, seabream other than gilthead, anchovy, Atlantic horse
 Jan 2020                  -7%                       -8%                     mackerel.

                               Overview | 1. First sales in Europe | 2. Extra-EU imports | 3. Consumption
                                                                                                                                            8
                       | 4. Fisheries Management in the Baltic | 5. Cuttlefish in the EU | 6. Global highlights |
                                                             7. Macroeconomic context
European Market Observatory for                                                                         MONTHLY HIGHLIGHTS | NO.4/2021
    Fisheries and Aquaculture Products                                                                                 FIRST SALES IN EUROPE

Figure 12. FIRST SALES OF THE MAIN COMMERCIAL SPECIES IN PORTUGAL, JANUARY 2021

                                                                                                                -34%       -4%
        800                                                                                                                                    1.500

        600                                                                                                                                    1.200
                                                            -29%
                                                                                                                                               900
        400                  -51%
                                                                                                                                               600
        200       -58%                            -1%
                                                                                                                                               300
                                                                                  -98% -98%

                     Squid                    Seabream, other*                      Anchovy               Atlantic horse mackerel

                                                    Volume (tonnes)                   Value (EUR 1000)
Percentages show change from the previous year. *EUMOFA aggregation for species

Table 14. FIRST SALES OF THE MAIN COMMERCIAL SPECIES IN SPAIN
                              First-sales               First-sales              Main contributing species
                              value / trend in %        volume / trend %
            Spain

    Jan 2021                  EUR 80,0 million          23.472 tonnes,           Hake, clam, monk, swordfish.
    vs Jan 2020               -22%                      -16%

Figure 13. FIRST SALES OF THE MAIN COMMERCIAL SPECIES IN SPAIN, JANUARY 2021

       6.000                  -20%                                                                                                         20.000
                    -13%
       5.000                                                                                                                               16.000
       4.000
                                                                                                                                           12.000
       3.000
                                                                                                                          -24%             8.000
       2.000                                                                              -32%
                                                            -41%                 -27%                          -27%
       1.000                                     -18%                                                                                      4.000

                     Hake                            Clam                          Monk                         Swordfish

                                                     Volume (tonnes)                   Value (EUR 1000)
Percentages show change from the previous year.

Table 15. FIRST SALES OF THE MAIN COMMERCIAL SPECIES IN SWEDEN
                         First-sales               First-sales            Main contributing
                         value / trend in %        volume / trend         species
        Sweden                                     %

    Jan 2021 vs          EUR 7,3 million,          21.824 tonnes,         Sprat, herring, Norway      One of the causes for sprat increases in
    Jan 2020             +27%                      +91%                   lobster, other marine       volume might be the weather conditions.
                                                                          fish*.                      Indeed, in January 2020 there were frequent
                                                                                                      storms which affected fishing capacity. Better
                                                                                                      weather conditions in January 2021 allowed
                                                                                                      the increase in fishing capacity. Another factor
                                                                                                      to consider is the EU Regulation 7 which
                                                                                                      reduced the total allowable catches (TACs) on
                                                                                                      other species in the Baltic Sea region.
                                                                                                      Compared to 2020, the quota was reduced by
                                                                                                      31% for herring, 86% for cod, 28% for plaice.
                                                                                                      This might have led suppliers to intensify the
                                                                                                      fishing activities on sprat.

7
    Council Regulation (EU) 2020/1579 of 29 October 2020 https://eur-lex.europa.eu/legal-content/EN/ALL/?uri=CELEX:32020R1579

                                   Overview | 1. First sales in Europe | 2. Extra-EU imports | 3. Consumption
                                                                                                                                                         9
                           | 4. Fisheries Management in the Baltic | 5. Cuttlefish in the EU | 6. Global highlights |
                                                              7. Macroeconomic context
European Market Observatory for MONTHLY HIGHLIGHTS | NO.4/2021
Fisheries and Aquaculture Products FIRST SALES IN EUROPE
Figure 14. FIRST SALES OF THE MAIN COMMERCIAL SPECIES IN SWEDEN, JANUARY 2021
12.000 +197% +44% +44% 3.000
9.000 +150%
2.000
6.000
+8%
1.000
3.000
+45% +37% +34%
Sprat Herring Norway lobster Other marine fish*
Volume (tonnes) Value (EUR 1000)
Percentages show change from the previous year. *EUMOFA aggregation for species
Table 16. FIRST SALES OF THE MAIN COMMERCIAL SPECIES IN THE UNITED KINGDOM
First-sales First-sales Main contributing species
value / trend % volume / trend %
The United Kingdom
Jan 2021 vs EUR 61,3 million 46.631 tonnes, Value: haddock, monk, cod.
Jan 2020 -1% +41% Volume: mackerel.
Figure 15. FIRST SALES OF THE MAIN COMMERCIAL SPECIES IN THE UNITED KINGDOM, JANUARY 2021
40.000 +50% 40.000
+74%
30.000 30.000
20.000 20.000
10.000 10.000
-33% -48% +1% -40% -32% -46%
Haddock Monk Cod Mackerel
Volume (tonnes) Value (EUR 1000)
Percentages show change from the previous year.
Overview | 1. First sales in Europe | 2. Extra-EU imports | 3. Consumption
10
| 4. Fisheries Management in the Baltic | 5. Cuttlefish in the EU | 6. Global highlights |
7. Macroeconomic contextEuropean Market Observatory for MONTHLY HIGHLIGHTS | NO.4/2021
Fisheries and Aquaculture Products FIRST SALES IN EUROPE
1.3. Comparison of first-sales prices of selected species in selected countries 8
Figure 16. FIRST-SALES PRICES OF SCABBARDFISH IN FRANCE, ITALY, AND PORTUGAL
7,00
6,00
5,00
4,00
EUR/kg
3,00
2,00
1,00
0,00
2018-M02
2018-M03
2018-M04
2018-M05
2018-M06
2018-M07
2018-M08
2018-M09
2018-M10
2018-M11
2018-M12
2019-M01
2019-M02
2019-M03
2019-M04
2019-M05
2019-M06
2019-M07
2019-M08
2019-M09
2019-M10
2019-M11
2019-M12
2020-M01
2020-M02
2020-M03
2020-M04
2020-M05
2020-M06
2020-M07
2020-M08
2020-M09
2020-M10
2020-M11
2020-M12
2021-M01
France Italy Portugal
EU first sales of scabbardfish take place mainly in Portugal, as well as in France and Italy. Average prices in January 2021
(the most recent available data) were 5,59 EUR/kg in France (12% up from the previous month and unchanged from
January 2020), and 6,46 EUR/kg in Italy (up from both the previous month and year by 55% and 124%, respectively). In
Portugal, the average price was 3,21 EUR/kg (2% higher than December 2020, and 5% lower than January 2020). In January
2021, first-sales volume decreased in all three countries: –8% in France, –94% in Italy, and –14% in Portugal, relative to the
previous year. Scabbardfish fisheries are seasonal, with peaks between April and May in France and Italy, and October to
November in Portugal. Over the 36-month period, scabbardfish prices exhibited different trends in all three countries: an
increasing trend in France, a stable trend in Italy (despite monthly fluctuations), and a decreasing trend in Portugal. During
the same period, supply showed an increasing trend in France and Italy, and the opposite in Portugal.
Figure 17. FIRST-SALES PRICES OF SHRIMP CRANGON SPP. IN BELGIUM, DENMARK, AND THE NETHERLANDS
14,00
12,00
10,00
8,00
EUR/kg
6,00
4,00
2,00
0,00
2018-M02
2018-M03
2018-M04
2018-M05
2018-M06
2018-M07
2018-M08
2018-M09
2018-M10
2018-M11
2018-M12
2019-M01
2019-M02
2019-M03
2019-M04
2019-M05
2019-M06
2019-M07
2019-M08
2019-M09
2019-M10
2019-M11
2019-M12
2020-M01
2020-M02
2020-M03
2020-M04
2020-M05
2020-M06
2020-M07
2020-M08
2020-M09
2020-M10
2020-M11
2020-M12
2021-M01
Belgium Denmark Netherlands
EU first sales of shrimp Crangon spp. occur in multiple countries, including Belgium, Denmark, and most notably the
Netherlands. In January 2021, the average first-sales prices of shrimp Crangon spp. were: 5,96 EUR/kg in Belgium (down
from both the previous month and year by 15% and 33%, respectively); 3,82 EUR/kg in Denmark (11% higher than
December 2020, and 4% lower than January 2020); and 3,23 EUR/kg in the Netherlands (7% up from the previous month
and 18% down from the previous year). In January 2021, supply increased in Belgium (+53%) and decreased in
Denmark (–50%) and the Netherlands (–19%) relative to January 2020. Volumes sold in the three markets are seasonal. In
Denmark they peak in March–May, and September–November in Belgium and the Netherlands. Over the past 36 months,
8
First sales data updated on 20.03.2021.
Overview | 1. First sales in Europe | 2. Extra-EU imports | 3. Consumption
11
| 4. Fisheries Management in the Baltic | 5. Cuttlefish in the EU | 6. Global highlights |
7. Macroeconomic contextEuropean Market Observatory for MONTHLY HIGHLIGHTS | NO.4/2021
Fisheries and Aquaculture Products FIRST SALES IN EUROPE
shrimp Crangon spp. prices showed downward trends. At the same time, volume showed an opposite trend in all the
three countries.
Figure 18. FIRST-SALES PRICES OF COLDWATER SHRIMP IN DENMARK, SPAIN, AND SWEDEN
18,00
16,00
14,00
12,00
10,00
EUR/kg
8,00
6,00
4,00
2,00
0,00
2018-M02
2018-M03
2018-M04
2018-M05
2018-M06
2018-M07
2018-M08
2018-M09
2018-M10
2018-M11
2018-M12
2019-M01
2019-M02
2019-M03
2019-M04
2019-M05
2019-M06
2019-M07
2019-M08
2019-M09
2019-M10
2019-M11
2019-M12
2020-M01
2020-M02
2020-M03
2020-M04
2020-M05
2020-M06
2020-M07
2020-M08
2020-M09
2020-M10
2020-M11
2020-M12
2021-M01
Denmark Spain Sweden
EU first sales of coldwater shrimp occur predominantly in Denmark and Sweden, as well as in Spain. In January 2021,
the average first-sales prices of coldwater shrimp were: 4,99 EUR/kg in Denmark (up from both the previous month and
year by 27% and 31%, respectively); 7,88 EUR/kg in Spain (+28% from December 2020, and +145% from January 2020);
11,21 EUR/kg in Sweden (13% higher than December 2020, and 8% higher than January 2020). In January 2021, supply
increased significantly in Spain (+219%), and decreased in Denmark (–59%) and Sweden (–30%) compared to December
2020. First-sales volume fluctuated highly in Denmark and Spain and was more stable in Sweden. Supply has different
peaks across the three countries. Prices showed high volatility in Sweden; however, in the long term, prices in Sweden and
Spain exhibited an upward trend, while the opposite took place in Denmark. Over the past three years, supply was stable
and displayed an upward trend in Sweden; at the same time, it exhibited a downward trend in Denmark and Spain.
1.4. Commodity group of the month: crustaceans 9
Figure 19. FIRST-SALES COMPARISON AT CG, MCS, AND ERS LEVELS FOR REPORTING COUNTRIES 10,
FEBRUARY 2018 - JANUARY 2021
50,0
16,0
40,0 14,0
Value (million EUR)
12,0
Value (million EUR)
30,0 10,0
8,0
20,0
6,0
10,0 4,0
2,0
0,0 0,0
2018 2019 2020 2021 2018 2019 2020 2021
Crustaceans (CG) Norway lobster (MCS)
Squillid (MCS) Spottail mantis squillid (ERS) Spottail mantis squillid (ERS) Norway lobster (ERS)
Norway lobster (ERS)
The “Crustaceans” commodity group (CG 11) recorded the fifth highest first-sales value and eighth highest volume out of the
10 CGs recorded in January 2021 12. First sales reached a value of EUR 22,2 million and a volume of 3.122 tonnes, representing
9
First sales data updated on 16.03.2021.
10
Norway and the UK excluded from the analyses.
11
Annex 3: http://eumofa.eu/supply-balance-and-other-methodologies
12
More data on commodity groups can be found in Table 1.2 of the Annex.
Overview | 1. First sales in Europe | 2. Extra-EU imports | 3. Consumption
12
| 4. Fisheries Management in the Baltic | 5. Cuttlefish in the EU | 6. Global highlights |
7. Macroeconomic contextEuropean Market Observatory for MONTHLY HIGHLIGHTS | NO.4/2021
Fisheries and Aquaculture Products FIRST SALES IN EUROPE
decreases of 16% and 18%, respectively, from January 2020. In the past 36 months, the highest first-sales value of
crustaceans was registered at EUR 54,3 million, in August 2018.
The crustaceans commodity group includes 11 main commercial species (MCS): crab, lobster Homarus spp., Norway lobster,
rock lobster and sea crawfish, shrimp Crangon spp., coldwater shrimp, deep-water rose shrimp, warmwater shrimp, other
miscellaneous shrimps, squillid, and the grouping “other crustaceans” 13.
At Electronic Recording and Reporting System (ERS) level, Norway lobster (30%) and spottail mantis squillid (8%) together
accounted for 38% of the total first-sales value of crustaceans of all reporting countries 14 recorded in January 2021.
1.5. Focus on Norway lobster
Norway lobster (Nephrops norvegicus) is a crustacean species that belongs
to the Nephropidae family. It can be found throughout the Atlantic, from
Iceland, the Faroe Islands, and Norway to the Azores and the
Mediterranean Sea. It lives on muddy bottoms at depths of 20–800 m, and
feeds on crustaceans and worms 15.
Norway lobster males can live up to 12 years and females up to 30 years and can reach a size of typically between 10 and
20 cm long. The species reaches sexual maturity between two and three years of age. Spawning occurs in summer.
Commercially important stocks of Norway lobster in EU waters include those in the Irish and North Seas, Bay of Biscay, and
on the Atlantic–Iberian coast 16.
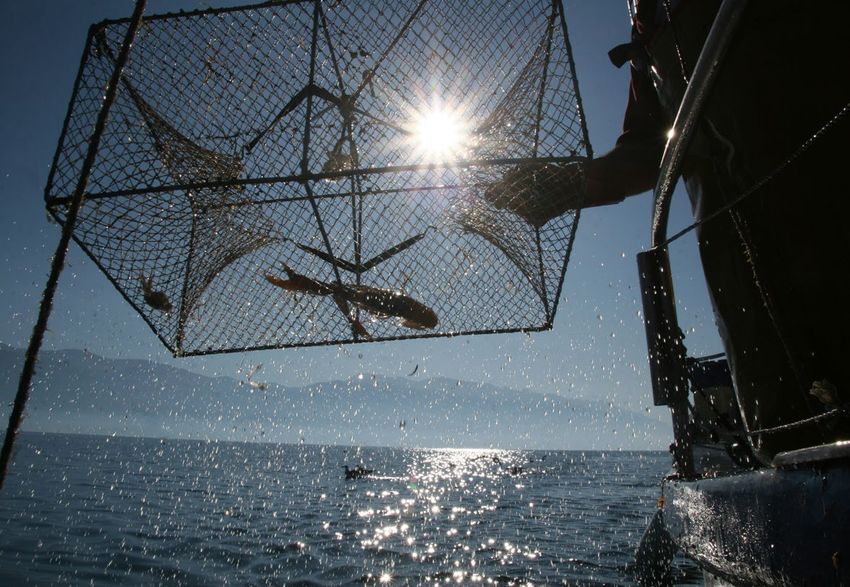
The most common fishery method for catching Norway lobster is trawling. This usually takes place at dusk and dawn, twice
per day, when lobsters leave their burrows to feed. A substantial share of the catches of Norway lobster comes from mixed-
species fisheries.
In the EU, Norway lobster is subject to a long-term management plan in the North Sea 17, which includes technical measures
and total allowable catches (TACs) 18 set by the European Council based on European Commission proposals. There is also a
minimum size for Norway lobster in the Skagerrak/Kattegat region (130 mm overall length, 40 mm for tails) and
Mediterranean Sea (70 mm in overall length, 20 mm length of shell) 19.
Selected countries
Table 17. COMPARISON OF NORWAY LOBSTER FIRST-SALES PRICES, MAIN PLACES OF SALE, AND
CONTRIBUTION TO OVERALL SALES OF CRUSTACEANS IN SELECTED COUNTRIES
Changes in Norway lobster Contribution of
Norway lobster first sales Jan 2021 (%) Norway lobster to Principal places of
Compared to Compared to total crustaceans sale in January 2021
Jan 2020 Jan 2019 first sales in January in terms of first-sales
2021 (%) value
Value +65% +22% 73% Hirtshals, Skagen,
Denmark Østerby.
Volume +108% +56% 68%
France Value +104% +38% 64% Lorient, Guilvinec,
Concarneau.
Volume +123% +37% 51%
Sweden Value +8% -2% 45% Göteborg (100% of first
sales)
Volume +45% +16% 54%
13
EUMOFA aggregation for species (Metadata 2, Annex 3: http://eumofa.eu/supply-balance-and-other-methodologies).
14
Norway and the UK excluded from the analyses – no data at ERS level available.
15
http://www.fao.org/fishery/species/2647/en
16
https://ec.europa.eu/fisheries/marine_species/wild_species/norway_lobster_en
17
Regulation (EU) 2018/973 https://eur-lex.europa.eu/legal-content/EN/TXT/?uri=CELEX%3A32018R0973
18
Council Regulation (EU) 2021/92 https://eur-lex.europa.eu/legal-content/EN/TXT/?uri=CELEX%3A32021R0092
19
Council Regulation(EC) No 2406/96 https://eur-lex.europa.eu/legal-content/EN/TXT/?uri=CELEX%3A01996R2406-20050602
Overview | 1. First sales in Europe | 2. Extra-EU imports | 3. Consumption
13
| 4. Fisheries Management in the Baltic | 5. Cuttlefish in the EU | 6. Global highlights |
7. Macroeconomic contextEuropean Market Observatory for MONTHLY HIGHLIGHTS | NO.4/2021
Fisheries and Aquaculture Products FIRST SALES IN EUROPE
Figure 20. NORWAY LOBSTER: FIRST SALES IN DENMARK, FEBRUARY 2018 - JANUARY 2021
1.200 6,00
1.000 5,00
800 4,00
Volume
600 3,00
Value
400 2,00
200 1,00
0 0,00
Feb
Feb
Feb
Mar
May
Mar
May
Mar
May
Aug
Aug
Apr
Sep
Dec
Apr
Sep
Dec
Aug
Apr
Sep
Dec
Jun
Oct
Jul
Jun
Oct
Jun
Oct
Jan
Jul
Jan
Jul
Jan
Nov
Nov
Nov
2018 2019 2020 2021
Volume (tonnes) Value (milllion EUR)
Over the past 36 months, the highest first sales of Norway lobster in Denmark occurred in August 2019 (861 tonnes)
and August 2020 (720 tonnes). Fishing activity is low in winter due to weather conditions, making supply scarce, which
is reflected by low first sales.
Figure 21. FIRST SALES: COMPOSITION OF “CRUSTACEANS” (ERS LEVEL) IN DENMARK IN VALUE AND
VOLUME, JANUARY 2021
Other Common
2% shrimp Other
8% 2%
Common
Northern shrimp
prawn 12%
16% Northern
prawn
Total value 18%
EUR 3,7 mil
Total volume
669 tonnes
Norway lobster
74% Norway lobster
68%
Figure 22. NORWAY LOBSTER: FIRST SALES IN FRANCE, FEBRUARY 2018 - JANUARY 2021
600 6,00
500 5,00
400 4,00
Volume
300 3,00
Value
200 2,00
100 1,00
0 0,00
Feb
Feb
Feb
Mar
May
Aug
Mar
May
Apr
Sep
Dec
Aug
Mar
May
Aug
Apr
Sep
Dec
Apr
Sep
Dec
Jun
Oct
Jul
Jun
Oct
Jun
Oct
Jan
Jul
Jan
Jul
Jan
Nov
Nov
Nov
2018 2019 2020 2021
Volume (tonnes) Value (million EUR)
Overview | 1. First sales in Europe | 2. Extra-EU imports | 3. Consumption
14
| 4. Fisheries Management in the Baltic | 5. Cuttlefish in the EU | 6. Global highlights |
7. Macroeconomic contextEuropean Market Observatory for MONTHLY HIGHLIGHTS | NO.4/2021
Fisheries and Aquaculture Products FIRST SALES IN EUROPE
Over the past 36 months in France, the highest first sales of common Norway lobster occurred in May and June every
year, peaking in May 2018 when 516 tonnes were sold. France's Norway lobster fishery is characterised by a high supply
during warmer months and lower supply in autumn and winter 20.
Figure 23. FIRST SALES: COMPOSITION OF “CRUSTACEANS” (ERS LEVEL) IN FRANCE IN VALUE AND VOLUME,
JANUARY 2021
Spinous spider
crab
5%
Other Common
Other Common prawn
13% prawn 13%
10%
18%
Spinous
spider
Total value crab
Total volume
EUR 2,8 mil 26%
316 tonnes
Norway lobster Norway lobster
64% 51%
Figure 24. NORWAY LOBSTER: FIRST SALES IN SWEDEN, FEBRUARY 2018 - JANUARY 2021
250 2,50
200 2,00
Volume
150 1,50
Value
100 1,00
50 0,50
0 0,00
Feb
Feb
Feb
Mar
May
Mar
May
Mar
May
Aug
Apr
Sep
Dec
Aug
Apr
Sep
Dec
Aug
Apr
Sep
Dec
Jun
Oct
Jul
Jun
Oct
Jun
Oct
Jan
Jul
Jan
Jul
Jan
Nov
Nov
Nov
2018 2019 2020 2021
Volume (tonnes) Value (million EUR)
Over the past 36 months in Sweden, the highest first sales of common Norway lobster occurred in November 2020
when 26 tonnes were sold. The difference in landing volume between the different months can be explained by
temperature (low temperature in winter months implies low catchability 21), tourism (summer vacationers have a high
preference for consumption of shellfish on the west coast), and tradition (consumption peaks in August as it is the month
for traditional crayfish parties in Sweden, when crustaceans including Norway lobster are eaten 22.
20
http://rua.ua.es/dspace/bitstream/10045/78071/1/TFM_Juan_Francisco_Lechuga_Sanchez_Final.pdf
21
ICES. 2015. Report of the Working Group for the Assessment of Demersal Stocks in the North Sea and Skagerrak (WGNSSK), 28 April–7 May 2014, ICES HQ,
Copenhagen, Denmark. ICES CM 2015/ACOM:13. 1031 pp.
22
S. Hornborg, P. Jonsson, Mattias Sköld, M. Ulmestrand, D. Valentinsson, Ole Ritzau Eigaard, J. Feekings, J. Rasmus Nielsen, F. Bastardie, J. Lövgren, New
policies may call for new approaches: the case of the Swedish Norway lobster (Nephrops norvegicus) fisheries in the Kattegat and Skagerrak, ICES Journal of
Marine Science, Volume 74, Issue 1, January-February 2017, Pages 134–145, https://doi.org/10.1093/icesjms/fsw153
Overview | 1. First sales in Europe | 2. Extra-EU imports | 3. Consumption
15
| 4. Fisheries Management in the Baltic | 5. Cuttlefish in the EU | 6. Global highlights |
7. Macroeconomic contextEuropean Market Observatory for MONTHLY HIGHLIGHTS | NO.4/2021
Fisheries and Aquaculture Products FIRST SALES IN EUROPE
Figure 25. FIRST SALES: COMPOSITION OF “CRUSTACEANS” (ERS LEVEL) IN SWEDEN IN VALUE AND VOLUME,
JANUARY 2021
Other
Other
1%
2%
Norway Northern
Norway prawn
lobster
lobster Northern 44%
54%
45% Total value Total volume
prawn
EUR 2,2 mil 243 tonnes
54%
Price trend
Figure 26. NORWAY LOBSTER: FIRST-SALES PRICES IN SELECTED COUNTRIES, FEBRUARY 2018 -
JANUARY 2021
23,00
21,00
19,00
17,00
15,00
EUR/kg
13,00
11,00
9,00
7,00
5,00
3,00
Feb
Feb
Feb
Mar
May
Aug
Mar
May
Aug
Mar
May
Aug
Apr
Sep
Dec
Apr
Sep
Dec
Apr
Sep
Dec
Jun
Oct
Jul
Jun
Oct
Jan
Jul
Jun
Oct
Jan
Jul
Jan
Nov
Nov
Nov
2018 2019 2020 2021
Denmark France Sweden
Over the 36-month observation period (February 2018 to January 2021), the average first-sales price 23 of Norway lobster
in France was 12,54 EUR/kg, which was 82% higher than in Denmark (6,90 EUR/kg) and 23% higher than in Sweden
(9,70 EUR/kg).
In Denmark in January 2021, the average first-sales price of Norway lobster (5,92 EUR/kg) decreased by 21% compared
with January 2020, and by 22% compared with the same month of 2019. During the past 36 months, average price
ranged from 4,86 EUR/kg for 309 tonnes in March 2020, to 9,79 EUR/kg for 238 tonnes in December 2018.
In France in January 2021, the average first-sales price of Norway lobster (11,16 EUR/kg) decreased by 8% from January
2020 and increased by 1% relative to January 2019. During the observed period, the lowest average price (10,22 EUR/kg
for 516 tonnes) was seen in May 2018, while the highest average price was recorded in December 2018 at 22,04 EUR/kg,
for 42 tonnes. Average price was highest in December each year, a spike linked to the Christmas holidays, which
traditionally prompt higher demand for seafood products, including Norway lobster.
In Sweden in January 2021, the average first-sales price of Norway lobster (7,61 EUR/kg) decreased by 25% compared
with January 2020 and by 15% compared with 2019. During the past 36 months, average price ranged from 4,29 EUR/kg
for four tonnes in November 2018, to 11,59 EUR/kg for 269 kg in January 2019.
23
Weighted average price
Overview | 1. First sales in Europe | 2. Extra-EU imports | 3. Consumption
16
| 4. Fisheries Management in the Baltic | 5. Cuttlefish in the EU | 6. Global highlights |
7. Macroeconomic contextEuropean Market Observatory for MONTHLY HIGHLIGHTS | NO.4/2021
Fisheries and Aquaculture Products FIRST SALES IN EUROPE
1.6. Focus on spottail mantis squillid
Spottail mantis squillid or spottail mantis shrimp (Squilla mantis) is a stomatopod which
belongs to the Squillidae family. It is a species of mantis shrimp found in shallow coastal
areas of the Atlantic from the Gulf of Cádiz, the Canary Islands, and Madeira, to as far
south as Angola, and the Mediterranean Sea. Its abundance has led to it being the only
commercially fished mantis shrimp in the Mediterranean. Squilla mantis digs burrows in muddy and sandy bottoms, remaining
in its burrow during the day and emerging at night to hunt 24. The spawning period is concentrated from winter to spring.
Populations consist of 3 year-classes, with a maximum age of 3 years. The species can reach a maximum size of 20 cm, but
more commonly has a length of 12 to 18 cm 25.
It is found in high densities in the Mediterranean Sea, and Italy and Spain are among the most important EU catching nations
in terms of volume. Spottail mantis squillid fisheries are highly seasonal, as catches occur mainly in the winter and spring
months. The species is mainly caught by bottom trawlers, although catches with trammel nets, gill nets, and baited traps also
occur. It also presents an important by-catch of the fishing activity carried out on the continental shelf at depths
of 30 to 80 m 26. In the EU, the fishery for spottail mantis squillid is not specially regulated. There are some technical measures
(seasonal closures, minimum mesh size, fishing area restrictions) applied to trawl fisheries at a national level, which indirectly
contribute to better management of this species.
Selected countries
Table 18. COMPARISON OF SPOTTAIL MANTIS SQUILLID FIRST-SALES PRICES, MAIN PLACES OF SALE AND
CONTRIBUTION TO OVERALL SALES OF CRUSTACEANS IN SELECTED COUNTRIES
Changes in spottail mantis Contribution of Principal places of sales
Spottail mantis squillid first sales spottail mantis in Jan-Jan 2020 in
Jan 2021 (%) squillid to total terms of first-sales
squillid crustaceans first value
Compared to Compared to sales in January
Jan 2020 Jan 2019 2021 (%)
Italy Value -15% +10% 24% Porto Garibaldi, Porto Tolle,
Rimini.
Volume -18% +37% 36%
Spain Value -16% -3% 9% Sanlúcar De Barrameda,
Sant Carles de la Rápita,
Volume -25% -9% 19%
Peñíscola.
24
. Maynou, P. Abelló & P. Sartor (2004). "A review of the fisheries biology of the mantis shrimp, Squilla mantis (L., 1758) (Stomatopoda, Squillidae) in the
Mediterranean". Crustaceana. 77 (9): 1081–1099
25
https://www.sealifebase.ca/summary/Squilla-mantis
26
Maynou, Francesc & Abello, Pere & Sartor, Paolo. (2004). A review of the fisheries biology of the mantis shrimp, Squilla mantis (L., 1758) (Stomatopoda,
Squillidae) in the Mediterranean. Crustaceana. 77. 1081-1099.
https://www.researchgate.net/publication/249580772_A_review_of_the_fisheries_biology_of_the_mantis_shrimp_Squilla_mantis_L_1758_Stomatopoda_Squill
idae_in_the_Mediterranean
Overview | 1. First sales in Europe | 2. Extra-EU imports | 3. Consumption
17
| 4. Fisheries Management in the Baltic | 5. Cuttlefish in the EU | 6. Global highlights |
7. Macroeconomic contextEuropean Market Observatory for MONTHLY HIGHLIGHTS | NO.4/2021
Fisheries and Aquaculture Products FIRST SALES IN EUROPE
Figure 27. SPOTTAIL MANTIS SQUILLID: FIRST SALES IN ITALY, FEBRUARY 2018 - JANUARY 2021
700 2,50
600
2,00
500
Volume
400 1,50
Value
300 1,00
200
0,50
100
0 0,00
Feb
Feb
Feb
Mar
May
Aug
Mar
May
Mar
May
Apr
Sep
Dec
Aug
Apr
Sep
Dec
Aug
Apr
Sep
Dec
Jun
Oct
Jul
Jun
Oct
Jun
Oct
Jan
Jul
Jan
Jul
Jan
Nov
Nov
Nov
2018 2019 2020 2021
Volume (tonnes) Value (million EUR)
In Italy, over the past 36 months the spottail mantis squillid fishery was marked with seasonal variations in catch with
the highest first sales registered during autumn and winter. The greatest peak in first sales was recorded in
November 2019, when 622 tonnes were sold.
Figure 28. FIRST SALES: COMPOSITION OF “CRUSTACEANS” (ERS LEVEL) IN ITALY IN VALUE AND VOLUME,
JANUARY 2021
Norway
lobster
Caramote Caramote 4%
prawn prawn
Spottail 21% 10%
mantis
squillid
24% Spottail
mantis
Norway
Total value squillid
lobster Total volume
36%
Other EUR 4,2 mil 11% 581 tonnes
22%
Deep-water rose Deep-water rose
shrimp Other
12% shrimp
22% 38%
Figure 29. SPOTTAIL MANTIS SQUILLID: FIRST SALES IN SPAIN, FEBRUARY 2018 - JANUARY 2021
240 1,00
200 0,80
160
Volume
0,60
120
Value
0,40
80
40 0,20
0 0,00
Feb
Feb
Feb
Mar
May
Aug
Mar
May
Aug
Mar
May
Apr
Sep
Dec
Apr
Sep
Dec
Aug
Apr
Sep
Dec
Jun
Oct
Jul
Jun
Oct
Jun
Oct
Jan
Jul
Jan
Jul
Jan
Nov
Nov
Nov
2018 2019 2020 2021
Volume (tonnes) Value (1000 EUR)
In Spain, over the past 36 months the spottail mantis squillid fishery fluctuated regularly, with the highest first sales
registered during the winter mating period, making it a seasonal fisheries species. The highest first sales were recorded
in January 2020 when 213 tonnes were sold.
Overview | 1. First sales in Europe | 2. Extra-EU imports | 3. Consumption
18
| 4. Fisheries Management in the Baltic | 5. Cuttlefish in the EU | 6. Global highlights |
7. Macroeconomic contextEuropean Market Observatory for MONTHLY HIGHLIGHTS | NO.4/2021
Fisheries and Aquaculture Products FIRST SALES IN EUROPE
Figure 30. FIRST SALES: COMPOSITION OF “CRUSTACEANS” (ERS LEVEL) IN SPAIN IN VALUE AND VOLUME,
JANUARY 2021
Spottail mantis squillid Blue and red
shrimp Blue and red
9%
10% shrimp
2%
Southern pink
shrimp Southern pink
Spottail mantis
7% shrimp
squillid
13%
19%
Other
41% Total value Total volume
EUR 7,6 mil 837 tonnes
Other
31%
Deep-water
Deep-water
rose shrimp
rose shrimp
33% 35%
Price trend
Figure 31. SPOTTAIL MANTIS SQUILLID: FIRST-SALES PRICES IN SELECTED COUNTRIES, FEBRUARY 2018 -
JANUARY 2021
10,00
8,00
EUR/kg
6,00
4,00
2,00
Feb
Feb
Feb
Mar
May
Mar
May
Mar
May
Aug
Apr
Sep
Dec
Aug
Apr
Sep
Dec
Aug
Apr
Sep
Dec
Jun
Oct
Jul
Jun
Oct
Jun
Oct
Jan
Jul
Jan
Jul
Jan
Nov
Nov
Nov
2018 2019 2020 2021
Italy Spain
Over the 36-month observation period (February 2017 – January 2021), the average first-sales 27 price of spottail mantis
squillid in Italy (5,17 EUR/kg) was 19% higher than that in Spain (4,18 EUR/kg). In general, average price is linked with
supply, meaning lower price occurs when supply is the highest in winter, while price increases when supply is scarce.
In Italy, in January 2021 the average first-sales price of spottail mantis squillid was 4,64 EUR/kg, 3% over the same
month in 2020 and 20% lower compared to January 2019. The lowest price in the past 36 months was registered in
November 2019, at 3,25 EUR/kg for 622 tonnes. The highest price of 9,11 EUR/kg was observed in March 2018 when the
supply was lowest (67 tonnes).
In Spain in January 2021, the average first-sales price of spottail mantis squillid (4,22 EUR/kg) increased
by 13% compared to January 2020 and by 6% compared to January 2019. The lowest average price was registered in
October 2019 at 2,14 EUR/kg for 88 tonnes. The highest average price at 6,74 EUR/kg for 68 tonnes was registered in
April 2018.
27
Weighted average price
Overview | 1. First sales in Europe | 2. Extra-EU imports | 3. Consumption
19
| 4. Fisheries Management in the Baltic | 5. Cuttlefish in the EU | 6. Global highlights |
7. Macroeconomic contextEuropean Market Observatory for MONTHLY HIGHLIGHTS | NO.4/2021
Fisheries and Aquaculture Products EXTRA-EU IMPORTS
2. Extra-EU imports
Every month, the weekly extra-EU import prices (average values per week, in EUR per kg) are examined for nine different
species. The three most relevant species in terms of value and volume remain consistent, and are examined every month:
fresh whole Atlantic salmon from Norway, frozen Alaska pollock fillets from China, and frozen tropical shrimp (Penaeus spp.)
from Ecuador. The other six species change each month. Three are chosen from the commodity group of the month, which
this month is “Crustaceans”. The featured commodity species this month are: frozen Norway lobsters from Iceland, frozen
crabs from Norway, and prepared or preserved shrimps and prawns from Vietnam. The remaining three species examined
each month are randomly selected and, this month, include frozen Atlantic and Danube salmon from Chile, prepared or
preserved sardines (whole or in pieces) from Morocco, and prepared or preserved tunas, skipjack, or other fish of genus
Euthynnus from Thailand.
Table 19. EVOLUTION OF WEEKLY PRICE AND VOLUME OF THE THREE MOST RELEVANT FISHERIES AND
AQUACULTURE PRODUCTS IMPORTED INTO THE EU
Extra-EU Imports Week Preceding 4- Week 09/2020 Notes
09/2021 week average
Fresh whole Price 6,02 5,20 (+16%) 7,19 (–16%) Lower average price in February
Atlantic salmon (EUR/kg) 2021 than February 2020, but
imported from higher than February 2019.
Norway (Salmo Upward trend since the beginning of
salar, the year.
CN code 03021440) Volume 10.832 12.344 (–12%) 11.096 (–2%) Higher average volume in February
(tonnes) 2021 than February 2020, and
slightly higher than February 2019.
Downward trend since the beginning
of the year.
Frozen Alaska Price 2,44 2,46 (–1%) 2,92 (–16%) February 2021 average price was
pollock fillets (EUR/kg) lower than the same month in
imported from previous year, and close to the
China (Theragra February 2019 price. Downward
chalcogramma, trend since the beginning of the
CN code 03047500) year.
Volume 2.029 2.362 (–14%) 2.759 (–26%) Fluctuations in supply. Lower
(tonnes) average volume in February 2021
than the same month in previous
years. Downward trend since the
beginning of the year.
Frozen tropical Price 4,67 5,10 (–8%) 5,79 (–19%) Downward trend since
shrimp imported (EUR/kg) week 1 of 2021. Average price in
from Ecuador February 2021 slightly lower than
(genus Penaeus, February 2019 and 2020 prices.
CN code 03061792) Volume 2.884 1.708 (+69%) 1.809 (+59%) Fluctuations in supply. Upward trend
(tonnes) since week 1 of 2021. Average
volume in February 2021 higher
compared with January 2019
and 2020.
Source: European Commission (updated 20.03.2021).
Overview | 1. First sales in Europe | 2. Extra-EU imports | 3. Consumption
20
| 4. Fisheries Management in the Baltic | 5. Cuttlefish in the EU | 6. Global highlights |
7. Macroeconomic contextEuropean Market Observatory for MONTHLY HIGHLIGHTS | NO.4/2021
Fisheries and Aquaculture Products EXTRA-EU IMPORTS
Figure 32. IMPORT PRICE OF FRESH AND WHOLE ATLANTIC SALMON FROM NORWAY, 2018 - 2021
Source: European Commission (updated 20.03.2021).
Figure 33. IMPORT PRICE OF FROZEN ALASKA POLLOCK FILLETS FROM CHINA, 2018 - 2021
Source: European Commission (updated 20.03.2021).
Figure 34. IMPORT PRICE OF FROZEN TROPICAL SHRIMP FROM ECUADOR, 2018 - 2021
Source: European Commission (updated 20.03.2021).
Overview | 1. First sales in Europe | 2. Extra-EU imports | 3. Consumption
21
| 4. Fisheries Management in the Baltic | 5. Cuttlefish in the EU | 6. Global highlights |
7. Macroeconomic contextEuropean Market Observatory for MONTHLY HIGHLIGHTS | NO.4/2021
Fisheries and Aquaculture Products EXTRA-EU IMPORTS
Table 20. EVOLUTION OF WEEKLY PRICE AND VOLUME OF THIS MONTH'S THREE FEATURED COMMODITY
PRODUCTS IMPORTED INTO THE EU
Extra-EU Imports Week Preceding 4- Week 09/2020 Notes
09/2021 week average
Frozen Norway Price 78,07* 1,20** (+6407%) n/a Trade flow is limited. High fluctuations
lobsters from (EUR/kg) in price. Upward trend over the past
Iceland (Nephrops three years.
norvegicus, Volume 0,019 3.000 (–99%) n/a Data is limited. High fluctuations in
CN code 03061500) (tonnes) supply. Downward trend from
week 10 of 2018 to week 7 of 2021.
Frozen crabs from Price 27,66 41,16 (–33%) 26,81 (+3%) Upward trend from 2018 to 2021. On
Norway (Paralithodes (EUR/kg) average, price is around 35,66 EUR/kg.
camchaticus, Volume 5 6 (–25%) 10 (–53%) High fluctuations in supply,
Chionoecetes spp. and (tonnes) from 0,005 to 92 tonnes. Downward
Callinectes sapidus, trend from 2018 to 2021.
CN code 03061410)
Prepared or Price 6,72*** 6,71**** (+0%) 6,60*****(+2%) Downward trend over the past three
preserved shrimps (EUR/kg) years. On average, price is
and prawns from around 7,27 EUR/kg. Price spike in
Vietnam week 47 of 2019 correlates with drop
(CN code 16052110) in supply.
Volume 164*** 145**** (+13%) 168***** (–3%) Fluctuations in supply, from 53 to
(tonnes) 329 tonnes. Upward trend over the past
three years.
Source: European Commission (updated 20.03.2021).
* Data refers to week 7 of 2021 (the most recent available); **data refers to week 5 of 2021; *** data refers to week 8 of 2021; **** average of weeks 4 to 7
of 2021; ***** data refers to week 8 of 2020.
Figure 35. IMPORT PRICE OF FROZEN NORWAY LOBSTERS FROM ICELAND, 2018 - 2021
Source: European Commission (updated 20.03.2021).
Overview | 1. First sales in Europe | 2. Extra-EU imports | 3. Consumption
22
| 4. Fisheries Management in the Baltic | 5. Cuttlefish in the EU | 6. Global highlights |
7. Macroeconomic contextEuropean Market Observatory for MONTHLY HIGHLIGHTS | NO.4/2021
Fisheries and Aquaculture Products EXTRA-EU IMPORTS
Figure 36. IMPORT PRICE OF FROZEN CRABS FROM NORWAY, 2018 - 2021
Source: European Commission (updated 20.03.2021).
Figure 37. IMPORT PRICE OF PREPARED OR PRESERVED SHRIMPS AND PRAWNS FROM VIETNAM, 2018 - 2021
Source: European Commission (updated 20.03.2021).
In 2018 – 2021, the average price of frozen Norway lobsters from Iceland displayed an increasing trend.
Over the past three years, price fluctuated from 1,20 to 78,08 EUR/kg.
Both price and volume of frozen crabs from Norway showed a downward trend since week 1 of 2021.
Over the past three years, price fluctuated from 1,15 to 46,54 EUR/kg.
In 2018 – 2021, price of prepared or preserved shrimps and prawns from Vietnam fluctuated
from 5,75 to 10,27 EUR/kg. Since the beginning of 2021, price exhibited an upward trend while volume
showed the opposite.
Overview | 1. First sales in Europe | 2. Extra-EU imports | 3. Consumption
23
| 4. Fisheries Management in the Baltic | 5. Cuttlefish in the EU | 6. Global highlights |
7. Macroeconomic contextEuropean Market Observatory for MONTHLY HIGHLIGHTS | NO.4/2021
Fisheries and Aquaculture Products EXTRA-EU IMPORTS
Table 21. EVOLUTION OF WEEKLY PRICE AND VOLUME OF EU IMPORTS OF OTHER THREE FISHERIES AND
AQUACULTURE PRODUCTS RELEVANT TO THE EU MARKET
Extra-EU Imports Week Preceding 4- Week 09/2020 Notes
09/2021 week average
Frozen Atlantic and Price 3,74 3,70 (+1%) 4,92 (–24%) Downward trend from 2018 to 2021.
Danube salmon (EUR/kg) On average, price is around 3,55
from Chile (Salmo EUR/kg. Price decreases do not correlate
salar and Hucho with increase of supply.
hucho, Volume 58 33 (+75%) 20 (+188%) High fluctuations in supply,
CN code 03031300) (tonnes) from 5 to 497 tonnes. Upward trend
from 2018 to 2021.
Prepared or Price 3,64 3,47 (+5%) 3,27 (+11%) Stable trend from 2018 to 2021. On
preserved sardines (EUR/kg) average price is around 3,33 EUR/kg.
from Morocco Price spikes correlate with drop of
(CN code 16041319) supply.
Volume 342 446 (–23%) 609 (–44%) Slight downward trend from 2018 to
(tonnes) 2021. High fluctuations in supply,
from 236 to 1.144 tonnes.
Prepared or Price 3,50 5,76 (–39%) 2,91 (+20%) Stable trend from 2018 to 2021. On
preserved tunas (EUR/kg) average price is around 3,76 EUR/kg.
from Thailand Price spikes correlate with sudden drop
(CN code 16042070) of supply.
Volume 25,8 26,1 (–1%) 14 (+87%) Volume exhibited a stable trend from
(tonnes) 2018 to 2020, despite high weekly
fluctuations. Volume ranged
from 0,009 to 2.314 tonnes.
Source: European Commission (updated 20.03.2021).
Figure 38. IMPORT PRICE OF FROZEN ATLANTIC AND DANUBE SALMON FROM CHILE, 2018 - 2021
Source: European Commission (updated 20.03.2021).
Overview | 1. First sales in Europe | 2. Extra-EU imports | 3. Consumption
24
| 4. Fisheries Management in the Baltic | 5. Cuttlefish in the EU | 6. Global highlights |
7. Macroeconomic contextEuropean Market Observatory for MONTHLY HIGHLIGHTS | NO.4/2021
Fisheries and Aquaculture Products EXTRA-EU IMPORTS
Figure 39. IMPORT PRICE OF PREPARED OR PRESERVED SARDINES FROM MOROCCO, 2018 - 2021
Source: European Commission (updated 20.03.2021).
Figure 40. IMPORT PRICE OF PREPARED OR PRESERVED TUNAS FROM THAILAND, 2018 - 2021
Source: European Commission (updated 20.03.2021).
Since the first week of January 2021, the prices of frozen Atlantic and Danube salmon from Chile have
exhibited an upward trend, while volume has displayed an opposite trend.
During the first nine weeks of 2021, price of prepared or preserved sardines from Morocco exhibited a
slight downward trend. Over the past three years, price ranged from 2,88 EUR/kg to 3,83 EUR/kg.
Since the beginning of the year, price of prepared or preserved tunas from Thailand exhibited an
upward trend, while volume had an opposite trend. Over the past three years, price ranged
from 1,58 EUR/kg to 24,24 EUR/kg.
Overview | 1. First sales in Europe | 2. Extra-EU imports | 3. Consumption
25
| 4. Fisheries Management in the Baltic | 5. Cuttlefish in the EU | 6. Global highlights |
7. Macroeconomic contextEuropean Market Observatory for MONTHLY HIGHLIGHTS | NO.4/2021
Fisheries and Aquaculture Products CONSUMPTION
3. Consumption
3.1. HOUSEHOLD CONSUMPTION IN THE EU
In January 2021, household consumption of fresh fisheries and aquaculture products increased in both volume and value
relative to January 2020 in the majority of the Member States analysed. Italy and Spain saw the highest increase. Salmon
was the main species responsible for the increase in both Italy (+69%) and Spain (+34%). The additional species contributing
to the increase were gilthead seabream in Italy (+37%) and cod and sardine in Spain (+64% and +62%, respectively).
Salmon and cod were the main species responsible for increased consumption in Germany (+17% and +87%, respectively),
as well as in France (+42% and +14%, respectively). During the aforementioned period, salmon was also the most consumed
species in Ireland, with consumption increasing by 31%, as well as miscellaneous shrimp (+208%).
Table 22. JANUARY OVERVIEW OF THE REPORTING COUNTRIES (volume in tonnes and value in million EUR)
Per capita
consumption
2018* Change from
Country (live weight January 2019 January 2020 December 2020 January 2021 January 2020 to
equivalent, January 2021
LWE)
kg/capita/year
Volume Value Volume Value Volume Value Volume Value Volume Value
Denmark 39,83 1.016 16,09 1.145 17,77 1.176 20,95 1.195 18,59 4% 5%
France 33,52 16.920 192,16 14.629 182,37 28.207 333,51 17.164 215,37 17% 18%
Germany 14,50 5.424 75,49 5.097 75,95 8.530 123,97 7.015 97,36
38% 28%
7%
Hungary 6,12 245 1,22 402 2,24 2.388 11,97 373 2,37 6%
Ireland 23,13 1.067 15,43 897 13,67 1.014 15,32 1.423 22,60 59% 65%
Italy 31,02 23.441 245,98 22.414 242,23 40.676 438,25 26.954 295,59
20% 22%
Netherlands 20,90 2.252 35,92 2.305 37,47 3.923 71,32 2.656 44,06 18%
15%
Poland 13,02 3.653 22,20 3.405 22,55 12.102 65,94 3.855 26,71 13% 18%
Portugal 60,92 5.267 35,43 4.975 36,57 7.556 57,65 6.429 44,11 29% 21%
Spain 46,01 50.314 403,19 44.557 383,18 63.681 591,89 48.773 433,82 9% 13%
Sweden 26,61 610 8,62 522 7,40 1.220 15,48 930 11,96 78% 62%
Source: EUMOFA, based on Europanel (updated 25.03.2021).
*Data on per capita consumption of all fisheries and aquaculture products for all EU Member States can be found at:
https://www.eumofa.eu/documents/20178/415635/EN_The+EU+fish+market_2020.pdf/
Over the past three years, average household consumption of fresh fisheries and aquaculture products in January has been
below the annual average in terms of both volume and value, in the majority of Member States analysed. Only in Denmark,
Germany, and Ireland were the average volume and value higher in January than the yearly average.
The most recent weekly consumption data (up to week 12 of 2021) are available on the EUMOFA website and can be
accessed here.
Overview | 1. First sales in Europe | 2. Extra-EU imports | 3. Consumption
26
| 4. Fisheries Management in the Baltic | 5. Cuttlefish in the EU | 6. Global highlights |
7. Macroeconomic contextEuropean Market Observatory for MONTHLY HIGHLIGHTS | NO.4/2021
Fisheries and Aquaculture Products CONSUMPTION
3.2. Fresh flounder
Habitat: A flatfish living in marine, fresh, and brackish waters, up to depths of 100 m.
Catch area: Eastern Atlantic (coastal and brackish waters of western Europe), from the White Sea to the Mediterranean
and the Black Sea.
Catching countries in the EU: Denmark, Latvia, the Netherlands, Poland.
Production method: Caught.
Main consumers in the EU: Denmark, Sweden, the Netherlands.
Presentation: Whole, fillets.
Preservation: Fresh, chilled, frozen.
3.2.1. Overview of household consumption in Denmark and Sweden
Denmark and Sweden are among the EU Member States with a high per capita apparent consumption 28 of fisheries and
aquaculture products. In Denmark in 2018, this amounted to 39,83 kg, which is an increase of 14% compared to the
previous year. This was 29% higher than the EU average (24,36 kg LWE). It was 54% lower than per capita apparent
consumption of Malta 29, the Member State with the highest per capita apparent consumption (85,95 kg LWE) in 2018.
In 2018, Sweden’s per capita apparent consumption was 26,61 kg, 4% lower than in 2017, and 33% lower than in
Denmark, but 9% higher than the EU average (2018).
See more on per capita apparent consumption in the EU in Table 23.
Over the past three years (from February 2018 to January 2021), total household consumption of fresh flounder was
608% higher in Denmark – at 3.395 tonnes – than in Sweden, at 480 tonnes. During the same period, Danish consumers
spent 5% less for a kilogram of fresh flounder (14,77 EUR/kg on average), than Swedish consumers (15,52 EUR/kg).
We have covered flounder in previous Monthly Highlights:
First Sales: Estonia 3/2018; Latvia 3/2018, 10/2015; Lithuania 3/2018, 6/2016, 2/2015, 1/2014; Sweden 7/2015,
May 2013.
Consumption: Denmark 7/2016; Sweden 11/2018, 7/2016.
28
"Apparent consumption" is calculated by using the supply balance sheet that provides an estimate of the supply of fisheries and aquaculture products
available for human consumption at the EU level. The calculation of the supply balance sheet is based on the equation: Apparent consumption = [(total catches
– industrial catches) + aquaculture + imports] – exports. Catches targeted for fishmeal (industrial catches) are excluded. Non-food use products are also
excluded from imports and exports. It is worth highlighting that the methodologies for estimating apparent consumption at EU and Member State levels are
different, the first being based on data and estimates as described in the Methodological Background, the latter also requiring the adjustment of abnormal
trends due to the higher impact of stock changes.
29
The high per capita apparent consumption in Malta could be due to higher consumption of fisheries and aquaculture products during the tourist season.
Overview | 1. First sales in Europe | 2. Extra-EU imports | 3. Consumption
27
| 4. Fisheries Management in the Baltic | 5. Cuttlefish in the EU | 6. Global highlights |
7. Macroeconomic contextYou can also read