Monthly Report - The Vienna Institute for ...
←
→
Page content transcription
If your browser does not render page correctly, please read the page content below
MARCH 2021
Monthly Report

Global Trade Expansion Stalled Even before the COVID-19 Pandemic

How to Explain the Deteriorating Trend in Turkey’s Economic
Performance?

Is Higher COVID-19 Mortality Hurting Economic Growth?

What do we Know about the Pharmaceutical Companies Producing
Vaccine for COVID-19?

The Vienna Institute for International Economic Studies
Wiener Institut für Internationale Wirtschaftsvergleiche

Global Trade Expansion Stalled Even before the
COVID-19 Pandemic

How to Explain the Deteriorating Trend in Turkey’s
Economic Performance?

Is Higher COVID-19 Mortality Hurting Economic
Growth?

What do we Know about the Pharmaceutical
Companies Producing Vaccine for COVID-19?

VASILY ASTROV
SERKAN ÇIÇEK
MAHDI GHODSI
BRANIMIR JOVANOVIC
CONTENTS

Chart of the month: Global trade expansion stalled even before the COVID-19 pandemic...... 7

Opinion Corner: How to explain the deteriorating trend in Turkey’s economic
performance? ............................................................................................................................................................... 9

Is higher COVID-19 mortality hurting economic growth?..................................................................... 13

What do we know about the pharmaceutical companies producing vaccine for COVID-19? ...18

Monthly and quarterly statistics for Central, East and Southeast Europe.................................... 25

Index of subjects – March 2020 to March 2021 .......................................................................................... 49
CHART OF THE MONTH                                                                                                         7
                                                                                         Monthly Report 2021/03

Chart of the month: Global trade expansion
stalled even before the COVID-19 pandemic
                                                                                                  BY VASILY ASTROV

The first wave of the COVID-19 pandemic resulted in a sharp decline in global trade. In the second
quarter of 2020, global trade volume in goods plunged by 11.7% (on a quarterly basis), mirrored by a
similarly big drop in industrial production. This was mainly due to the lockdowns imposed and the border
closures, which badly affected cross-border value chains (although the collapse in demand, for instance
for cars, played a role as well). These disruptions proved largely temporary, and trade in goods
rebounded strongly (by 11.5%) in the third quarter and by another 4% in the fourth quarter. 1 Still,
because of the sharp contraction in the second quarter, trade in goods slumped by 5.3% for 2020 as a
whole.

Global trade and industrial production, January 2015 = 100

                                Global trade volume (goods)             Global industrial production

    115

    110

    105

    100

     95

     90
          2015-01
          2015-03
          2015-05
          2015-07
          2015-09
          2015-11
          2016-01
          2016-03
          2016-05
          2016-07
          2016-09
          2016-11
          2017-01
          2017-03
          2017-05
          2017-07
          2017-09
          2017-11
          2018-01
          2018-03
          2018-05
          2018-07
          2018-09
          2018-11
          2019-01
          2019-03
          2019-05
          2019-07
          2019-09
          2019-11
          2020-01
          2020-03
          2020-05
          2020-07
          2020-09
          2020-11

Source: Netherlands Bureau for Economic Policy Analysis (CPB), World Trade Monitor.

However, as the chart above demonstrates, trade expansion had lost momentum well before the
outbreak of the COVID-19 pandemic. After having increased by 4.9% in 2017 and 3.5% in 2018, global
trade volume shrank by 0.4% in 2019 – despite still solid global GDP growth of 2.7% recorded in that
year. 2 The decoupling of trade dynamics from growth in 2019 was due primarily to increased
protectionism, above all the trade conflict between the US and China. Not only did higher import tariffs

1
     This rebound was in sharp contrast to the performance of global trade in services, which recovered only moderately,
     with tourism flows affected particularly strongly.
2
     World Bank, Global Economic Prospects, January 2021.
8 CHART OF THE MONTH
Monthly Report 2021/03
on both sides have an immediate dampening effect on trade flows, but they also increased uncertainty
about future trade policy, which affected investments and the demand for heavily traded investment
goods. The COVID-19 pandemic has further added to this decoupling: according to World Bank
estimates, 3 global GDP dropped by only 4.3% in 2020 – less than the global trade volume. Besides, it
may have a further dampening effect on trade in years to come, on account of the likely de-globalisation
and ‘near-shoring’ of global value chains.
3
Ibid.OPINION CORNER 9
Monthly Report 2021/03
Opinion Corner*:
How to explain the deteriorating trend in
Turkey’s economic performance? 1
BY SERKAN ÇIÇEK
After an economic boom throughout the 2000s, Turkish growth has slowed markedly over the past
decade, in tandem with a sharp currency depreciation. We argue that the main reasons for this are: an
overly high dependence on imports, the high level of foreign exchange indebtedness in the non-financial
sector and increased authoritarianism. An improvement in economic performance would require a more
active industrial policy, measures to be taken against currency mismatches and the creation of a safe
investment environment.
THE LAST TWO DECADES: FROM SHINY TO DULL
At the beginning of 2001, Turkey experienced a severe economic crisis – largely a result of political
instability and inflationary expansionary policies in the 1980s and 1990s. However, immediately following
the crisis, a number of structural reforms were introduced: the adoption of an inflation targeting strategy;
restructuring of the banking and financial sectors; the implementation of fiscal rules; and a new set of
laws to increase transparency and competition. Thanks to these reforms and the accession to power in
2002 of Erdoğan’s single-party government (following unsuccessful coalitions), Turkey made a
significant leap forward during the 2000s. The investment environment improved dramatically, and the
production structure of the private sector changed significantly. The shares of the automotive,
petrochemical and electronics industries within Turkey’s exports increased, to surpass the share of
traditional sectors, such as food and beverages, tobacco and textiles. 2
Moreover, during this period the government made substantial investments in infrastructure, taking
advantage of the availability of international liquidity and the adoption of self-financing strategies.
Intercity motorways were constructed, the existing road networks were updated and new projects both
large and small got under way across Turkey – such as the Marmaray underground railway, the Eurasia
Tunnel, the third İstanbul Bridge, the North Marmara Motorway, the Gebze-İzmir Motorway, the
Osmangazi Bridge, İstanbul Airport, city underground railway lines and city bus lanes. Several other
megaprojects are also currently either under construction or nearing completion, including the İstanbul
Canal, TOGG Turkish national car and high-speed railways. These huge projects are expected to
contribute significantly to economic growth, especially in the medium and long term. With massive
capital inflows leading to high expenditure on consumption, economic growth accelerated and remained
* Disclaimer: The views expressed in the Opinion Corner section of the Monthly Report are exclusively those of the
authors and do not necessarily represent the official view of wiiw.
1
An earlier and shorter version of this text (in Russian) was published in Ekspert magazine, No. 39 (1177),
https://expert.ru/expert/2020/39/turtsiya-posle-2000-goda-poblekshij-uspeh/
2
Atiyas, İ. and Bakis, O. (2015), ‘Structural change and industrial policy in Turkey’, Emerging Markets Finance and
Trade, 51(6), 1209-1229.10 OPINION CORNER
Monthly Report 2021/03
at quite a high level for almost 10 years. During this period, Turkey joined the upper-middle-income
group of countries.
However, in the aftermath of the global financial crisis, the monetary easing policies pursued by the
developed countries have done considerable harm to the financial markets of Turkey – as they have
done to other emerging markets, even though they contributed to economic growth in the short term.
The current account deficit has widened, credit growth has gained steam and debt accumulation has
accelerated. During this period, the Central Bank of the Republic of Turkey (CBRT) has undertaken a
series of new policy initiatives to limit capital inflows, including the adoption of an unconventional interest
rate corridor in late 2010. Following these developments and the announcement of the US Fed’s
tapering programme in mid-2013, the outflow of capital and the increased demand for foreign currency
among residents resulted in depreciation of the Turkish lira (TRY). Ever since then, the currency’s trend
has generally been downward: in January 2013, one US dollar would buy TRY 1.76; by January 2021,
the rate was TRY 7.41 to the US dollar. The currency depreciation has made intermediate imports more
expensive and has inflated the debt of the non-financial private sector, a large part of which is
denominated in foreign currency. As a result, Turkey’s economic growth has slowed markedly.
Economic dynamism and political stability have given way to political uncertainty, economic slowdown
and mounting security concerns. The slowdown in growth, coupled with the currency depreciation, has
contributed to a turnaround in income dynamics in Turkey: between 2002 and 2013, GDP per capita
increased from USD 3,660 to USD 12,519; since then, however, it has been declining, reaching USD
9,042 in 2019.
HIGH IMPORT DEPENDENCE AND INCREASED AUTHORITARIANISM
The reasons for the slowdown can be grouped into two basic categories: an inability to reduce foreign
dependence in production and an increase in authoritarianism in politics. Both factors have contributed
decisively to the depreciation of the Turkish lira and have undermined economic growth.
As mentioned above, the production structure of Turkey’s private sector has changed significantly. For
example, since 2006 the automotive industry has become the leading sector in exports, with a 15.9%
share of manufacturing exports by 2019. Although Turkey has significantly shifted the structure of
production from traditional sectors to modern sectors that are more productive, it has failed to reduce its
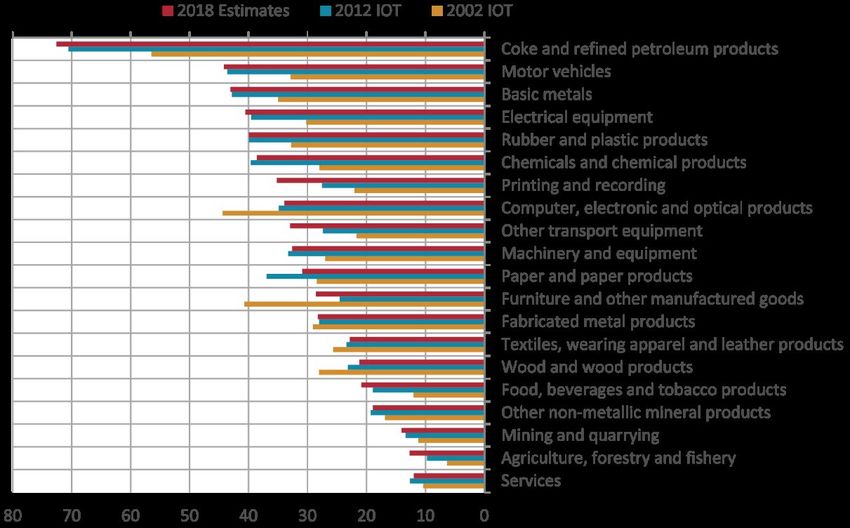
dependence on foreign raw materials and intermediate goods. As Figure 1 shows, the import
requirement ratios (IRRs) have risen since 2002 and are particularly high in the coke and refined
petroleum products sector (over 70%), and in motor vehicles and basic metals (over 40%); all these are
characterised by high capital intensity and use of advanced technology. 3 Moreover, the foreign currency
liabilities of firms in the non-financial sector (especially their short-term ones) have increased
significantly (Figure 2). Thus, the level of the exchange rate has become more crucial in industrial
production and foreign trade.
3
Erduman, Y., Eren, O. and Gül, S. (2020), ‘Import content of Turkish production and exports: A sectoral
analysis’, Central Bank Review, 20(4), 155-168. The authors also indicate that the reason behind the increase in imports
of intermediate goods in the industrial sector is the entry of large multinational and foreign-owned firms and their
contribution to the strengthening of trade ties with global suppliers.OPINION CORNER 11
Monthly Report 2021/03
Figure 1 / Import requirement ratios, by sector, %
Note: IOT – input-output tables.
Source: Erduman, Y., Eren, O. and Gül, S. (2020), ‘Import content of Turkish production and exports: A sectoral
analysis’, Central Bank Review, 20(4), 161.
Figure 2 / Outstanding short- and long-term loans received from abroad by non-financial
sector, in USD bn
long-term loans (LHS) short-term loans (RHS)
120 5.0
4.5
100 4.0
80 3.5
3.0
60 2.5
2.0
40 1.5
20 1.0
0.5
0 0.0
2010-01
2010-04
2010-07
2010-10
2011-01
2011-04
2011-07
2011-10
2012-01
2012-04
2012-07
2012-10
2013-01
2013-04
2013-07
2013-10
2014-01
2014-04
2014-07
2014-10
2015-01
2015-04
2015-07
2015-10
2016-01
2016-04
2016-07
2016-10
2017-01
2017-04
2017-07
2017-10
2018-01
2018-04
2018-07
2018-10
2019-01
2019-04
2019-07
2019-10
2020-01
2020-04
2020-07
2020-10
Source: Electronic Data Dissemination System (EVDS) of the CBRT.
Alongside mounting current account deficits, another critical factor that has contributed to lira depreciation
has been a tendency toward authoritarianism, especially following the failed coup attempt against
President Erdoğan in 2016. Besides, there has also been an increase in the pressure exerted by politics on
the economic decision-making mechanisms. For example, under government pressure, the central bank
lowered interest rates aggressively, leading to negative real interest rates (Figure 3). Hence, the exchange
rates depreciated sharply and the CBRT had to raise the policy rate to curb this depreciation.12 OPINION CORNER
Monthly Report 2021/03
Figure 3 / Policy rate, real interest rates and exchange rate
real interest rate (with respect to actual inflation rate), in % real interest rate (with respect to expected inflation rate), in %
policy rate (one-week repo rate), in % exchange rate USD/TRY (RHS)
30 9
25 8
7
20
6
15
5
10
4
5
3
0
2
-5 1
-10 0
2011-01
2011-04
2011-07
2011-10
2012-01
2012-04
2012-07
2012-10
2013-01
2013-04
2013-07
2013-10
2014-01
2014-04
2014-07
2014-10
2015-01
2015-04
2015-07
2015-10
2016-01
2016-04
2016-07
2016-10
2017-01
2017-04
2017-07
2017-10
2018-01
2018-04
2018-07
2018-10
2019-01
2019-04
2019-07
2019-10
2020-01
2020-04
2020-07
2020-10
2021-01
Source: Electronic Data Dissemination System (EVDS) of the CBRT.
Apart from negative interest rates and authoritarian pressures in domestic politics, the conflicts
surrounding foreign policy have also affected the course of the exchange rate. The fall in the value of the
lira has accelerated dramatically since 2018, due to the increased tensions in Turkey’s relations with the
USA, following the detention of a US pastor and the government’s decision to purchase anti-missile
systems from Russia. 4 Pastor Andrew Brunson was arrested in Turkey in October 2016, during the
purges following the coup attempt in July 2016. In September 2017, Erdoğan proposed exchanging
Brunson for Fethullah Gülen (the alleged mastermind behind the failed coup, who resides in the US), but
nothing came of this. In July 2018, the US vice president called on Erdoğan to release Brunson or face
significant sanctions. Since Turkey refused to release the pastor, in August 2018 the US Department of
the Treasury imposed sanctions on two top Turkish government officials who had been involved in
Brunson’s detention: Turkish Justice Minister Abdulhamit Gül and Interior Minister Süleyman Soylu. After
a few weeks of sanctions, Turkey had to release the pastor in order to halt the rise in the exchange rate.
So, what are the most important lessons to be learned from the Turkish experience? First, it should be
recognised that massive government-led infrastructure investments are necessary for long-term
economic growth – but are not sufficient on their own. As well as such investments, the country’s
industrial policy needs to be shaped in such a way as to reduce foreign dependence. Sectors with high
import requirements should be given priority in determining incentives to increase the use of local inputs
in production. Rather than pursuing a strategy that prescribes the same measures for all sectors, a
strategy should be adopted with sector-specific features. To reduce the non-financial private sector’s
sensitivity to exchange rate movements, currency mismatches should be eliminated and limits placed on
foreign exchange borrowing. But most importantly, a secure investment environment should be created,
in order to mitigate investment risk. To this end, the government should take decisive steps to reduce
the authoritarian nature of the regime – a move that, it would appear, is unlikely. Otherwise, investors’
gains – often made at high cost – may melt away in short order.
4
It should be noted that, despite US government’s threats, no sanctions were applied against Turkey after the anti-missile
systems were purchased.IS HIGHER COVID-19 MORTALITY HURTING ECONOMIC GROWTH? 13
Monthly Report 2021/03
Is higher COVID-19 mortality hurting economic
growth?
BY BRANIMIR JOVANOVIC
Countries that have had a higher death toll during the COVID-19 pandemic have experienced a steeper
decline in GDP, even after accounting for other factors, such as the stringency of the restrictions
imposed. This implies that a no-lockdown policy is also costly for the economy, because of the higher
mortality it causes, and that until the pandemic is brought under control, economic activity is likely to
remain anaemic.
INTRODUCTION
When COVID-19 struck, Sweden acted differently from all the other European countries. As they
introduced lockdowns in an effort to contain the spread of the virus, it decided to avoid restrictions. The
bottom line? Its COVID-19 figures are several times higher than those of its Nordic peers; yet its
economy has fared no better (Figure 1). Has the positive effect of the no-lockdown policy been offset by
the negative effect of high mortality?
Figure 1 / COVID-19 mortality and GDP growth in the Nordic countries in Q2 2020
COVID-19 deaths in Q2, per million population GDP decline in Q2 (%, y-o-y)
483 Iceland Denmark Sweden Finland Norway
-3.8
-6.3
-7.1
87
56 -8
39
23
Sweden Denmark Finland Norway Iceland -10.9
Source: COVID-19 deaths are from Oxford COVID-19 Government Response Tracker (Hale et al., 2020); GDP decline is
from Eurostat.
Later in the pandemic, the number of European countries that followed the Swedish approach increased
considerably. Many European countries that are outside the EU adopted such a laissez-faire strategy,
justifying it by the dire economic cost of restrictions. That led them to be among the worst in Europe in
terms of COVID-19 cases and deaths. So did the high COVID-19 numbers also affect their economies?14 IS HIGHER COVID-19 MORTALITY HURTING ECONOMIC GROWTH?
Monthly Report 2021/03
This article discusses the relationship between COVID-19 health outcomes and economic performance.
It compares the year-on-year (y-o-y) growth rates of GDP in 40 European economies during the second
and third quarters of 2020 with the number of COVID-19 deaths during the same periods.
OF GROWTH AND DEATHS
The biggest economic contraction in Europe in the second quarter of 2020 was recorded by the UK,
whose GDP declined by 21.7% year on year. During the same period, the UK had the second-worst
death toll in the whole of Europe (after Belgium), with 571 deaths per million population. The next worst-
hit European economies in the second quarter were Spain, France and Italy. They were all at the top of
the list of European countries in terms of COVID-19 deaths.
The relationship between GDP growth rates and the number of COVID-19 deaths in 40 European
countries during the second and third quarters of 2020 is shown in the scatterplots of Figure 2. There is
a clearly negative correlation between the two variables – higher numbers of COVID-19 deaths are
associated with a bigger decline in GDP. The correlation is present in both the second and the third
quarters of 2020.
Figure 2 / Relationship between GDP growth and COVID-19 mortality in 40 European
countries
Q2 2020 Q3 2020
0 10
5
-4
GDP GROWTH IN Q2, Y-O-Y (%)
GDP GROWTH IN Q3, Y-O-Y (%)
0
-8
-5
-12 -10
-15
-16
-20
-20
-25
-24 -30
0 100 200 300 400 500 600 700 800 -40 0 40 80 120 160 200 240 280 320
DEATHS IN Q2 (PER 1 MILLION PEOPLE) DEATHS IN Q3 (PER 1 MILLION PEOPLE)
Source: COVID-19 death cases are from Oxford COVID-19 Government Response Tracker (Hale et al. 2020). GDP growth
is from Eurostat and wiiw Monthly Database.
When we regress the GDP growth from the second and third quarters of 2020 on the number of COVID-
19 deaths (per population) for the 40 European countries, we get the results shown in Table 1, column
(1). The coefficient of the number of COVID-19 deaths is -0.017, and is highly significant statistically (at
1%). This coefficient implies that when COVID-19 mortality is 100 cases per million population higher,
GDP growth is 1.7 percentage points lower, on average.IS HIGHER COVID-19 MORTALITY HURTING ECONOMIC GROWTH? 15
Monthly Report 2021/03
Of course, this relationship does not necessarily imply that mortality retards growth, as there might be
many factors that are related to both of the outcomes – for example, the state of the healthcare system
or the quality of institutions and governance. For instance, poorer governance might, at the same time,
lead to worse health outcomes during the pandemic and lower economic growth. To account for these
unobserved factors related to a country’s characteristics, column (2) of Table 1 presents the results of a
regression that also includes country fixed effects, which capture unobserved country heterogeneity. The
results remain roughly unchanged – the coefficient of COVID-19 mortality is again significant and
negative, even increasing slightly (in absolute terms) to -0.021.
Finally, there might be other observable factors that are affecting both GDP growth and health outcomes
during the pandemic, such as the government-imposed restrictions on movement, or the fiscal support
provided by a government. If these factors are unaccounted for, one might spuriously conclude that
there is a relationship between GDP growth and mortality, whereas in fact it is these omitted factors that
are driving both variables. To account for this, column (3) of Table 1 presents the results when a variable
measuring the stringency of the government-imposed restrictions is added in the regression, as well as
the government budget deficit. Both these variables turn out to be significant for GDP growth. The
coefficient of COVID-19 mortality declines somewhat (in absolute terms), to -0.012; but it remains highly
significant, implying that a higher death toll during the pandemic is indeed associated with greater GDP
decline – even after accounting for other factors.
Table 1 / Results of regressions between GDP growth and COVID-19 mortality in 40
European economies in Q2 2020 and Q3 2020
(1) (2) (3)
GDP growth y-o-y GDP growth y-o-y GDP growth y-o-y
Deaths per million people -0.017*** -0.021*** -0.012***
(0.000) (0.000) (0.000)
Stringency Index -0.217***
(0.000)
Government budget deficit 0.229**
(0.016)
Constant -5.640*** -5.311*** 8.005***
(0.000) (0.000) (0.000)
Country fixed effects No Yes Yes
No. observations 79 79 78
Adjusted R squared 0.18 0.28 0.80
Notes: *** represents significance at 1%; ** significance at 5%; the Stringency Index is the COVID-19 Government
Response Stringency Index from the Oxford COVID-19 Government Response Tracker; COVID-19 deaths are also from the
Oxford COVID-19 Government Response Tracker; government budget deficit is expressed as a percentage of GDP and is
from Eurostat and wiiw Monthly Database; GDP growth is from Eurostat and wiiw Monthly Database.
WHY WOULD THIS HAPPEN, AND HOW BIG IS THE EFFECT?
Why would worse health outcomes be associated with bigger GDP contraction? One reason is voluntary
social distancing. When people see and hear about high numbers of COVID-19 cases and deaths every
day, they voluntarily decide to restrict their own mobility, staying at home and postponing spending for
better times – all of which drags down economic activity. This effect was discussed by the International
Monetary Fund (IMF) in its October 2020 World Economic Outlook (IMF, 2020). Another potential16 IS HIGHER COVID-19 MORTALITY HURTING ECONOMIC GROWTH?
Monthly Report 2021/03
channel is through increased uncertainty: doubt about future economic developments, about the
duration of the pandemic and about the course of the recovery reduces business investment, as
companies do not like uncertainty. This channel was discussed in the European Central Bank (ECB)
Economic Bulletin from June 2000 (Gieseck and Rujin, 2020). Finally, worse health outcomes may
undermine confidence among both consumers and businesses, causing them to refrain from
consumption and investment spending, and thus further slowing economic activity. These effects were
elaborated by the Organisation for Economic Co-operation and Development (OECD) in its Interim
Report from September 2020 (OECD, 2020).
So how big is the estimated effect of COVID-19 mortality on economic growth? The size of the
coefficient of COVID-19 deaths from the last regression (-0.012) implies that if a country had 100 more
deaths per million population in a quarter, its GDP in that quarter would decline by an additional 1.2
percentage points, on average, holding everything else constant.
To illustrate the size of the effect, let us return to Sweden. In the second quarter of 2020, it had COVID-
19 mortality of 483 per million population. The results of the regression imply that, had its mortality been
equal to the average of the other four Nordic countries (51 per million), its GDP decline in the second
quarter would have been 5.2 percentage points smaller (432*0.012) – i.e. only 1.9% (rather than 7.1%).
Or, if one takes the UK as an example, if its mortality in Q2 (571 per million) had been the same as
Germany’s (97 per million), its GDP contraction would have been 5.7 percentage points smaller – i.e.
16% (rather than 21.7%).
WHAT ARE THE POLICY IMPLICATIONS OF THESE FINDINGS?
The finding that worse health outcomes during the COVID-19 pandemic are associated with worse
economic performance has at least two very important implications for policy makers.
The first concerns the use of lockdown as an instrument to contain the spread of the disease.
Lockdowns have often been criticised for being too costly for the economy, especially in economically
less-advanced countries. On these grounds, they were almost completely discarded during the winter
wave of the pandemic by some European countries, such as the Western Balkan or the CIS countries.
Lockdowns are indeed costly for the economy, and our analysis confirms that (see the significant and
negative coefficient on the Stringency Index in the above regression). But not having a lockdown is also
costly, as that leads to the unrestrained spread of the pandemic and a high number of COVID-19 cases
and deaths, which in turn hinders economic activity. Thus, instead of rejecting lockdowns outright as too
costly, governments – even in economically poorer countries – should introduce targeted, selective and
well-designed restrictions that can contain the spread of the virus, without inflicting too severe economic
damage. They should carefully weigh up the pros and cons of different restrictive measures on various
activities, and should restrict the riskiest activities, leaving the least risky activities in place.
The second implication refers to expectations for economic recovery. Removing restrictions will
not make economies recover by default. Full recovery can be expected only once the pandemic has
been fully contained. Until such time as COVID-19 cases and deaths are reduced to very low levels,
economic activity will remain anaemic, as people and businesses will still refrain from spending. This isIS HIGHER COVID-19 MORTALITY HURTING ECONOMIC GROWTH? 17
Monthly Report 2021/03
an additional argument for why countries must do their best to organise an efficient and effective
vaccination process: without it, economic activity is likely to remain weak.
CONCLUSION
This article has investigated the relationship between COVID-19 mortality and economic growth in 40
European countries, during the second and third quarters of 2020. It has found that there is a clearly
negative relationship between them – higher COVID-19 death figures are associated with a stronger
economic contraction. This can be explained by the voluntary social distancing, greater uncertainty and
undermined confidence that the high COVID-19 death toll brings. The effect is considerable, and implies
that governments should not reject lockdowns on the grounds that they are costly for the economy, as it
is also costly to have no lockdowns; instead, they should adopt well-targeted and selective restrictions.
Finally, one should not expect economies to get back onto the growth track until the pandemic is fully
under control; this will take several months (at least), and can only be achieved through efficient and
effective vaccination.
REFERENCES
Gieseck, Arne and Svetlana Rujin (2020), The impact of the recent spike in uncertainty on economic activity in
the euro area, ECB Economic Bulletin, 6/2020. Available at: https://www.ecb.europa.eu/pub/economic-
bulletin/focus/2020/html/ecb.ebbox202006_04~e36366efeb.en.html
Hale, Thomas, Sam Webster, Anna Petherick, Toby Phillips and Beatriz Kira (2020), Oxford COVID-19
Government Response Tracker, Blavatnik School of Government. Available at:
https://covidtracker.bsg.ox.ac.uk/
International Monetary Fund (IMF) (2020), The Great Lockdown: Dissecting the economic effects. In: IMF,
World Economic Outlook (October), Chapter 2. Available at:
https://www.imf.org/en/Publications/WEO/Issues/2020/09/30/world-economic-outlook-october-2020
Organisation for Economic Co-operation and Development (OECD) (2020). Building confidence amid an
uncertain recovery: OECD Economic Outlook, Interim Report, September 2020. Available at:
http://www.oecd.org/economic-outlook/september-2020/18 WHAT DO WE KNOW ABOUT THE PHARMACEUTICAL COMPANIES PRODUCING VACCINE FOR COVID-19?
Monthly Report 2021/03
What do we know about the pharmaceutical
companies producing vaccine for COVID-19?
BY MAHDI GHODSI
The COVID-19 pandemic has claimed many lives and has upset people’s existence, social norms and
international economic patterns. However, coordinated efforts by governments, international
organisations such as the World Health Organization (WHO) and pharmaceutical companies are starting
to yield results. This article describes some features of the major producers of COVID-19 vaccines and
of the pharmaceutical sector generally. Some of the firms own swathes of patents, possess large
quantities of fixed intangible assets and have very high labour productivity, suggesting that they are very
innovative.
INTRODUCTION
The COVID-19 pandemic has claimed more than 2.5 million lives so far, and the number of new
infections is on the rise. The only glimmer of hope is the vaccines produced by the frontrunners of
pharmaceutical technology. Currently, 70 candidate vaccines are undergoing clinical evaluation; 1 these
are produced using various technologies, and include inactivated virus vaccines, non-replicating viral
vector vaccines, protein subunit vaccines, DNA-based vaccines and RNA-based vaccines. This last is
the messenger ribonucleic acid (mRNA) technology 2 discovered in the early 1970s, which has recently
been developed by high-tech pharmaceutical companies to produce vaccines against SARS-CoV
diseases (Schlake et al., 2012; Jackson et al., 2020).
However, to date only 15 candidate vaccines have completed the third phase of trials. It is thus
important to understand why those companies that have completed that phase have been more
successful than the others. A crucial factor behind their success is their financial capacity and economic
health: this allows for greater spending on research and development (R&D) and more innovative
activities. The European Commission has approved contracts with several of these companies, pre-
ordering billions of doses of vaccines for EU member states. If there is oversupply at any point, the
vaccines could be donated to lower- and middle-income countries.
WHAT ARE THE MAIN PHARMACEUTICAL SECTORS?
The major companies producing vaccines to combat COVID-19 are active in two main sectors. One is
the manufacture of pharmaceutical preparations (NACE 2120), and the other is a service sector,
focusing on research and the experimental development on biotechnology (NACE 7211). Worldwide, the
former is much larger than the latter. The global pharmaceuticals manufacturing sector consists of about
1
https://www.who.int/publications/m/item/draft-landscape-of-covid-19-candidate-vaccines
2
https://www.statnews.com/2020/11/10/the-story-of-mrna-how-a-once-dismissed-idea-became-a-leading-technology-in-
the-covid-vaccine-race/WHAT DO WE KNOW ABOUT THE PHARMACEUTICAL COMPANIES PRODUCING VACCINE FOR COVID-19? 19
Monthly Report 2021/03
20,000 active firms, with total turnover in 2019 standing at about USD 2 trillion. The global service sector
in research and experimental development on biotechnology consists of about 32,000 firms, but its total
turnover is only USD 150 billion.
In terms of total turnover, the manufacturing sector has higher labour productivity than the service
sector. As Figure 1 shows, aggregate labour productivity in 2019 was USD 0.43 million per employee in
the manufacturing sector, but only USD 0.23 million in the service sector. The superior productivity of the
manufacturing sector can partly be explained by its larger capital intensity, its greater intensity of fixed
intangible assets and its greater use of intermediate inputs (which means that in terms of value-added
per employee, productivity would be lower). As Figure 1 shows, the global manufacturing sector has
USD 0.83 million capital for each employee, while in the service sector capital intensity is only USD 0.38
million. Furthermore, the ratio of fixed intangible assets relative to total assets in the manufacturing
sector stands at over 40%, while for the service sector it is below 30%. Intangible assets usually reflect
the value of a firm’s intellectual property, which consists of the firm’s trademarks, brand, goodwill, its
managerial skills and – most importantly – its patenting and innovation activities.
Figure 1 / Selected economic indicators of the two global major pharmaceutical sectors, 2019
Manufacture of pharmaceutical preparations (NACE 2120)
Research and experimental development of biotechnology (NACE 7211)
0.9
0.8
0.7
0.6
0.5
0.4
0.3
0.2
0.1
0.0
Fixed intangible to total assets Labour productivity in million USD Capital to labour ratio in million USD
Source: Orbis, author’s elaboration.
The top 20 countries that host the largest number of firms where productivity is higher than the global
average in each sector are presented in the two panels of Table 1. The geographical distribution of
these highly productive firms resembles the origin of many producers of COVID-19 vaccine, according to
the list provided by the WHO. Developing countries do not show up in the list of highly productive service
firms, while they host many very productive manufacturing pharmaceutical firms. It is thus evident that,
while the manufacture of pharmaceuticals can be located across many countries, the same is not true of
R&D in biotechnology. Capital-intensive manufacturing can be performed using high-tech and advanced
machinery produced by the advanced economies, but transported to and installed in developing
countries. However, knowledge-intensive services are not yet as mobile as manufacturing industries,
since skilled labour cannot be voluntarily and easily located elsewhere. However, it is worth mentioning
that the COVID-19 pandemic has facilitated remote working in a new technological shock; this could
assist in the mobility of skilled labour across countries for these knowledge-intensive services.20 WHAT DO WE KNOW ABOUT THE PHARMACEUTICAL COMPANIES PRODUCING VACCINE FOR COVID-19?
Monthly Report 2021/03
Table 1 / Top 20 countries hosting the largest number of pharmaceutical firms with above-
average productivity, averaged over the period 2017-2019
Research and experimental development on biotechnology
Manufacture of pharmaceutical preparations (NACE 2120)
(NACE 7211)
Average productivity Average productivity
Country Number of active firms Country Number of active firms
of all firms, USD of all firms, USD
United States 8,760 405,901 United States 26,030 200,935
Brazil 1,214 815,349 Canada 2,292 146,878
China 5,998 2,464,522 Japan 468 321,333
Italy 435 578,519 Italy 698 150,521
Germany 203 883,467 United Kingdom 301 372,724
United Kingdom 120 540,641 France 381 305,795
Cayman Islands 52 3,749,661 Sweden 415 140,075
Vietnam 435 183,769 Spain 348 107,131
France 241 1,101,912 Hungary 311 124,584
Netherlands 38 7,143,549 Germany 90 556,223
Belgium 65 910,968 Norway 151 198,259
Ireland 33 2,335,851 Belgium 34 2,196,322
Russia 806 96,857 Poland 248 118,774
Spain 227 325,710 Finland 92 130,826
Canada 563 202,532 Vietnam 440 24,630
South Korea 689 336,663 Denmark 36 316,661
Austria 47 1,167,596 Russia 178 61,973
Sweden 146 241,678 Netherlands 14 536,163
Bermuda 11 1,114,419 Portugal 100 61,549
Japan 152 363,331 Iceland 19 213,061
Notes: Countries are ranked by the number of pharmaceutical firms with above-average productivity. However, the data in
the table refer to all firms in the country in the respective sector. Average productivity is a simple average of firm-level
productivity, defined as turnover per employee.
Source: Orbis and author’s elaboration.
WHO ARE THE COVID-19 VACCINE FRONTRUNNERS?
We found the financial statements of the producers of COVID-19 vaccines in the Orbis database,
provided by the Bureau van Dijk, a Moody’s Analytics company. Almost all the companies operate in the
two main sectors of activity discussed above. Figure 2 shows the main features of the most innovative
producers of vaccines, who also have very large global market shares in their sectors of activity. As is
observed on the left-hand axis of this figure, these companies own a large proportion of the patents
granted within the two global sectors. Patents – usually considered to be the ultimate outcome of the
R&D and innovative activities of firms – are granted by regional patent offices to protect the intellectual
property rights of the innovators, provided the innovation is proved to be original. The French Sanofi, the
American Pfizer Inc. and the British GlaxoSmithKline plc own the largest number of patents granted in
their sectors of activity. Moreover, these companies supply more than 2% of the global sector, averaged
over the period 2017-2019. As is shown on the right-hand axis of Figure 2, the labour productivity of
many of these major companies is substantially higher than average productivity in the sector, discussed
above. Furthermore, many of them have a very large share of fixed intangible assets in their total assets,
as shown on the right-hand axis. This additionally indicates that the value of knowledge, trademarks,
managerial skills and intellectual property rights in these companies comprises a large proportion of their
total assets.WHAT DO WE KNOW ABOUT THE PHARMACEUTICAL COMPANIES PRODUCING VACCINE FOR COVID-19? 21
Monthly Report 2021/03
Figure 2 / Some features of the most innovative producers of COVID-19 vaccines, averaged
over period 2017-2019
Share in global sectoral granted patents - lhs Global market share - lhs
Labour productivity in million USD - rhs Fixed intangible to total assets - rhs
9% 0.70
8% 0.60
7%
0.50
6%
5% 0.40
4% 0.30
3%
0.20
2%
1% 0.10
0% 0.00
Source: Orbis, author’s elaboration.
THE LEADING MRNA CONSORTIUM: PFIZER-BIONTECH-FOSUN
On 9 November 2020, an important new vaccine, produced by a consortium of BioNTech SE, Shanghai
Fosun Pharmaceutical Co. Ltd and Pfizer Inc., was announced to have proved effective on more than
90% of patients in the third phase of trials. 3 In this consortium, Pfizer is the clear leader, enjoying the
largest global market share (3%) in the manufacture of pharmaceutical preparations (NACE 2120) in
2018. Shanghai Fosun Pharmaceutical enjoys a 0.2% global market share in the manufacture of
pharmaceutical preparations, with a turnover of around USD 4.1 billion, while BioNTech can claim a
0.11% of market share in research and experimental development on biotechnology (NACE 7211), with
a turnover of USD 125 million.
In fact, Pfizer Inc.’s scale of activities can be demonstrated by the following figures. Its total operating
revenue in 2018 stood at USD 53.7 billion – the equivalent of around 12% of Austrian GDP in that year.
In 2021, it forecasts USD 15 billion in COVID-19 vaccine sales. 4 It is a large, multinational enterprise
based in New York and holds a major share in 698 subsidiaries across the globe that are active in
various sectors. This extensive network of ownership indicates Pfizer Inc.’s enormous capacity to utilise
resources through its global supply chains across many countries. These resources are not only limited
to intermediate inputs or financial instruments, but also extend to technology and know-how owned by
this large conglomerate through its subsidiaries in patent boxes. Studies in the literature – such as
Alstadsæter et al. (2018) and Bösenberg and Egger (2017) – argue that such large multinational
enterprises pursue their R&D activities in countries where the costs of, and taxes on, R&D activities are
lowest, in order to maximise the benefits from patent registrations. Pfizer Inc. has filed 242,000 patent
3
https://www.businesswire.com/news/home/20201109005539/en/
4
https://www.bloomberg.com/news/articles/2021-02-02/pfizer-forecasts-15-billion-in-covid-vaccine-sales-for-202122 WHAT DO WE KNOW ABOUT THE PHARMACEUTICAL COMPANIES PRODUCING VACCINE FOR COVID-19?
Monthly Report 2021/03
applications, of which 51% have been granted by patent offices. That is about 6% of all granted patents
owned by global firms active in the same sector (i.e. NACE 2120). Pfizer Inc.’s ratio of fixed intangible
assets to total assets has averaged 53% over the past 10 years, which is much larger than the average
figure for the industry generally (33%). Pfizer Inc.’s acquisition of more intangible assets in the period
2014-2016 has contributed to an improvement in its labour productivity, which currently stands at around
USD 0.6 million per employee. This is much higher than the average level of labour productivity in the
sector (USD 0.46 million).
THE SECOND MRNA CONSORTIUM: MODERNA-NIAID
On 16 November 2020, a second vaccine against COVID-19 was announced. It is produced by the joint
venture of Moderna Inc. and the National Institute of Allergy and Infectious Diseases (NIAID). While the
latter is a public entity, the former is a company established in 2016 that is active in research and
experimental development on biotechnology (NACE 7211). Unlike Pfizer, Moderna is a rather small
company: in 2018, its operating turnover was USD 135 million – just 0.14% of the total turnover
generated in the global sector and only slightly larger than that of BioNTech SE. However, it forecasts
USD 18 billion in sales of COVID-19 vaccines this year. 5 Despite its extreme youth, Moderna Inc. has
filed 1,406 patent applications, of which 240 have already been granted. That amounts to 0.12% of all
granted patents owned by firms in this sector. Moderna Inc. owns major shares in only four subsidiaries,
which are active in the US.
STOCK MARKET VALUATION OF MAJOR COVID-19 VACCINE PRODUCERS
However, many investment and banking companies (such as the Goldman Sachs Group) and national
funds (such as the Government of Canada) have invested in Moderna Inc. by acquiring shares. It is not
only technological know-how that matters to the growth of such pharmaceutical frontrunners, but also
their managerial skills in acquiring financial resources. Figure 3 indicates how the stock prices of the
youthful Moderna Inc. and BioNTech SE have risen over the past 36 months, in comparison with other
major producers of COVID-19 vaccines. It is evident that since approval of their vaccines, the stock
prices of the young Moderna Inc. and BioNTech SE have soared. (BioNTech SE was established in
2008, much later than many other major producers of COVID-19 vaccine, and its initial public offering
was on 24 September 2019.)
Why have the stock prices of other major pharmaceutical companies not increased as much as those of
Moderna and BioNTech? The reason could be that other companies are very large and old, and produce
many other pharmaceutical goods; thus revenue from the sale of COVID-19 vaccines will be only a small
part of their total turnover. Interestingly, while the stock price of Moderna Inc. increased after approval of
the first vaccine, produced by Pfizer Inc.’s joint venture (which implied that a COVID-19 vaccine was
feasible), the stock price of Pfizer Inc. dropped sharply after approval of the second vaccine, produced
by Moderna Inc. The main reason for this could be the better performance of the second vaccine, which
has a 5% greater efficacy rate than the first one. This may signal the second vaccine’s better quality,
which means it could command a higher price and ensure a larger mark-up for its producer. Another
reason is simply that – unlike Pfizer’s vaccine, which should be stored at a temperature of between -
5
https://www.theguardian.com/business/2021/feb/25/moderna-forecasts-18bn-in-sales-of-covid-vaccine-this-yearWHAT DO WE KNOW ABOUT THE PHARMACEUTICAL COMPANIES PRODUCING VACCINE FOR COVID-19? 23
Monthly Report 2021/03
80ºC and -60ºC 6 – Moderna’s could be stored at between -25°C and -15°C. 7 Besides, as noted above,
total sales of COVID-19 vaccines by Moderna Inc. in 2021 are expected to be USD 3 billion larger than
the expected sales of Pfizer Inc.
Figure 3 / Stock prices of most innovative pharma companies producing vaccines against
COVID-19, in EUR
CSL Limited Moderna Inc. BioNTech SE Pfizer Inc.
AstraZeneca plc Sanofi Merck & Co., Inc.
211
161
111
61
11
Source: Domestic stock market prices from Orbis in local currency; daily currency exchange rates of euro from European
Central Bank; and author’s elaboration.
After the new, much more contagious variants of COVID-19 appeared in England and South Africa
around mid-December 2020, the stock prices of Moderna and BioNTech plunged. Then, after those
vaccines proved themselves effective against the new variants of COVID-19, fresh expectations in the
market allowed the shares of the companies to soar again, returning to their peak at the beginning of
February 2021.
SUMMARY AND CONCLUDING REMARKS
The COVID-19 pandemic has claimed many lives, and has upset people’s existence, social norms and
international economic patterns. So there has been a lengthy global crisis, which will only finally end with
the vaccine. The management of this global crisis has proved challenging. However, coordinated efforts
by governments, international organisations such as the WHO and pharmaceutical companies are
starting to yield results in terms of impeding this global pandemic. Several COVID-19 vaccines are now
being produced, using various technologies, by the frontrunners in the two main pharmaceutical sectors:
manufacture of pharmaceutical preparations and research and experimental development on
biotechnology. Some of these vaccines have successfully completed the third phase of trials and their
6
https://www.pfizer.com/news/press-release/press-release-detail/pfizer-and-biontech-submit-covid-19-vaccine-stability-
data
7
https://www.cdc.gov/vaccines/covid-19/info-by-product/moderna/downloads/storage-summary.pdf24 WHAT DO WE KNOW ABOUT THE PHARMACEUTICAL COMPANIES PRODUCING VACCINE FOR COVID-19?
Monthly Report 2021/03
high efficacy rates have been proved. Mass vaccination is now being undertaken in many countries of
the world.
None of this would have been possible, had the resources necessary for the development of these
vaccines by major innovative firms not been made available in time. Those companies tend to be very
innovative – something that is reflected in the large number of patents that they have been granted over
the years. And that has also contributed to their considerable intangible assets and very high labour
productivity. Many governments have allocated credits and funds to these companies, in return for a
share in ownership or advance purchase contracts for the delivery of vaccine doses. This financial
support for major innovative firms has finally borne fruit. One can only hope that such coordinated efforts
will continue in the future in the search for technologically advanced medicines to combat other fatal
diseases, such as cancer or HIV.
REFERENCES
Alstadsæter, A., Barrios, S., Nicodème, G., Skonieczna, A.M. and Vezzani, A. (2018). Patent boxes design,
patents location, and local R&D, Economic Policy, 33(93), 131-177.
Bösenberg, S. and Egger, P.H. (2017). R&D tax incentives and the emergence and trade of ideas, Economic
Policy, 32(89), 39-80.
Jackson, L.A., et al. (2020). An mRNA vaccine against SARS-CoV-2 – preliminary report, New England
Journal of Medicine, 383, 1920-1931.
Schlake, T., Thess, A., Fotin-Mleczek, M. and Kallen, K.J. (2012), Developing mRNA-vaccine
technologies. RNA Biology, 9(11), 1319-1330.MONTHLY AND QUARTERLY STATISTICS 25
Monthly Report 2021/03
Monthly and quarterly statistics for Central, East
and Southeast Europe
The monthly and quarterly statistics cover 22 countries of the CESEE region. The graphical form of
presenting statistical data is intended to facilitate the analysis of short-term macroeconomic
developments. The set of indicators captures trends in the real and monetary sectors of the economy,
in the labour market, as well as in the financial and external sectors.
Baseline data and a variety of other monthly and quarterly statistics, country-specific definitions of
indicators and methodological information on particular time series are available in the wiiw Monthly
Database under: https://data.wiiw.ac.at/monthly-database.html. Users regularly interested in a certain
set of indicators may create a personalised query which can then be quickly downloaded for updates
each month.
Conventional signs and abbreviations used
% per cent
ER exchange rate
GDP Gross Domestic Product
HICP Harmonised Index of Consumer Prices (for new EU member states)
LFS Labour Force Survey
NPISHs Non-profit institutions serving households
p.a. per annum
PPI Producer Price Index
reg. registered
y-o-y year on year
The following national currencies are used:
ALL Albanian lek HRK Croatian kuna RON Romanian leu
BAM Bosnian convertible mark HUF Hungarian forint RSD Serbian dinar
BGN Bulgarian lev KZT Kazakh tenge RUB Russian rouble
BYN Belarusian rouble MKD Macedonian denar TRY Turkish lira
CZK Czech koruna PLN Polish zloty UAH Ukrainian hryvnia
EUR euro – national currency for Montenegro, Kosovo and for the euro-area countries Estonia
(from January 2011, euro-fixed before), Latvia (from January 2014, euro-fixed before), Lithuania (from
January 2015, euro-fixed before), Slovakia (from January 2009, euro-fixed before) and Slovenia (from
January 2007, euro-fixed before).
Sources of statistical data: Eurostat, National Statistical Offices, Central Banks and Public Employment
Services; wiiw estimates.26 MONTHLY AND QUARTERLY STATISTICS
Monthly Report 2021/03
Online database access
wiiw Annual Database wiiw Monthly Database wiiw FDI Database
The wiiw databases are accessible via a simple web interface, with only one password needed to
access all databases (and all wiiw publications).
You may access the databases here: https://data.wiiw.ac.at.
If you have not yet registered, you can do so here: https://wiiw.ac.at/register.html.
Service package available
We offer an additional service package that allows you to access all databases – a Premium
Membership, at a price of € 2,300 (instead of € 2,000 as for the Basic Membership). Your usual package
will, of course, remain available as well.
For more information on database access for Members and on Membership conditions, please contact
Ms. Barbara Pill (pill@wiiw.ac.at), phone: (+43-1) 533 66 10.MONTHLY AND QUARTERLY STATISTICS 27
Monthly Report 2021/03
Albania
Real GDP growth and contributions Real sector development
y-o-y in %
Household final consumption Left scale:
Gross fixed capital formation Industry, 3-month moving average
annual Employed persons (LFS)
Net exports
% growth Right scale: %
GDP Unemployment rate (LFS)
8 20 12.2
6 15 12.0
4 10 11.8
2 5
0 11.6
0
-2 11.4
-5
-4 11.2
-6 -10
-15 11.0
-8
-10 -20 10.8
-12 -25 10.6
Q1 19 Q2 19 Q3 19 Q4 19 Q1 20 Q2 20 Q3 20 Q4 20 Jan-19 Jul-19 Jan-20 Jul-20 Jan-21
Unit labour costs in industry Inflation and policy rate
in %
annual growth rate in %
Consumer prices (HICP), annual growth
Wages nominal, gross
Producer prices in industry, annual growth
Productivity*
Central bank policy rate (p.a.)
Exchange rate
Unit labour costs 3
30
2
25
1
20
15 0
10 -1
5 -2
0 -3
-5 -4
-10 -5
-15
-6
-20 Jan-19 Jul-19 Jan-20 Jul-20 Jan-21
Q1 19 Q2 19 Q3 19 Q4 19 Q1 20 Q2 20 Q3 20 Q4 20
Financial indicators External sector development
in % in %
Left scale: Left scale:
Loans to non-financial corporations Exports, 3-month moving average**
Loans to households and NPISHs Imports, 3-month moving average**
Right scale: Real ER EUR/ALL, PPI deflated
annual Non-performing loans annual
Right scale:
growth in % of total growth % of GDP
Current account
10 14 20 0
8 12 10 -2
6
10 -4
4 0
2 8 -6
-10
0 6 -8
-2 -20
4 -10
-4
2 -30 -12
-6
-8 0 -40 -14
Jan-19 Jul-19 Jan-20 Jul-20 Jan-21 Jan-19 Jul-19 Jan-20 Jul-20 Jan-21
*Positive values of the productivity component on the graph reflect decline in productivity and vice versa.
**EUR based.
Source: wiiw Monthly Database incorporating Eurostat and national statistics.
Baseline data, country-specific definitions and methodological breaks in time series are available under:
https://data.wiiw.ac.at/monthly-database.html28 MONTHLY AND QUARTERLY STATISTICS
Monthly Report 2021/03
Belarus
Real GDP growth and contributions Real sector development
y-o-y in %
Household final consumption Left scale:
Gross fixed capital formation Industry
annual Employed persons (LFS)
Net exports
% growth Right scale: %
GDP Unemployment rate (LFS)
6 3 4.8
4 2 4.6
1 4.4
2
0 4.2
0
-1 4.0
-2
-2 3.8
-4 -3 3.6
-6 -4 3.4
Q1 19 Q2 19 Q3 19 Q4 19 Q1 20 Q2 20 Q3 20 Q4 20 Jan-19 Jul-19 Jan-20 Jul-20 Jan-21
Unit labour costs in industry Inflation and policy rate
in %
annual growth rate in %
Consumer prices (HICP), annual growth
Wages nominal, gross
Producer prices in industry, annual growth
Productivity*
Central bank policy rate (p.a.)
Exchange rate
Unit labour costs 12
30
20 10
10 8
0
-10 6
-20 4
-30
2
-40
-50 0
Jan-19 Jul-19 Jan-20 Jul-20 Jan-21 Jan-19 Jul-19 Jan-20 Jul-20 Jan-21
Financial indicators External sector development
in % in %
Left scale: Left scale:
Loans to non-financial corporations Exports**
Loans to households Imports**
Right scale: Real ER EUR/BYN, PPI deflated
annual Non-performing loans annual
Right scale:
growth in % of total growth % of GDP
Current account
35 7 30 6
30 6 20 4
10 2
25 5
0
0
20 4 -2
-10
15 3 -4
-20
-6
10 2
-30 -8
5 1 -40 -10
0 0 -50 -12
Jan-19 Jul-19 Jan-20 Jul-20 Jan-21 Jan-19 Jul-19 Jan-20 Jul-20 Jan-21
*Positive values of the productivity component on the graph reflect decline in productivity and vice versa.
**EUR based.
Source: wiiw Monthly Database incorporating Eurostat and national statistics.
Baseline data, country-specific definitions and methodological breaks in time series are available under:
https://data.wiiw.ac.at/monthly-database.htmlMONTHLY AND QUARTERLY STATISTICS 29
Monthly Report 2021/03
Bosnia and Herzegovina
Real GDP growth and contributions Real sector development
y-o-y in %
Household and NPISHs final consumption Left scale:
Industry, 3-month moving average
Gross capital formation
annual Employed persons (reg.)
% Net exports Right scale:
growth %
GDP Unemployment rate (reg.)
6 6 36
4 4
2 2 35
0 0
-2 34
-2
-4
-4 33
-6
-6 -8
-8 32
-10
-10 -12 31
-12 -14
-14 -16 30
Q1 19 Q2 19 Q3 19 Q4 19 Q1 20 Q2 20 Q3 20 Q4 20 Jan-19 Jul-19 Jan-20 Jul-20 Jan-21
Unit labour costs in industry Inflation
annual growth rate in % in %
Wages nominal, gross Consumer prices, annual growth
Producer prices in industry, annual growth
Productivity*
Exchange rate
Unit labour costs
25 2.0
1.5
20
1.0
15 0.5
10 0.0
-0.5
5
-1.0
0 -1.5
-5 -2.0
-10 -2.5
Jan-19 Jul-19 Jan-20 Jul-20 Jan-21 Jan-19 Jul-19 Jan-20 Jul-20 Jan-21
Financial indicators External sector development
in % in %
Left scale: Left scale:
Loans to non-financial corporations Exports, 3-month moving average**
Loans to households Imports, 3-month moving average**
Right scale: Real ER EUR/BAM, PPI deflated
annual Non-performing loans annual
growth growth Right scale:
in % of total % of GDP
Current account
10 9 10 0
8 8 5
-1
6 7 0
6 -5 -2
4
5 -10
2 -3
4 -15
0
3 -20 -4
-2 2 -25
-4 -5
1 -30
-6 0 -35 -6
Jan-19 Jul-19 Jan-20 Jul-20 Jan-21 Jan-19 Jul-19 Jan-20 Jul-20 Jan-21
*Positive values of the productivity component on the graph reflect decline in productivity and vice versa.
**EUR based.
Source: wiiw Monthly Database incorporating Eurostat and national statistics.
Baseline data, country-specific definitions and methodological breaks in time series are available under:
https://data.wiiw.ac.at/monthly-database.htmlYou can also read