Monthly water situation report - North East Area

Page created by Dennis Oconnor
 
CONTINUE READING
Monthly water situation report - North East Area
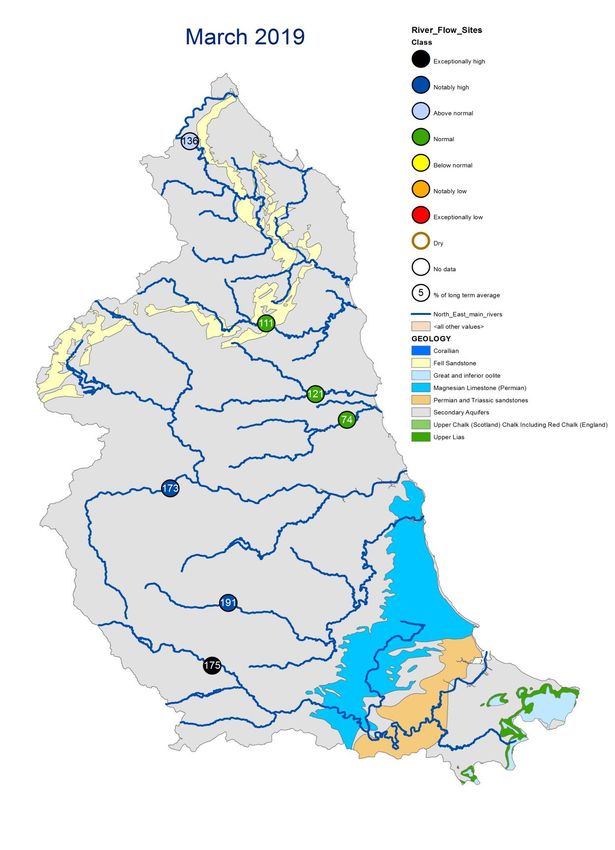
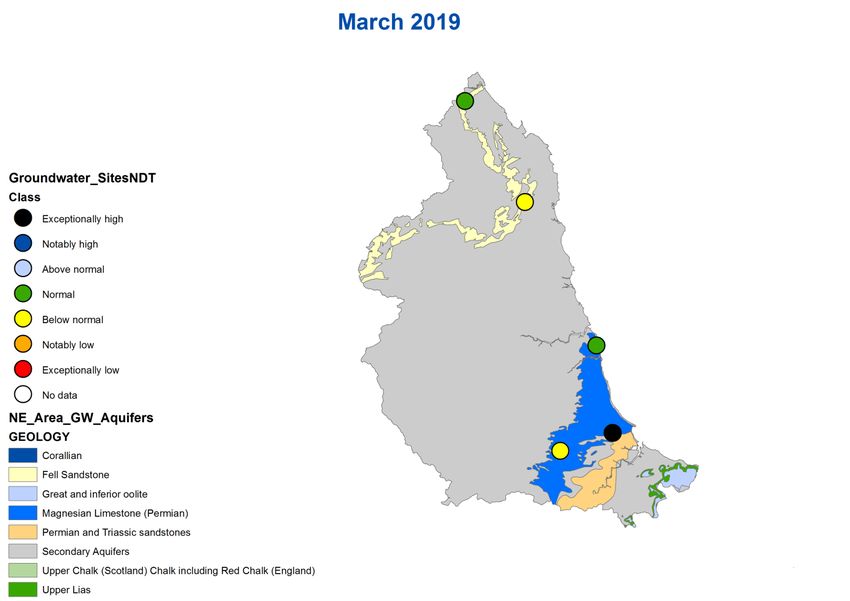
Monthly water situation report
North East Area

Summary – March 2019
March was a particularly wet month with above average monthly rainfall totals across the North East
Area. Monthly mean river flows are now classed as ‘normal’ or higher for the time of year at all indicator
sites. Groundwater levels in the North East area’s aquifers were variable in March, ranging from ‘below
normal’ to ‘exceptionally high’. Soil moisture deficits increased slightly but all catchments are classed as
‘wet’. Reservoir stocks have generally increased this month and the majority are above average for the
time of the year.

Rainfall
March was a wet month with rainfall exceeding the monthly long term average (LTAs) in all
catchments. The monthly rainfall totals for March range from 110% of LTA in the Seaham, Peterlee
Coastal catchment to 170% of LTA in the Tyne catchment. The majority of March’s rainfall fell during
the first half of the month, with two Met Office named storms Freya and Gareth bringing widespread
heavy rainfall across the area. The Seaham, Peterlee Coastal area recorded above average rainfall for
the first time since April 2018.

The cumulative rainfall total for the last 12 months is ‘notably low’ in all catchments with the exception
of the Tweed and Northumbria North Sea tributary catchments which are classed as ‘exceptionally
low’. It is interesting to note that the 12 month rainfall accumulations to March for the Tweed and
Northumbria North Sea tributary catchments are the 3rd and 4th driest since 1910 respectively.

Soil Moisture Deficit
Soil moisture deficits (SMDs) decreased during the first part of March in response to the wet weather
and gradually dried towards the end of March, however soils throughout the North East remain ‘wet'.

River Flows
Monthly mean flows for March increased at all the indicator sites across the area compared to the
previous month. Monthly flows range from 74% of LTA at Hartford Bridge on the River Blyth to 191% of
LTA at Stanhope on the River Wear. Daily mean flows show that all rivers experienced ‘exceptionally
high’ flows during March particularly on the 16th as a response to Storm Gareth.

Groundwater Levels
The unconfined part of the Magnesian Limestone aquifer, represented by the typically responsive
Aycliffe borehole, showed a ‘below normal’ groundwater level for March, despite ‘notably high’ rainfall
in the catchment for the month. The dip reading was taken on March 20th, substantial rainfall in the
catchment on March 15th likely to have passed through this part of the aquifer by the time the reading
was taken. The levels in the semi-confined and confined parts of the Magnesian Limestone,
represented by West Hall Farm and Red Lion respectively, are classed as ‘normal’ and ‘exceptionally
high’ for the time of year. With slower response times in comparison to the unconfined part, these sites
show a general downward trend in groundwater level. With below normal rainfall amounts observed in
the Wear and Tees catchments over the last six months, it appears that heavier rainfall events in early
2018 continue to recharge these parts of the Magnesian Limestone.

Groundwater levels in the Fell Sandstone aquifer have seen a slight increase in the semi-confined part,
represented by Royalty Observation, following a downward trend since the sharp increase in April
2018. The groundwater level status here was ‘normal’ for March. The level in the unconfined part of the
 All data are provisional and may be subject to revision. The views expressed in this document are not necessarily those of the
 Environment Agency. Its officers, servants or agents accept no liability for any loss or damage arising from the interpretation or
 use of the information, or reliance upon views contained herein.

 www.gov.uk/environment-agency                                        © Environment Agency 2019                       1
Monthly water situation report - North East Area
Fell Sandstone, represented by the responsive Townlaw borehole, was shown to be ‘below normal’ for
March but this is most likely due to the negligible amounts of rainfall in the catchment in the three days
preceding the borehole dip.

Reservoir Storage

Reservoir stocks have increased during March with the exception of the Tees reservoirs at Cow Green
and the Lune/Balder group. Stocks in all reservoirs except Derwent and the North Tynedale group are
at above average levels for the time of the year. The compensation flow from Derwent reservoir
continued to be substituted by releases from the Kielder tunnel in order to conserve water for public
water supply. Water was also transferred into Mosswood water treatment works from the Kielder tunnel
and pumped from Barrasford on the North Tyne to help refill West Hallington reservoir in the North
Tynedale group.

                                                          Current % Stocks              Previous Month % Stock
                          Kielder                                 94.4                              90.0
                   North Tynedale Group                           83.8                              78.4
                          Derwent                                 61.0                              51.3
                      Durham Group                                94.8                              92.3
                    Lune Balder Group                             95.3                              96.6
                        Cow Green                                 99.5                              99.7

Author:                                       GWHCL team

 All data are provisional and may be subject to revision. The views expressed in this document are not necessarily those of the
 Environment Agency. Its officers, servants or agents accept no liability for any loss or damage arising from the interpretation or
 use of the information, or reliance upon views contained herein.

 www.gov.uk/environment-agency                                        © Environment Agency 2019                       2
Monthly water situation report - North East Area
Rainfall

     Total rainfall (as a percentage of the long term average) for hydrological areas across North East
     England for the current month, the last three months, the last six months, and the last 12 months,
     classed relative to an analysis of respective historic totals. NCIC (National Climate Information Centre)
     data based on the Met Office 5km gridded rainfall dataset derived from rain gauges (Source: Met
     Office © Crown Copyright 2019). Provisional data based on Environment Agency 1km gridded rainfall
     dataset derived from Environment Agency intensity rain gauges.

www.gov.uk/environment-agency                                                 © Environment Agency 2019          3
Above average rainfall                                                       Below average rainfall
                                         1-Month Period for Tweed                                   1-Month Period for Northumbria North Sea Tribs
     200%                                                                       200%

     150%                                                                       150%

     100%                                                                       100%

     50%                                                                        50%

      0%                                                                         0%
            Apr-18

                                Jul-18

                                                     Oct-18

                                                                    Jan-19

                                                                                       Apr-18

                                                                                                          Jul-18

                                                                                                                                  Oct-18

                                                                                                                                               Jan-19
                                         1-Month Period for Tyne                                                     1-Month Period for Wear
     200%
                                                                                200%

     150%
                                                                                150%

     100%
                                                                                100%

     50%
                                                                                 50%

      0%
                                                                                  0%
                                                                                         Apr-18

                                                                                                            Jul-18

                                                                                                                                   Oct-18

                                                                                                                                               Jan-19
            Apr-18

                                Jul-18

                                                     Oct-18

                                                                    Jan-19

                                                                                                                     1-Month Period for Tees
     200%
                             1-Month Period for Seaham, Peterlee Coastal Area   200%

     150%                                                                       150%

     100%                                                                       100%

     50%                                                                        50%

      0%                                                                         0%
            Apr-18

                                Jul-18

                                                     Oct-18

                                                                    Jan-19

                                                                                       Apr-18

                                                                                                          Jul-18

                                                                                                                                  Oct-18

                                                                                                                                               Jan-19

www.gov.uk/environment-agency                                                                                        © Environment Agency 2019          4
Soil Moisture Deficit

www.gov.uk/environment-agency   © Environment Agency 2019   5
River Flow

     Some features of this map are based on digital spatial data licensed from the Centre for Ecology and
     Hydrology, © CEH. Includes material based on Ordnance Survey 1:50 000 maps with the permission
     of the controller of Her Majesty’s Stationery Office © Crown copyright. All rights reserved. Environment
     Agency, 100026380, 2019.

www.gov.uk/environment-agency                                                 © Environment Agency 2019         6
Exceptionally high    Notably high   Above normal                 Normal
          Below normal          Notably low    Exceptionally low        ─── Latest data

www.gov.uk/environment-agency                              © Environment Agency 2019      7
Groundwater Levels

     Some features of this map are based on digital spatial data licensed from the Centre for Ecology and
     Hydrology, © CEH. Includes material based on Ordnance Survey 1:50 000 maps with the permission of
     the controller of Her Majesty’s Stationery Office © Crown copyright. All rights reserved. Environment
     Agency, 100026380, 2019.

www.gov.uk/environment-agency                                              © Environment Agency 2019         8
Exceptionally high                        Notably high                            Above normal                              Normal
                              Below normal                              Notably low                             Exceptionally low                     ─── Latest data
     .
                                             ROYALTY OBSERV.                                                                        TOWNLAW
                          Ranking derived from data for the period Dec-1990 to Dec-2012                    Ranking derived from data for the period Aug-2001 to Nov-2012
                    46.0                                                                        140.0
                    45.5
                                                                                                139.5
                    45.0
         Level (mAOD)

                                                                                           Level (mAOD)
                    44.5                                                                        139.0

                    44.0                                                                        138.5
                    43.5
                                                                                                138.0
                    43.0

                    42.5                                                                        137.5

                    42.0                                                                        137.0
                       Jun-16 Oct-16 Feb-17 Jun-17 Oct-17 Feb-18 Jun-18 Oct-18 Feb-19               Jun-16 Oct-16 Feb-17 Jun-17 Oct-17 Feb-18 Jun-18 Oct-18 Feb-19

                                               AYCLIFFE NRA2                                                                        RED LION
                          Ranking derived from data for the period Mar-1979 to Dec-2012                     Ranking derived from data for the period Aug-1993 to Dec-2012

                                                                                                          6.0
                        85
                                                                                                          5.5
                        83
         Level (mAOD)

                                                                                           Level (mAOD)

                                                                                                          5.0

                        81
                                                                                                          4.5

                        79
                                                                                                          4.0

                        77                                                                                3.5

                        75                                                                                3.0
                         Jun-16 Oct-16 Feb-17 Jun-17 Oct-17 Feb-18 Jun-18 Oct-18 Feb-19                     Jun-16 Oct-16 Feb-17 Jun-17 Oct-17 Feb-18 Jun-18 Oct-18 Feb-19

                                             WEST HALL FARM
                          Ranking derived from data for the period Mar-1979 to Dec-2012

                        3.0

                        2.6
         Level (mAOD)

                        2.2

                        1.8

                        1.4

                        1.0
                          Jun-16 Oct-16 Feb-17 Jun-17 Oct-17 Feb-18 Jun-18 Oct-18 Feb-19

www.gov.uk/environment-agency                                                                                                  © Environment Agency 2019                     9
Reservoir Stocks

                                                                                     Kielder                                                                                                                               N Tyne Group
                                         100                                                                                                                                         100

                                          90                                                                                                                                          90

                                          80                                                                                                                                          80

                                                                                                                                                       Percentage of live capacity
           Percentage of live capacity

                                          70                                                                                                                                          70

                                                                                                                                                                                      60
                                          60

                                                                                                                                                                                      50
                                          50

                                                                                                                                                                                      40
                                          40

                                                                                                                                                                                      30
                                          30

                                                                                                                                                                                      20
                                          20

                                                                                                                                                                                      10
                                          10
                                                                                                                                                                                       0
                                           0                                                                                                                                               Jan   Feb   Mar   Apr   May          Jun          Jul          Aug         Sep     Oct    Nov     Dec
                                               Jan   Feb   Mar   Apr   May          Jun          Jul        Aug      Sep     Oct    Nov    Dec
                                                                                                                                                                                                                         2019         Min          Max         Mean
                                                                         2019         Min             Max     Mean

                                                                                     Derwent                                                                                                                                     Durham
                                         100                                                                                                                                         100

                                          90                                                                                                                                          90

                                          80                                                                                                                                          80
           Percentage of live capacity

                                                                                                                                                 Percentage of live capacity
                                          70                                                                                                                                          70

                                          60                                                                                                                                          60

                                          50                                                                                                                                          50

                                          40                                                                                                                                          40

                                          30                                                                                                                                          30

                                          20                                                                                                                                          20

                                          10                                                                                                                                          10

                                           0                                                                                                                                           0
                                               Jan   Feb   Mar   Apr   May          Jun          Jul         Aug      Sep    Oct    Nov    Dec                                             Jan   Feb   Mar   Apr   May      Jun             Jul          Aug      Sep       Oct     Nov    Dec

                                                                             2019         Min         Max     Mean                                                                                                       2019     Min             Max      Mean

                                                                                Cow Green                                                                                                                                   Lune Balder
                                         100                                                                                                                                         100

                                          90                                                                                                                                          90

                                          80                                                                                                                                          80
                                                                                                                                                       Percentage of live capacity
      Percentage of live capacity

                                          70                                                                                                                                          70

                                          60                                                                                                                                          60

                                          50                                                                                                                                          50

                                          40                                                                                                                                          40

                                          30                                                                                                                                          30

                                          20                                                                                                                                          20

                                          10                                                                                                                                          10

                                           0                                                                                                                                           0
                                               Jan   Feb   Mar   Apr   May      Jun             Jul         Aug      Sep    Oct    Nov    Dec                                              Jan   Feb   Mar   Apr   May          Jun          Jul         Aug          Sep    Oct     Nov    Dec

                                                                         2019         Min         Max        Mean                                                                                                    2019         Min         Max         Mean

www.gov.uk/environment-agency                                                                                                                                                                                      © Environment Agency 2019                                                       10
Glossary
     Term                          Definition

     Aquifer                       A geological formation able to store and transmit water.
     Areal average rainfall        The estimated average depth of rainfall over a defined area.
                                   Expressed in depth of water (mm).
     Effective rainfall            The rainfall available to percolate into the soil or produce
                                   river flow. Expressed in depth of water (mm).
     Groundwater                   The water found in an aquifer
     Recharge                      The process of increasing the water stored in the saturated
                                   zone of an aquifer. Expressed in depth of water (mm).
     Reservoir live capacity       The reservoir capacity normally usable for storage to meet
                                   established reservoir operating requirements. It is the total
                                   capacity less that not available because of operating
                                   agreements or physical restrictions. Only under abnormal
                                   conditions, such as a severe water shortage might this
                                   additional water be extracted.
     Soil moisture deficit (SMD)   The difference between the amount of water actually in the
                                   soil and the amount of water that the soil can hold.
                                   Expressed in depth of water (mm).

     Categories
     Exceptionally high            Value likely to fall within this band 5% of the time
     Notably high                  Value likely to fall within this band 8% of the time
     Above normal                  Value likely to fall within this band 15% of the time
     Normal                        Value likely to fall within this band 44% of the time
     Below normal                  Value likely to fall within this band 15% of the time
     Notably low                   Value likely to fall within this band 8% of the time
     Exceptionally low             Value likely to fall within this band 5% of the time

     Units
     cumecs                        Cubic metres per second (m3 s-1)
     mAOD                          Metres Above Ordnance Datum (mean sea level at Newlyn
                                   Cornwall).

www.gov.uk/environment-agency                                                 © Environment Agency 2015
You can also read