Moving Will County Market Analysis May 2020 Chicago Metropolitan Agency for Planning (CMAP) - DATE PRODUCED FOR
←
→
Page content transcription
If your browser does not render page correctly, please read the page content below
Moving Will County
Market Analysis

DATE

May 2020

PRODUCED FOR

Chicago Metropolitan Agency
for Planning (CMAP)

I.     SUMMARY AND CONCLUSIONS         3

II.    OVERVIEW OF STUDY AREA          7

III.   DEMOGRAPHICS AND EMPLOYMENT     9

IV.    INDUSTRIAL MARKET TRENDS        21

V.     HOUSING OVERVIEW AND FOR-SALE
       HOUSING MARKET                  32

VI.    RENTAL HOUSING MARKET           45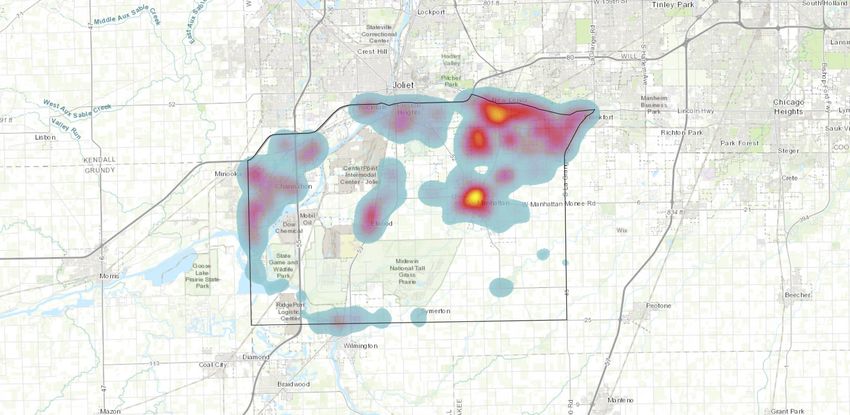
SUMMARY AND CONCLUSIONS intervention, communities may see a wave of
mortgage defaults once more. The rental market
Project Scope will be disrupted short-term, as tenants may not be
able to afford their rents and will seek less
Kretchmer Associates prepared a market analysis expensive options. During the prior recession, those
for the southwestern area of Will County, an area who lost their homes to foreclosure became
roughly bounded by I-80 and Route 30 on the north, renters, which increased rental demand.
Wilmington-Peotone Road on the south, the Cook –
Will county border on the east, and the Will – The industrial market in the Land Use Study Area
Grundy county border on the west. The purpose of (LUSA) is heavily dependent on transportation and
this study is to provide a realistic market-driven logistics, including warehouses for e-commerce.
analysis from which future land use planning While some shipments have been reduced, demand
scenarios can be developed. The focus of this for food and other staples has increased, and
report is on the industrial and residential markets demand may exist for flexible warehouse space to
as these are the ones with the greatest opportunity meet unpredictable logistics needs. We expect that
for growth. the shake-out in the retail industry will continue,
resulting in continued demand for large
The findings in this report reflect our review of warehouses and the intermodal facilities in the
industry research, our own analysis, and phone LUSA.
interviews conducted with employees of Cushman
Wakefield, Colliers, NAI Hiffman, JLL, Avison Young, Major Opportunity Areas
and CenterPoint familiar with Will County, as well
as multiple residential realtors or sales agents. The Land Use Existing Conditions Report suggests 8
Major Opportunity Areas based on 6 criteria,
Incorporating Uncertainty from COVID-19 including 2 opportunity areas selected for near
term change. The criteria are:
At the time of this writing, there is considerable
uncertainty about the economy and real estate Proximity to major transportation corridors,
market nationally, regionally and locally. The full including I-55, I-80, and IL-53
impacts will not be known until the pandemic ends. Proximity to major economic anchors
Whether this will result in a prolonged recession, Significant contiguous land for new
how long it will take businesses to ramp up again, development and infill opportunities
and how quickly individuals will get back to work Proximity to existing municipal incorporated
will determine the short-term impacts. Long term areas and existing infrastructure
impacts are difficult to predict. Potential to protect waterways including
Jackson Creek, Des Plaines River, and DuPage
The pandemic strongly impacts the retail industry, River
which had problems prior to the virus outbreak.
Homebuilding will be affected depending on how
long unemployment and furloughs last and how
long it takes for buyers to recoup the losses to their
savings for a down payment. Absent government
3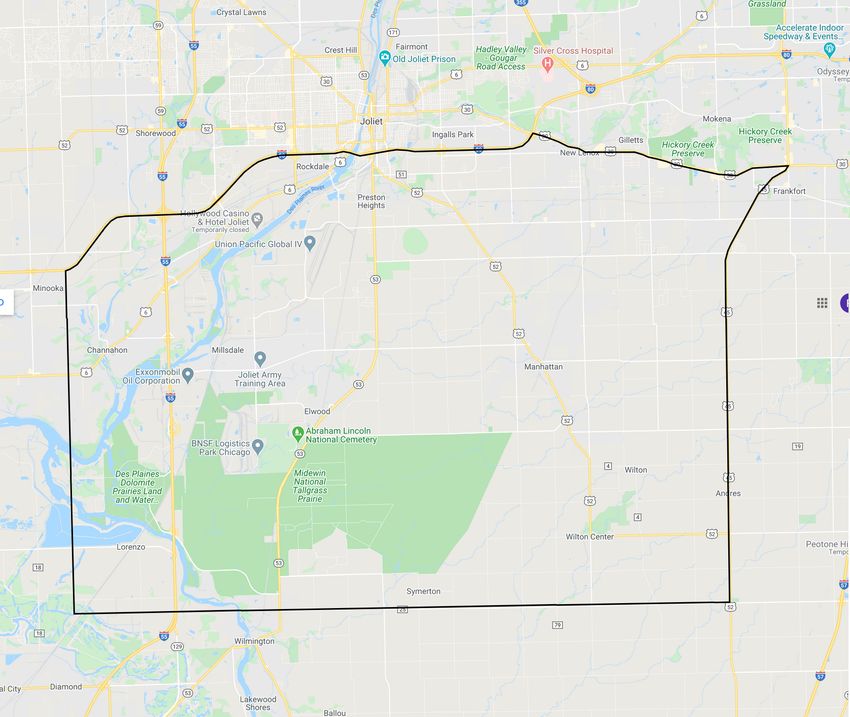
Major Opportunity Areas DRAFT 3-3-20
MAJOR OPPORTUNITY AREA
AREA AROUND
8 Major Opportunity Areas
EXISTING OPEN SPACES PROPOSED are suggested based on
HOUBOLT the following criteria:
PLANNED FPDWC TRAILS BRIDGE SOUTH
OF I-80 • PROXIMITY TO MAJOR
TRANSPORTATION
CORRIDORS,
VACANT AREA INCLUDING I-55, I-80
IN MINOOKA AND IL 53.
ALONG I-80
6 • PROXIMITY TO MAJOR
ECONOMIC ANCHORS
• SIGNIFICANT
CONTIGUOUS LAND
8 FOR NEW
DEVELOPMENT AND
INFILL
4 1 IKEA/AMAZON/
7
OPPORTUNITIES
SPEEDWAY
AREA • PROXIMITY TO
3 EXISTING MUNICIPAL
INCORPORATED
AREAS AND EXISTING
INFRASTRUCTURE
AREA IN
AREA EAST OF
CHANNAHON AREA WEST OF • POTENTIAL TO
THE UP
ALONG I-55 THE UP
INTERMODAL
PROTECT
INTERMODAL
IN JOLIET
WATERWAYS
INCLUDING JACKSON
5
IN JOLIET
CREEK, DES PLAINES
RIVER AND DUPAGE
RIVER
• OPPORTUNITIES TO
BOTH SIDES OF I-55 IMPLEMENT FPDWC
SOUTH OF EXXON PLANNED TRAIL
CORRIDORS,
INCLUDING THE IL 53,
ELION LOGISTICS
JACKSON CREEK AND
PARK AREA WEST DUPAGE RIVER TRAIL
OF I-55 CORRIDORS
2 Source: Ginkgo Planning
& Design
Data sources: CMAP Land Use, 2015; Satellite Imagery, 2017; Will County GIS, 2019. Note: The CMAP 2015 Land Use Inventory data used in this analysis is draft data.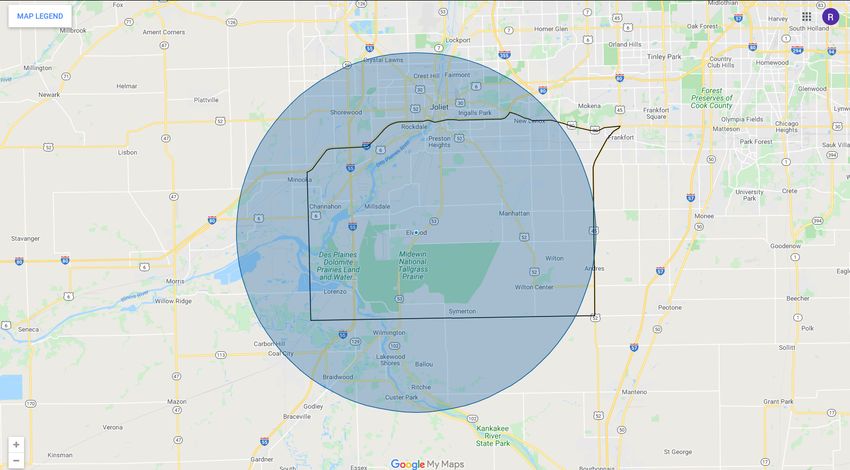
Opportunities to implement Forest Preserve The area is most known regionally as the major
District of Will County (FPDWC) planned trail transportation and logistics hub for the greater
corridors, including the IL-53, Jackson Creek, Chicago region and the Midwest with two major
and DuPage River Trail corridors intermodal facilities. This has created conflicts
between residents and industry relative to truck
The above-described criteria are compatible with traffic, congestion and pollution. The purpose of
market factors that influence where development this report is to provide data and analysis that can
occurs. Specifically, locations within 3 miles of I-80 be used to develop recommendations for mitigating
and I-55 (preferably within 1 mile) are most these conflicts through the Truck Routing Study
attractive in general for industry in the LUSA, while and to develop scenarios for future land use that
proximity to IL-53 is also attractive for companies’ address the needs of residents, businesses,
regional distribution networks. property owners and government.
Companies like IKEA and Amazon are major Industrial space grew by 82% in the LUSA in the
economic anchors, users that tend to predict what past ten years to well over 55 million square feet.
places will be attractive to other companies looking While the industrial vacancy rate was higher at the
for similar locational attributes. Major economic end of 2018 (14.8%) than it had been over the prior
anchors also include infrastructure important to three years, it dropped to 13.0% by the end of 2019.
industry, especially the UP and BSNF intermodal A tight market in 2016 led to overbuilding over the
facilities in Joliet and Elwood. next two years, though there is still a large amount
of interest in leasing and owning these warehouses,
To site the 1 million square foot industrial buildings particularly from third party logistics companies
demanded in the LUSA, developers need 50 (3PL), major retailers (Walmart, Target, IKEA, etc.)
contiguous acres. Many also need proximity to and e-commerce companies such as Amazon.
labor leading them to infill sites closer to existing
concentrations. Some existing parks have “pad- Residential development has picked up since the
ready” sites to meet these needs. As development end of the recession with almost 1,800 housing
progresses, infill sites with good access to labor units added between 2014 and 2018, 88% of which
become more scarce, leading developers to seek was single-family homes. New builders took over
land elsewhere. To avoid land use conflict and dormant subdivisions that were stalled by the
negative impacts from trucking and traffic recession and built new product that has sold well
congestion, it makes economic sense to steer if priced at entry to middle market prices.
development demand to opportunity areas that
match the criteria listed above. At this time, there are more than 1,200 approved
but unbuilt lots with infrastructure in Manhattan
Summary of Findings and more than 2,100 approved without
infrastructure (assuming the village’s typical
The Land Use Study Area is growing in both residential density). However, concern over
population and employment, and this trend is industrial development west of US-52 has raised
projected to continue, though most likely at a concerns over the future marketability of homes
slower rate than it has since the end of the west of Cedar Road. This impacts existing homes as
recession. well as new construction.
5
There is only one small subdivision in Joliet in the        Since the market for retail development will follow
LUSA with unbuilt lots and none in Elwood. There            the increase in rooftops, future retail demand will
are also subdivisions in Channahon not yet built            be dictated by the pace of residential development.
out, as well as extensive land for future residential       The LUSA and southwestern Will County are not
growth.                                                     significant office locations within the Chicago
                                                            region. Other than office space to serve the local
Based on short-term projections by demographic              population, such as medical and service
data provider Esri and extrapolating CMAP’s Will            businesses, office development will play a minor
County 2050 projections to the LUSA, we estimate            role in future development in the LUSA.
demand for 13,500 residential units, or 468 per year
on average by 2050. Of these, the annual average
number of owner-occupied units is 305 and the
number of rental units is 163. Given the very limited
supply of rental units in the LUSA and the need for
workforce housing to meet employment needs, we
estimate that the rental share will increase from its
current 18% to 25%. This will require zoning
changes on the part of municipalities, which
currently have almost all residential land zoned for
single-family housing.

                                                        6
OVERVIEW OF STUDY AREA                                    Of these 124 square miles, nearly 93% is currently
                                                          unincorporated. Other major uses include large
The LUSA is in southwestern Will County and               industrial parks, two intermodal facilities, single-
includes all or portions of Joliet, Elwood,               family residential neighborhoods, and publicly
Manhattan, Channahon, Minooka, Wilmington,                owned open space and natural resources, most
Rockdale, New Lenox, Mokena, Frankfort, and               notably the Midewin National Tallgrass Prairie and
Symerton. It is bounded by I-80 and Route 30 on the       the Abraham Lincoln National Cemetery.
north, the Will - Cook County line on the east,
Wilmington-Peotone Road on the south and the Will         A map of the area is on the following page.
- Grundy county line on the west. It covers
approximately 242 square miles, 51% of which (124
square miles) is agricultural.

                                                      7
Moving Will County Land Use Study Area Source: Kretchmer Associates 8
DEMOGRAPHICS AND EMPLOYMENT
                                                          The median age is higher in the LUSA at 38.9 years
Population and Households                                 than in the county overall (36.9 years).

Table 1 shows the population and household trends         Household Income
in the Land Use Study Area and Will County from
2000 and projected to 2024 based on the U.S.              The median household income in the LUSA is
Census and estimates and projections by Esri, a           estimated at $90,843, 8% higher than the county’s
demographic data vendor. The LUSA registered a            $83,997. Almost 23% of households in the LUSA
major increase in both population and households          and 27% in the county have incomes under
(30-32%) between 2000 and 2010 with significant           $50,000, the level that generally equates to 60% of
growth prior to the recession.                            the Area Median Income or AMI in the Chicago
                                                          metropolitan area.
New residential development stalled after the
recession but started up again in the middle of the       On the upper end, 45% of the LUSA’s and 41% of
decade. As such, both population and households           the county’s households have incomes over
experienced an 8% increase between 2010 and               $100,000, with 8-9% over $200,000. The median
2019 and are projected to increase by another 5%          incomes are projected to increase by 11% over the
over the next five years. (Note that these                next five years. Table 2 shows the income
projections pre-date the COVID-19 outbreak.)              distribution and projection for 2024.

Will County’s growth was even higher prior to the         Households by Age and Income
recession with population and household growth of
34-35% between 2000 and 2010. Both grew, but at           Almost 20,000 households in the LUSA or 78% are
a much lower rate of 4% between 2010 and 2019,            under 65. By 2024, the number is projected to grow
with projected growth of 3% by 2024.                      very slightly by only 0.4%.

Both the LUSA and county are characterized by             The number of senior households is projected to
households with children. Twenty percent of the           increase by 19%, consistent with the aging of the
LUSA’s population is under 15; in the county the          Baby Boomer population.
share is higher at 22%. Approximately 13% of
residents in both the Land Use Study Area and             The most significant increases will be among those
county are senior citizens. Thirty-seven percent of       headed by a household 25-44, 65-74 and 75+ years
the LUSA’s population is ages 25-54, lower than the       of age. The 25-44-year-old cohort includes young
county’s 41%.                                             families with children. Table 3 shows these trends.

                                                      9
Table 1
POPULATION CHARACTERISTICS
LAND USE STUDY AREA AND WILL COUNTY
Land Use Study Area Will County
Number Percent Number Percent
Population
2000 Census 54,325 502,288
2010 Census 70,348 677,560
Change, 2000-2010 16,023 29.5% 175,272 34.9%
2019 Estimated 75,815 706,224
Change, 2010-2019 5,467 7.8% 28,664 4.2%
2024 Projected 79,332 725,533
Change, 2019-2024 3,517 4.6% 19,309 2.7%
Households
2000 Census 17,937 167,550
2010 Census 23,683 225,256
Change, 2000-2010 5,746 32.0% 57,706 34.4%
2019 Estimated 25,649 235,135
Change, 2010-2019 1,966 8.3% 9,879 4.4%
2024 Projected 26,856 241,806
Change, 2019-2024 1,207 4.7% 6,671 2.8%
Average Household Size, 2019 2.93 2.96
Population by Age, 2019
Under 5 4,496 5.9% 46,684 6.6%
5-14 11,020 14.5% 105,673 15.0%
15-24 9,323 12.3% 88,883 12.6%
25-34 9,160 12.1% 93,241 13.2%
35-44 10,185 13.4% 99,032 14.0%
45-54 10,998 14.5% 98,080 13.9%
55-64 10,479 13.8% 85,769 12.1%
65-74 6,402 8.4% 55,168 7.8%
75-84 2,714 3.6% 24,302 3.4%
85+ 1,038 1.4% 9,392 1.3%
Median Age, 2019 38.9 36.9
Source: Esri
10Table 2
INCOME CHARACTERISTICS
LAND USE STUDY AREA AND WILL COUNTY
Land Use Study Area Will County
Number Percent Number Percent
2019 Household Distribution 25,649 235,135
Under $15,000 1,180 4.6% 13,645 5.8%
$15,000-24,999 1,322 5.2% 14,548 6.2%
$25,000-34,999 1,251 4.9% 13,610 5.8%
$35,000-49,999 2,087 8.1% 21,006 8.9%
$50,000-74,999 4,200 16.4% 39,548 16.8%
$75,000-99,999 3,987 15.5% 35,290 15.0%
$100,000-149,999 6,088 23.7% 50,557 21.5%
$150,000-199,999 3,330 13.0% 27,360 11.6%
$200,000+ 2,204 8.6% 19,571 8.3%
Median Household Income $90,843 $83,997
2024 Household Distribution 26,856 241,806
Under $15,000 1,060 3.9% 11,967 4.9%
$15,000-24,999 1,189 4.4% 12,833 5.3%
$25,000-34,999 1,083 4.0% 11,944 4.9%
$35,000-49,999 1,884 7.0% 18,939 7.8%
$50,000-74,999 4,062 15.1% 38,065 15.7%
$75,000-99,999 3,968 14.8% 35,075 14.5%
$100,000-149,999 6,684 24.9% 55,679 23.0%
$150,000-199,999 4,269 15.9% 34,395 14.2%
$200,000+ 2,657 9.9% 22,909 9.5%
Median Household Income $100,811 $93,045
Note: Numbers may not sum to given totals due to rounding.
Source: Esri
11Table 3
HOUSEHOLDS BY AGE
LAND USE STUDY AREA
2019 2024 Change
Number Percent Number Percent Number Percent
Households by Age 25,650 26,857 1,207 4.7%
Age 15-24 307 1.2% 293 1.1% -14 -4.6%
Age 25-34 3,283 12.8% 3,548 13.2% 265 8.1%
Age 35-44 4,930 19.2% 5,308 19.8% 378 7.7%
Age 45-54 5,662 22.1% 5,283 19.7% -379 -6.7%
Age 55-64 5,693 22.2% 5,529 20.6% -164 -2.9%
Total Under 65 19,875 77.5% 19,961 74.3% 86 0.4%
Age 65-74 3,716 14.5% 4,321 16.1% 605 16.3%
Age 75+ 2,059 8.0% 2,575 9.6% 516 25.1%
Total 65+ 5,775 22.5% 6,896 25.7% 1,121 19.4%
Source: Esri
Table 4 shows the household income distribution The number of households under 65 with incomes
for those under 65 and 65+ years of age. Among under $100,000 is projected to decrease, while the
those under 65, 18% have incomes below $50,000, number with incomes over $100,000 is projected to
while 40% of those 65+ are in this category. increase by 2024. This is due to the assumed
increase in household incomes. The number of
Seniors often have lower incomes than younger households 65+ is projected to increase for all
households since most are no longer working. income groups except for those under $25,000.
However, 18% of seniors in the LUSA have incomes
under $25,000, indicating a significant number of Household Size and Type
very low-income households. In contrast, only 7%
of households under 65 are very low-income. The LUSA is fairly evenly split between small (1-2
person) and larger (3+-person) households. Over
75% are considered family households as shown in
Table 5.
12Table 4
HOUSEHOLDS BY AGE AND INCOME
LAND USE STUDY AREA
2019 2024 Change
Number Percent Number Percent Number Percent
Household Income - Under Age 65
$0-$14,999 735 3.7% 621 3.1% -114 -15.5%
$15,000-$24,999 729 3.7% 602 3.0% -127 -17.4%
$25,000-$34,999 728 3.7% 556 2.8% -172 -23.6%
$35,000-$49,999 1,325 6.7% 1,081 5.4% -244 -18.4%
$50,000-$74,999 2,876 14.5% 2,533 12.7% -343 -11.9%
$75,000-$99,999 3,158 15.9% 2,935 14.7% -223 -7.1%
$100,000-$149,999 5,370 27.0% 5,658 28.3% 288 5.4%
$150,000-$199,999 2,981 15.0% 3,698 18.5% 717 24.1%
$200,000+ 1,973 9.9% 2,277 11.4% 304 15.4%
Household Income - Age 65+
$0-$14,999 444 7.7% 439 6.4% -5 -1.1%
$15,000-$24,999 594 10.3% 587 8.5% -7 -1.2%
$25,000-$34,999 523 9.1% 528 7.7% 5 1.0%
$35,000-$49,999 764 13.2% 804 11.7% 40 5.2%
$50,000-$74,999 1,325 22.9% 1,529 22.2% 204 15.4%
$75,000-$99,999 828 14.3% 1,033 15.0% 205 24.8%
$100,000-$149,999 718 12.4% 1,026 14.9% 308 42.9%
$150,000-$199,999 348 6.0% 570 8.3% 222 63.8%
$200,000+ 231 4.0% 380 5.5% 149 64.5%
Source: Esri
13Table 5
HOUSEHOLD CHARACTERISTICS
LAND USE STUDY AREA
Number Percent
Households by Size 25,468
1 Person 5,259 20.6%
2 Person 7,746 30.4%
3 Person 4,500 17.7%
4 Person 4,559 17.9%
5 Person 2,339 9.2%
6 Person 675 2.7%
7 + Person 390 1.5%
Households by Type
Non-Family Households 6,207 24.4%
Family Households 19,261 75.6%
Note: Due to data availability, Land Use Study Area
approximated using Census tracts.
Source: US Census, American Community Survey
2014-2018
ON TO 2050 Projections 2050 is projected at 1.7% or 3,900. This is 3.4 times
higher than the estimated 2010-2019 average
CMAP projections for 2050 show Will County’s household growth of 0.5%.
population increasing by 58% from 2010 to 2050 for
an annual average of 1.4% as shown in Table 6. Should these projections occur, there will be
With Esri’s 2019 population estimate of 706,200 (as significant demand countywide for new housing.
shown above), the average annual increase from With areas to the north in Will County more built
2019-2050 equates to 1.6% or 11,300. out, it is likely that the Land Use Study Area could
grow at a higher rate depending on residential land
Translating this increase to households based on availability and industrial development patterns.
an average 2019 household size of 2.96 persons,
the average annual household growth from 2019-
14Table 6
WILL COUNTY POPULATION AND HOUSEHOLDS
2010-2050
Population Change
CMAP Projection
2010 669,013
2015 678,149
2050 1,056,213
2010-2050 Change 387,200 58%
2010-2050 Average Annual Change 9,680 1.4%
Esri Population Estimate
2019 706,224
Change 2019-2050 349,989 50%
2019-2050 Average Annual Change 11,290 1.6%
Estimated Households 2019-2050
2019 Average Household Size 2.96
2019 Households 235,135
2050 Households 356,829
Change 2019-2050 121,694 52%
Average Annual Household Change 3,926 1.7%
Source: CMAP, ON TO 2050 Socioeconomic Forecast Appendix,
Esri, Kretchmer Associates.
15Jobs and Businesses by Industry Major Employers
The total mix of jobs as of 2017 (according to the The largest employer in the LUSA is Amazon in
U.S. Census’ Longitudinal Employer Household Joliet, with approximately 3,500 employees. Other
Dynamics program) shows that 48% of employees major employers include Walmart, BNSF, Stepan (a
in the LUSA earned more than $40,000, but 20% chemical manufacturer), and Georgia Pacific
earned less than $15,000. In the decade from 2008- (paper) in Elwood; ExxonMobil (refinery) and Bunge
2017, employment in the LUSA grew by 11,300 or Loders Croklaan (global vegetable oils and fats
47% and 51% of these new employees earned more manufacturer) in Channahon; Michaels (crafts) in
than $40,000 per year. New Lenox; Meijer in Mokena; and Michelin in
Wilmington. The number of companies by industry
Although some positions in these industries are not in the LUSA appears in Table 9, while estimated
tied to industrial real estate, enough are that we jobs at these employers appear in Table 10.
consider Utilities, Construction, Manufacturing,
and Transportation and Warehousing to be Commuting Trends
industrial for this purpose. As of 2017, 41% of jobs
in the LUSA (14,500 jobs) were in these four Only 14% of employees both live and work in the
sectors, higher than the share of Will County’s jobs LUSA. A plurality of those who work in the LUSA live
in the same industries (22%). The LUSA accounts in Joliet (14% or 4,900 people). Chicago is home to
for only 14% of the county’s total jobs but 26% of 6% of workers (2,300), New Lenox to 4% (1,500),
its jobs in these sectors. Manufacturing had the Channahon to 3% (900), and Manhattan to 2%
largest number of jobs (5,400), followed by (700). Other home locations for over 400 LUSA
Transportation and Warehousing (4,600). workers each are: Tinley Park, Crest Hill, Minooka,
Shorewood, Frankfort, Lockport, Bolingbrook,
These industrial sectors have seen steady growth Mokena, Orland Park, Wilmington, Morris,
since 2009 with a spike in 2016. The number of jobs Plainfield, and Romeoville.
in Transportation and Logistics increased 66%,
while manufacturing jobs declined by 4%. Tables Over ¼ of LUSA residents work in Chicago (4,200 or
showing jobs located in the LUSA (at-place 11%), Joliet (3,800 or 10%), or New Lenox (2,400 or
employment) and resident employment by industry 6%). Over 1,000 LUSA residents each commute to
follow. Frankfort or Mokena, while over 400 each travel to:
Orland Park, Tinley Park, Bolingbrook, Naperville,
The vast majority (30,500 or 78%) of employed Channahon, Aurora, Downers Grove, Romeoville,
residents living in the LUSA do not work in these Minooka, Plainfield, Manhattan.
industrial sectors. The largest single employment
sectors in 2017 were Health Care and Social
Assistance, Educational Services, and Retail Trade,
though these are followed by Manufacturing.
16Table 7
JOBS LOCATED IN THE LAND USE STUDY AREA
2017 Change
NAICS Industry 2008 2009 2010 2011 2012 2013 2014 2015 2016
Number Percent Number Percent
All 24,244 24,834 25,080 26,950 26,901 28,508 28,573 29,828 32,894 35,583 100.0% 11,339 39.8%
11 Agriculture, Forestry, Fishing, and Hunting 54 48 69 45 59 49 54 71 69 55 0.2% 1 2.0%
21 Mining 93 91 79 99 88 66 84 97 140 119 0.3% 26 39.4%
22 Utilities 763 777 800 1,575 1,727 1,679 1,710 1,815 1,747 1,657 4.7% 894 53.2%
23 Construction 2,793 2,492 2,793 1,965 2,013 2,305 2,758 2,844 3,197 2,855 8.0% 62 2.7%
31-33 Manufacturing 4,695 4,361 5,624 5,593 5,422 5,336 5,215 5,267 5,325 5,392 15.2% 697 13.1%
42 Wholesale Trade 1,365 1,934 1,847 2,071 2,000 2,212 2,178 2,355 2,321 5,866 16.5% 4,501 203.5%
44-45 Retail Trade 1,625 1,688 1,817 2,224 1,976 1,922 1,942 2,321 2,526 2,754 7.7% 1,129 58.7%
48-49 Transportation and Warehousing 2,784 2,833 2,826 3,546 3,669 4,095 4,396 4,109 5,679 4,638 13.0% 1,854 45.3%
51 Information 131 133 274 238 194 216 220 213 204 198 0.6% 67 31.0%
52 Finance and Insurance 492 486 508 563 557 706 651 488 443 424 1.2% -68 -9.6%
53 Real Estate Rental and Leasing 171 159 123 138 154 206 236 292 271 318 0.9% 147 71.4%
54 Professional, Scientific, and Technical Services 731 790 775 902 929 809 803 844 858 855 2.4% 124 15.3%
55 Management of Companies and Enterprises 22 12 20 10 29 41 34 21 5 4 0.0% -18 -43.9%
56 Administrative and Support and Waste 731 954 798 1,062 1,518 1,752 1,453 1,448 1,462 1,552 4.4% 46.9%
Management and Remediation Services 821
61 Educational Services 1,417 1,602 1,125 1,121 1,066 1,067 1,084 1,275 1,294 1,221 3.4% -196 -18.4%
62 Health Care and Social Assistance 1,824 1,985 1,095 1,209 1,153 1,348 1,359 1,658 2,670 2,706 7.6% 882 65.4%
71 Arts, Entertainmen, and Recreation 1,737 1,552 1,421 1,581 1,587 1,500 1,240 1,317 1,190 1,211 3.4% -526 -35.1%
72 Accommodations and Food Services 1,388 1,527 1,492 1,506 1,268 1,360 1,386 1,594 1,779 1,917 5.4% 529 38.9%
81 Other Services (except Public Administration) 927 889 1,022 951 930 1,263 1,176 1,131 1,123 1,264 3.6% 337 26.7%
92 Public Administration 501 521 572 551 562 576 594 668 591 577 1.6% 76 13.2%
Source: U.S. Census, Longitudinal Employer Household Dynamics Program
17Table 8
EMPLOYEES LIVING IN THE LAND USE STUDY AREA
2017 Change
NAICS Industry 2008 2009 2010 2011 2012 2013 2014 2015 2016
Number Percent Number Percent
All 34,745 32,794 33,433 36,579 37,086 37,282 38,130 38,660 39,166 39,169 100.0% 4,424 11.9%
11 Agriculture, Forestry, Fishing, and Hunting 50 64 62 59 56 49 54 59 72 54 0.1% 4 8.2%
21 Mining 33 30 45 40 36 28 33 35 31 38 0.1% 5 17.9%
22 Utilities 279 354 342 397 450 451 438 481 430 409 1.0% 130 28.8%
23 Construction 2,639 2,201 1,990 2,026 2,080 2,080 2,310 2,576 2,580 2,712 6.9% 73 3.5%
31-33 Manufacturing 4,201 3,567 3,508 3,815 3,805 3,765 3,676 3,578 3,706 3,615 9.2% -586 -15.6%
42 Wholesale Trade 1,934 1,869 1,810 1,986 2,024 2,047 2,109 2,063 2,129 2,219 5.7% 285 13.9%
44-45 Retail Trade 3,815 3,626 3,748 4,247 4,151 4,006 4,063 4,125 4,233 4,109 10.5% 294 7.3%
48-49 Transportation and Warehousing 1,528 1,387 1,388 1,610 1,642 1,711 1,738 1,795 1,940 1,902 4.9% 374 21.9%
51 Information 605 580 661 643 604 615 650 583 629 569 1.5% -36 -5.9%
52 Finance and Insurance 1,416 1,376 1,488 1,499 1,481 1,451 1,477 1,456 1,465 1,531 3.9% 115 7.9%
53 Real Estate Rental and Leasing 413 379 385 425 427 448 488 437 461 483 1.2% 70 15.6%
54 Professional, Scientific, and Technical Services 1,817 1,776 1,812 2,021 2,022 2,149 2,204 2,276 2,267 2,282 5.8% 465 21.6%
55 Management of Companies and Enterprises 382 365 412 464 473 418 478 465 415 392 1.0% 10 2.4%
56 Administrative and Support and Waste 1,964 1,546 1,761 1,989 2,129 2,112 2,269 2,231 2,263 2,341 6.0% 17.9%
Management and Remediation Services 377
61 Educational Services 3,387 3,719 4,007 4,266 4,220 4,414 4,470 4,443 4,436 4,417 11.3% 1,030 23.3%
62 Health Care and Social Assistance 4,229 4,087 4,098 4,674 4,890 4,825 4,856 5,103 5,189 5,009 12.8% 780 16.2%
71 Arts, Entertainmen, and Recreation 881 865 871 964 957 928 902 893 920 959 2.4% 78 8.4%
72 Accommodations and Food Services 2,500 2,400 2,200 2,505 2,655 2,690 2,722 2,889 2,899 2,966 7.6% 466 17.3%
81 Other Services (except Public Administration) 1,199 1,166 1,215 1,282 1,323 1,386 1,448 1,437 1,491 1,517 3.9% 318 22.9%
92 Public Administration 1,473 1,437 1,630 1,667 1,661 1,709 1,745 1,735 1,610 1,645 4.2% 172 10.1%
Source: U.S. Census, Longitudinal Employer Household Dynamics Program
18Table 9
COMPANIES LOCATED IN THE LAND USE STUDY AREA AND WILL COUNTY (2019)
Land Use Study Area Will County
NAICS Industry
Number Percent Number Percent
All 2,235 100.0% 19,205 100.0%
11 Agriculture, Forestry, Fishing, and Hunting 11 0.5% 60 0.3%
21 Mining 11 0.5% 25 0.1%
22 Utilities 5 0.2% 26 0.1%
23 Construction 296 13.2% 1,842 9.6%
31-33 Manufacturing 118 5.3% 818 4.3%
42 Wholesale Trade 108 4.8% 738 3.8%
44-45 Retail Trade 238 10.6% 2,459 12.8%
48-49 Transportation and Warehousing 119 5.3% 624 3.2%
51 Information 29 1.3% 324 1.7%
52 Finance and Insurance 78 3.5% 931 4.8%
53 Real Estate Rental and Leasing 84 3.8% 727 3.8%
54 Professional, Scientific, and Technical Services 175 7.8% 1,671 8.7%
55 Management of Companies and Enterprises 3 0.1% 18 0.1%
56 Administrative and Support and Waste 95 4.3% 861 4.5%
Management and Remediation Services
61 Educational Services 63 2.8% 580 3.0%
62 Health Care and Social Assistance 136 6.1% 1,801 9.4%
71 Arts, Entertainmen, and Recreation 52 2.3% 435 2.3%
72 Accommodations and Food Services 131 5.9% 1,339 7.0%
81 Other Services (except Public Administration) 301 13.5% 2,465 12.8%
92 Public Administration 77 3.4% 442 2.3%
99 Unclassified 104 4.7% 1,019 5.3%
Sources: Esri, Infogroup
19Table 10
MAJOR EMPLOYERS IN THE LAND USE STUDY AREA
Employer Municipality Industry Employees
Amazon Joliet Distribution - General Merchandise 3,500
Walmart Elwood Distribution - General Merchandise 900
BNSF Elwood Logistics - Rail 800
ExxonMobil Channahon Energy - Refinery 710
Stepan Elwood Manufacturing - Chemicals 450
Michaels New Lenox Distribution - Crafts 400
Georgia-Pacific Elwood Distribution - Paper 400
Bunge Loders Croklaan Channahon Manufacturing - Oils 325
Meijer Mokena Retail - Grocery 300
Michelin Wilmington Distribution - Tires 300
Note: Efforts were made to show the largest employers, but this list may not be comprehensive.
Source: Comprehensive Annual Financial Reports, ESRI Business Analyst
Unemployment Trends Warehouse Workers for Justice (WWJ) estimates
that 70% of Chicagoland warehouses employ
COVID-19 has severely upended the economy and temporary employees rather than direct hires.
led to historic mass layoffs in March 2020. According to the organization, many workers report
However, monthly labor force reports from the that in suburban Will County it is impossible to find
Illinois Department of Employment Security (IDES) work anywhere other than at a staffing agency. For
do not yet reflect these layoffs, so available local example, WWJ notes that workers at Walmart’s
statistics reflect the previous long run of near “full Import Distribution Center in Elwood were split
employment” nationwide. among 10 different employers until recently. Large
companies like Walmart now employ layers of
As of January 2020, Will County’s unemployment subcontractors, each competing to provide flexible
rate was 4%, an improvement of 1.1 percentage labor at a low cost. These may be staffing
points over January 2019. The Chicago MSA’s rate companies themselves or third party logistics firms
of 3.8% was similar and improved by the same who subcontract while handling supply chains for
scale over the previous year. Will County’s rate in other retailers and manufacturers.
January was the same as Illinois and the nation.
Author and President Obama’s head of the
The “Perma-Temp” System Department of Labor’s Wage and Hour Division
David Weil calls this phenomenon the “fissured
The nature of warehouse employment has changed
workplace” and criticizes it for leaving many
in modern retail and TDL industries in a trend that
without fair wages, a career path, or a safe work
complicates the measurement of industry
environment.
employment and also negatively impacts workers.
20INDUSTRIAL MARKET TRENDS
Due to this rapid pace of newly constructed huge
Will County buildings, Will County’s vacancy rate was much
higher than the Chicago region’s (3.6%) as of the
According to CBRE, the global real estate brokerage third quarter of 2019. The County’s share of the
firm, 4th quarter 2019 was the 38th consecutive region’s industrial inventory was 16% at year-end
quarter of positive net absorption in the Chicago 2019, up from 12% in 2010 due to land availability
industrial market, with a total of 12.5 million square and excellent highway access.
feet absorbed for the year. Across the region, 48
tenants were searching for at least 50,000 square Land Use Study Area
feet, totaling 19.4 million being actively sought.
The Land Use Study Area accounts for 29% of the
According to CoStar data, Will County’s industrial county’s industrial inventory. This is an increase
inventory grew from 135 million square feet in 2010 from 22% in 2010. The LUSA’s inventory has seen
to 187 million square feet in 2019, a 38% increase massive growth of 82% in 10 years. By the end of
(approximately 52 million square feet). This the third quarter of 2019, this inventory included
averages over 5 million square feet added to the 412 buildings with well over 55 million square feet
market yearly (through Quarter 3) over the course of total.
a decade.
As in the County overall, the LUSA’s vacancy rate
Deliveries are a measure of when buildings under increased sharply from 2016 to 2018 as new space
construction are completed and “delivered” to the was delivered. The rate increased from 5.1% to
market or to a contracted occupant. Deliveries 14.8% in three years as 12 million square feet were
through the third quarter peaked in 2017 with 12 delivered and 6 million were absorbed –
million square feet, approximately twice the approximately 34%. By 2019, deliveries slowed as
amount delivered in 2016 or 2018. Over 6 million new space had yet to fill up. The vacancy rate
square feet were delivered in 2018 and 2019 decreased by 1.8 percentage points over the
through the third quarter. Approximately 4 to 7 previous year to 13.0% at year-end 2019. Charts
million square feet were absorbed (purchased or showing these trends follow.
leased) each year in 2017-2019 through the third
quarter, but this was not enough to keep up with The average industrial rent increased from $3.85
the massive amount of finished construction. per square foot in 2010 to $5.51 in 2019 in Will
County and from $3.71 to $5.75 in the LUSA. This
This led vacancy to grow rapidly to 10.6% in 2018. equates to a 14.8% increase in the LUSA and 11.2%
By 2019, the rate fell below 10% as demand in the County.
continued. The spike in vacancy was due to rapid
growth in inventory that takes time be absorbed.
The market is continuing to absorb large amounts
of space, so developers continue to produce it. The
addition of a handful of buildings can cause a large
increase in the vacancy rate when each building is
1+ million square feet, as is the case in Will County.
21FIGURE 1 – LAND USE STUDY AREA OCCUPIED AND VACANCY INDUSTRIAL BUILDINGS
60
Millions
50
40
30
20
10
0
2010 2011 2012 2013 2014 2015 2016 2017 2018 2019
Occupied Inventory Vacant Inventory
Source: CoStar
FIGURE 2 – LAND USE STUDY AREA INDUSTRIAL DELIVERIES AND ABSORPTION
8 16%
Millions
7 14%
6
12%
5
10%
4
8%
3
6%
2
4%
1
0 2%
-1 2010 2011 2012 2013 2014 2015 2016 2017 2018 2019 0%
SF Delivered Net Absorption Vacant %
Source: CoStar
22FIGURE 3 – WILL COUNTY OCCUPIED AND VACANT INDUSTRIAL BUILDINGS
200
Millions
175
150
125
100
75
50
25
0
2010 2011 2012 2013 2014 2015 2016 2017 2018 2019
Occupied Inventory Vacant Inventory
Source: CoStar
FIGURE 4 – WILL COUNTY INDUSTRIAL DELIVERIES AND ABSORPTION
14 14%
Millions
12 12%
10 10%
8 8%
6 6%
4 4%
2 2%
0 0%
2010 2011 2012 2013 2014 2015 2016 2017 2018 2019
SF Delivered Net Absorption Vacant %
Source: CoStar
23Agricultural Land Valuation distillation of these interviews and our analysis.
According to the Illinois Society of Professional The strongest determinant for the development of
Farm Managers & Rural Appraisers (ISPFMRA), the TDL properties is proximity to I-55 and I-80,
average sale price per acre of farmland of all especially to one or more 4-way interchanges.
qualities in Illinois peaked in 2013 at $6,079- These locations are the "hottest." Companies like
$12,538 per acre for fair to excellent quality Will County for lower real estate taxes and highway
farmland and in 2014 for recreational land at access (especially I-80) while retaining access to
$3,925. Statewide, farmers were 62% of buyers. labor.
The ISPFMRA’s 2018 Illinois Farm Values & Lease More than one mile from an interstate, market
Trends report states that most activity over the last potential declines, prices are lower, the largest
decade in “transitional tracts”, or those being companies begin to fall off, and local companies
converted out of farming, has been “centered near doing smaller "deals" increase. But they do exist,
Elwood’s huge intermodal facility. Sales in the notably along IL-53. Locations over 3 miles from an
$20,000-$40,000 per acre range are the most interstate are far less viable.
common for industrial warehouses. There has been
little activity of bare land being converted to Users with high volume intermodal needs or
residential. Most of the residential building has overweight containers want to be "inside"
been on previously engineered or existing CenterPoint’s intermodal facility. Those focused
developed lots.” These prices are well above the more on regional distribution want to be within 10-
price per acre for farming. 15 miles of the intermodal, though up to 30 miles
could be viable (as an absolute maximum).
Three large transitional sales in 2018 were in Will
County. They were 32 acres at $10,147 per acre, 40 Typical rents range from $3.24 per square foot NNN
acres at $27,500 per acre, and 289 acres at $20,348 (what Target is paying) to $7 per square foot NNN
per acre. These prices make clear the strong for more sophisticated and expensive buildings.
incentive facing farmers considering selling their (NNN or “triple net” means that tenants pay their
land for industrial development. pro rata share of real estate taxes, building
insurance and common area maintenance. In a
Factors Influencing the Industrial Market gross lease, the landlord covers these expenses so
the asking rent is higher, but uncommon in new
Industrial real estate brokers and developers active buildings.)
in Will County at some of the nation's largest
companies expect the current development trends Speculative developers also like Will County
to continue for the foreseeable future – at least 10 because even a vacant building can be sold to an
years (if not longer – some think 20+ years). Will investor, though this could change if investment
County is perhaps the TDL center of the Chicago preferences shift to another asset class.
area, which is one of the nation's hottest industrial
real estate markets. There are relatively few rail users, so highways are
more valuable to more companies – though Elwood
The following market factors represent a and Joliet will strongly attract rail users compared
24to Cook and DuPage counties. Most land along surrounding land uses.
these corridors is already slated for development or
is otherwise not in "play" e.g. developers "sitting" Some companies need an intermodal location (i.e.
on it, restrictive zoning, etc. To be clear, much of CenterPoint) while others do not. Typical absorption
this land is still vacant in the LUSA and could take a at CenterPoint is 1-1.3 million square feet per year.
decade to fill, perhaps longer depending on the According to the developer, the park has
economy and barriers to developing other land. By approximately 10 years of supply remaining (1,000
comparison, in northern Will County acres that could accommodate 13-15 million
(Bolingbrook/Romeoville), land for industry is closer square feet more).
to reaching true build-out.
Some of the available land for development is
For other developers looking to enter the market – currently used for container storage, while other
those who don't already control existing parks or parcels are not on the market. This allows some
land planned for industrial – it is difficult to find the containers to stay on-site, but most are still
50-100-acre sites required for these large leaving.
buildings. This is why some developers are now
pushing to develop land farther from highways and Drayage costs make locations farther away more
not served by rail, such as the area east of IL-53. expensive for companies using the intermodal
They are willing to take big risks on resident heavily (perhaps 10-15% of users). For companies
opposition and on acquiring the intermodal access without heavy intermodal use or overweight
still needed to make this viable. containers, some say the rent is similar vs. other
locations, while others see a 10-15% rent premium
With intermodal access, large expanses of this for locating at the intermodals.
"south central" Will County area should be
marketable for industry over the next decade. Regardless, there are few incentives for light users
Without intermodal access, significant industrial to locate specifically at the intermodal, with
development east of IL-53 is not currently viable as increased traffic and more access restrictions
drives to the intermodals approach 20 minutes. The presenting a disincentive for those seeking
route to the intermodals would be circuitous, and primarily regional distribution. Drayage costs for
existing competitive sites in the LUSA have superior truckloads increase for companies not located at
highway access. As more land fills up and the intermodals – approximately $100 per
expectations around highway proximity shift as a container. However, for companies that are
result, it is possible that in 10-20 years this minimally dependent on rail, these costs are a
calculation changes. small factor in locational decisions.
Smaller development could still occur east of IL-53 An additional cost of being farther from the
without intermodal access, since companies intermodals is the time value of trucks waiting in
seeking regional distribution have more flexibility traffic congestion. For example, Walmart and Home
with interstate proximity and local highways. Even Depot have buildings at the intermodals because
if large scale development does not occur, it will be they have a large volume of containers coming
important to implement a land use policy that straight from Los Angeles by train. Others include
avoids scattershot development, which can impact Harbor Freight and Saddle Creek (a large third party
25logistics or 3PL company). amenities for workers and drivers.
From a regional distribution standpoint (moving Sites in Grundy County or those somewhat farther
products from warehouse to store to customer), south along I-55 are near enough for regional
highway proximity is much more important than distribution, and buildings have dramatically more
intermodal access. Therefore, CenterPoint’s trailer parking for the same price, so the economics
available land does not need to be absorbed by the may be similar. This makes more distant areas
market before other industrial land will be along the highways competitive for some users,
developed. If development occurs east of IL-53 with though Grundy County is still considered a different
an intermodal connection, such development will market. However, these locations may still be too
still need to compete with CenterPoint on rates and far for attracting enough labor.
amenities.
Some companies' locational decisions come down
In the event a new CSX intermodal were to be built to the particularities of their supply chain and
in Crete in southeastern Will County (locally business strategy. These approaches are
approved, but now on hold), it should not impact proprietary and can be hard to predict, but they
the UP and BNSF intermodals in the LUSA much factor in (for example):
because CSX primarily serves the East Coast, while
these other two intermodals mostly serve the West Labor
Coast and Texas. Transportation
Sometimes neighbors
For many companies, labor availability remains a Need for a pad-ready site with utilities vs.
strong motivation to locate in the north part of the tolerance for raw land development
LUSA, if not the more densely developed Preference for a free-standing facility vs.
communities in northern Will County. The area most locating in an industrial park.
favorable for attracting labor is now north of Bluff
Road to I-80 near I-55. (Availability of labor also The market in this subregion is for large buildings,
drives companies to stay in Cook County despite not small "incubators," which are expensive to
higher taxes, though lower taxes in Will are build on a per square foot basis. In Will County,
attractive for investors.) building sizes, ceiling heights, and trailer parking
have continued to grow. There is reportedly a
Some large companies may have dual facilities, shortage of "small" buildings with closer to 100,000
with activities less dependent on labor farther from square feet and high ceilings (24'). Fortune 1000
the more populous communities and other companies have been moving forward with
operations closer to the labor supply. For example, 350,000-650,000 square foot buildings or larger,
Amazon has both extremely large warehouses and but medium-sized companies have been more
smaller distribution facilities (250,000 square foot) hesitant.
throughout the region.
In neighboring Cook County and Northwest Indiana,
Elion in Wilmington is still seen as rather far for there has been less new construction in recent
labor, though it benefits from being on I-55. This is decades so there may be fewer options between a
one reason the developer emphasizes on-site very old building and a brand new one. Northwest
26Indiana tends to have lower fees and lower worker While many companies have wanted the option
compensation costs (and lower taxes than Cook but of a site-level rail connection, many who have it
not necessarily Will). But the location near highway reportedly do not use it. This is distinct from
and rail in Will County is a strong attractor. intermodals, which connect rail and road.
Varying opinions suggest that effectively
Assorted other developing industry needs and connecting rail-using companies with rail-
trends include: served buildings is difficult in Will County.
Demand for more trailer storage, more parking, Opportunity Area Market Factors for Near Term
and larger sites for the same sized buildings to Change
accommodate these.
Freestanding trailer parking on "excess land" is Area 1
a growing “asset class” due to new driver This area is bounded by Laraway Road on the north,
regulations dictating daily and monthly Manhattan Road on the south, and IL-53 on the
stopping times. These need 3-5 acres. Rates west and extends just east of US-52. It includes the
may be $20-$30/day or $350/month per truck. industrial anchors IKEA, Amazon, and the existing
A high tax on trailer storage would stop this Laraway Crossings industrial park at the north end.
activity. At the northeast corner of Laraway Road and IL-53,
TDL growth is driving growth in pallet the park has 362 acres with a total buildout
companies, though this has historically been a potential of 7 buildings and 5 million square feet. It
strength of Chicago’s south suburbs more than should have land still available despite recent
the southwest ones. development. Chicagoland Speedway and Route 66
It may be easier to address driver shortages, Raceway are also economic anchors.
fuel price fluctuations and other unknowns by
locating at CenterPoint, since transportation While this location does not front on an interstate,
costs are a large part of the total "bill". Any it still offers good access to I-80 and IL-53 for
greater predictability could become more companies to distribute goods regionally. It also
valuable during and after COVID-19. benefits from proximity to labor in the northern
Higher buildings are more expensive both in portion of the LUSA.
building costs and in labor. Buildings with clear
heights of 36-40' required higher skilled forklift Amazon occupies two buildings in Laraway
operators and come with expensive fire Crossings. It opened its the first fulfillment center
regulations. The benefits are not there for every here in October 2015. The 500,000 square foot
company or in more distant locations with a facility receives incoming orders and processes
smaller labor pool. them, shipping out products in the region.
Verticality (multiple stories) is still rare and not
being pursued with any amount of consistency The second began as an almost 750,00 square foot
to impact land use except in dense urban speculative warehouse developed by Hillwood
locations. Investment Properties, expandable by another
Increasing automation could make farther 312,000 square feet. This is a “high cube” building
locations more viable if it reduces labor with 36-foot clear ceiling heights, deep truck
reliance. courts, 76 high dock doors (expandable to 169),
27drive-in doors, and parking for 154 cars and 72 200,000 square feet of expansion, and another 37
trailers, also expandable. It also has advanced acres of land for more development. The park also
lighting, an ESFR sprinkler system, a reinforced has expansion space for 133 more trailer parking
roof, heavy dock equipment, and high performance spots. Building features are like those noted above
electrical. This feature list is typical of the qualities in the Amazon facility.
that companies seek in new industrial buildings.
Area 1 is a proven location for industry that makes
Amazon is also opening another 1 million square sense for future adjacent development as land
foot fulfillment center in Channahon at Venture One becomes available. Focus on this for near term
Real Estate’s Crossroads 55 industrial park. change acknowledges this momentum and creates
Reportedly, this facility will focus specifically on an opportunity for improvement of the I-80
“pick, pack, and ship” of large items. The company interchange at IL-53, which brokers call
also operates a 750,000 square foot fulfillment problematic and very dangerous.
center in Romeoville in the Windham Lakes
Business Park. Area 2
In contrast to the closer-in, multi-park character of
In 2015, IKEA announced plans to build their first Area 1, the second area for near term change is at
1.4 million square foot Midwest distribution center the far southwest section of the LUSA on the west
on a 72-acre site in Laraway Crossings. Within 4 side of I-55 north of Wilmington-Peotone Road. It is
months, the company was planning a second currently viewed as far from labor. However, its I-55
center immediately west of the first. These opened location is attractive in the market and it boasts
in 2017 and 2018. frontage along the BNSF’s Transcontinental
Mainline that runs from Los Angeles to Chicago,
The newest building garners special attention for along with convenient intermodal access.
unique features that are not becoming standard at
this point, but could in the future, though some are It also offers plenty of entitled land on a full
tailored to IKEA’s needs. These include a fully interchange at Lorenzo Road. It makes sense from a
automatic storage “silo”, vacuum cranes, flat pallet planning standpoint to also focus efforts on a more
boards that stay inside the facility for reuse, and a distant location with no shortage of master planned
huge 9,000 square foot solar array on the roof sites for 1+ million square foot buildings. Such a
(spread over almost 269,000 square feet). focus could prevent random development on non-
contiguous greenfields. This is the Elion Logistics
Based on these locations, both companies probably Park 55, formerly called RidgePort Logistics Center.
look for “pad-ready” sites with entitlements and
utilities in place with good labor access (despite an Elion Partners purchased the park in summer 2019
increasing focus on automation). and immediately announced a $2 billion expansion
plan, pushing the total planned to 30+ million
Adjacent to Laraway Crossings is Core5 Logistics square feet of industrial and commercial space
Center at I-80 Joliet, a newer industrial park with an (mostly big box industrial). All told, the park has
occupied 737,000 square foot building, another 1+ 1,500 acres of developable land. The current spec
million square foot speculative building on the building on the market at 30260 Graaskamp
market (almost 60 acres) with space for almost Boulevard is 811,000 square feet with 211,000
28more for future expansion (1.2 million total). as Area 1, somewhat better proximity to I-55, and of
course is near the intermodal.
Occupants include Michelin, Post, Batory Foods,
Lineage logistics, PURIS, a non-GMO organic pea Area 4
protein, starch, and fiber producer, and commercial The area west of the UP intermodal to the Des
users Mobil, TA, Petro, Shell, and Knights Inn. Plaines River has the same virtue of intermodal
Elion is emphasizing a range of amenities given the proximity with even better proximity to I-80 and I-
distance it requires workers to travel, items it 55, including the desirable intersection between
claims “[focus on] the well-being of truck and the two.
warehouse employees,” helping them to “restore,
reenergize, nourish, and explore.” The referenced Area 5
amenities are those typical of a full-featured travel While some think of I-80 as the primary interstate, a
plaza with services for long haul truck drivers, location on I-55 is desirable from a labor attraction
including showers, a store, a restaurant, and more. standpoint. Area 5 is west of Elwood straddling I-55
140 acres of retail services are planned, though this and is also near the intermodals.
total seems to include areas for car and truck
parking. Phase 1 is planned to include more Area 6
restaurants, a hotel, healthcare, a fitness center, a I-80 frontage is a huge benefit for industry,
barber shop, pet care, and a chapel. especially so close to the I-55 interchange. This
area is between I-80 and the Des Plaines River and
The roads are expandable up to four lanes, and includes or is adjacent to multiple industrial park
there are first responders (fire and police) and a anchors.
helipad. The property also includes 40 acres of
wetlands with seating and a path. $140 million in Area 7
TIF enables the developer to lower pass-through This is west of I-55 in Channahon and Minooka and
costs to tenants, allowing the park to be is an attractive area for industry with excellent
competitive with Indiana but also likely meant to proximity to the I-80 interchange, good intermodal
attract users who might otherwise seek a location access and frontage on I-55.
farther north in the county.
Area 8
With TIF investment and the focus on providing This area is slightly farther west along I-80 in
amenities in addition to purely industrial buildings, Minooka so is less in demand but can
it makes also makes sense to focus planning accommodate large buildings and trailer parking
efforts here so that the public investment provides with highly desirable I-80 frontage very close to I-
the most incremental value for the TIF. 55. This is a good opportunity for later development
to retain immediate highway access and avoid
Other Major Opportunity Areas disparate greenfield developments to the east.
Area 3 Maps follow showing the Major Opportunity Areas
The area east of the UP intermodal west of IL-53 once again and recent business expansions and
between Laraway Road and Mississippi Avenue will ongoing industrial developments in and near the
be marketable since it has similar proximity to I-80 LUSA and these Major Opportunity Areas.
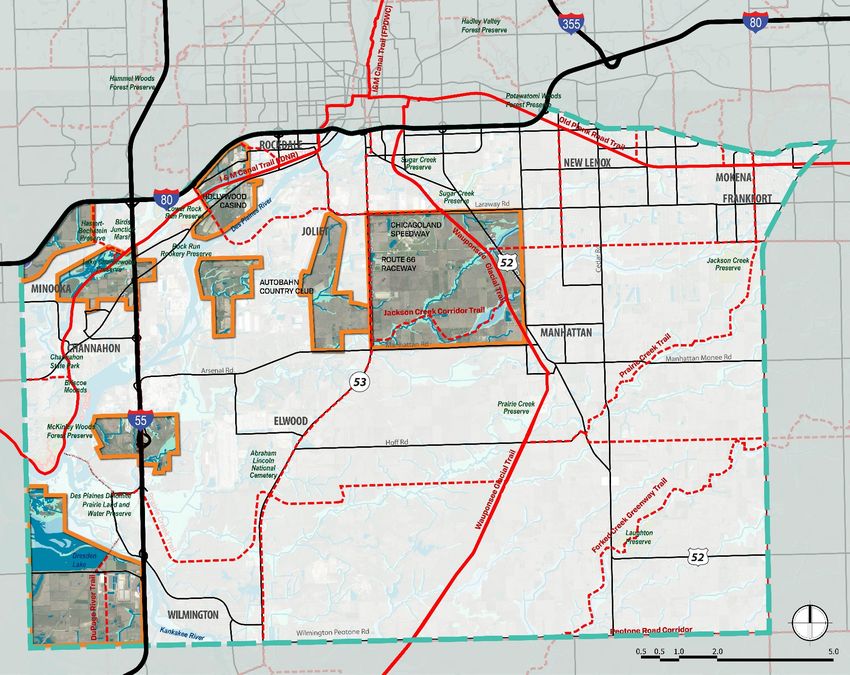
29Opportunity Areas: Existing Land Uses and Acreage REVISED 3-27-20
MAJOR
OPPORTUNITY OPPORTUNITY AREAS 1
AREA THROUGH 6 ARE NEAR
Approx. Acreage of EXISTING INTERMODAL
Opportunity Areas FACILITIES AND MAJOR
1. 8,877 AC, 14 SQ MI INDUSTRIAL ANCHORS.
2. 5,530 AC, 8.6 SQ MI VACANT, INFILL AND
3. 1,990 AC, 3.0 SQ MI FARMED PARCELS IN
4. 1,229 AC, 2.0 SQ MI THESE AREAS OFFER
5. 1,550 AC, 2.4 SQ MI
6. 1,586 AC, 2.5 SQ MI
SIGNIFICANT
7. 1,674 AC, 2.4 SQ MI OPPORTUNITIES FOR
8. 936 AC, 1.5 SQ MI
6 NEW DEVELOPMENT.
OPPORTUNITY AREAS 7
& 8 ARE PRIMARILY
8 FARMLAND TODAY AND
1
OFFER OPPORTUNITIES
TO ATTRACT NEW
7 4 DEVELOPMENT ALONG I-
80 AND I-55.
3
RESIDENTIAL
5 COMMERCIAL
INDUSTRIAL/UTILITY
OPEN SPACE
AGRICULTURAL
CIVIC/INSTITUTIONAL
VACANT
Source: Ginkgo Planning
2
& Design
Data sources: CMAP Land Use, 2015; FPDWC, 2019; Will County GIS, 2019. Note: The CMAP 2015 Land Use Inventory data used in this analysis is draft data.Recent/Planned Industrial Expansions & Developments In/Near the LUSA
Rock Run Business Park Supreme Lobster/Joliet Cold Storage
McWayne
GP Transco Quad Plus
Walmart (distribution)
NFI Industries (Laraway)
Accuride
Midwest Industrial Funds
TTX
Novo Building Products PrimeSource
Amazon (Crossroads 55) UNIS
NFI Industries
Target (distribution)
Touchpoint Logistics
Midwest Warehouse & Distribution
Sources: Will County CED, LoopNet, Kretchmer Associates 31HOUSING OVERVIEW AND FOR-SALE Joliet accounting for 58% of these. Elwood issued
only 6 permits for single-family houses during this
HOUSING MARKET
period. Construction permits picked up in 2013 and
have increased steadily since.
Housing Tenure
Owner-Occupied Housing and Affordability
As of the 2014-2018 period, the American
Community Survey (ACS) estimates a very low
According to data from the ACS, as of 2014-2018,
vacancy rate of 4.2% overall and only 2.4% for
71% of the owner-occupied housing in the LUSA
rental units. As will be discussed below, there has
had a mortgage with a median monthly cost of
been very little rental construction in the LUSA in
$1,827. This was 2.4 times higher than the $774
decades. The overwhelming majority of housing
median monthly cost for owners without a
units are owner-occupied (82%). The ownership
mortgage. Affordability is a concern among those
share for those under 65 years is similar to this,
with a mortgage, as 26% were paying more than the
while it is higher for those 65+ (85%), which is
recommended 30% of income. Only 13% of those
common. Seniors are more likely to be homeowners
without a mortgage had the same cost burden.
as they have lived in the area for a long time and
purchased when prices were lower. Many younger
Home Sales
households have difficulty saving for a down
payment given increasing home prices and student
Kretchmer Associates obtained and analyzed data
debt.
from the Multiple Listing Service (MLS) on closed
home sales between 2015 and 2019 in the
Housing Stock Size and Age
municipalities in the Land Use Study Area. Table 14
shows the number of sales, average price, market
Table 11 shows the characteristics of the housing
time, home size, year built and property taxes for
stock. Over 89% of the housing is single-family
the ten area communities. A map showing
detached and attached. Multi-family buildings with
concentrations of these sales also follows.
5+ units account for only 5% of all housing. The
Land Use Study Area’s housing stock is relatively
Over this five-year period, there were 5,000 sales
new, with 29% built since 2000, 31% in the 1980s
with a weighted average price of $255,600 and a
and 1990s, 23% in the 1960s and 1970s, and 17%
median price of $232,900. The communities with
before 1960. Almost 1,100 units were added since
the most sales during this period were New Lenox,
2010, compared to just over 6,700 between 2010
Manhattan, Channahon, and Frankfort. The highest
and 2009.
average prices were in Frankfort and Mokena (at
$430,000 and $434,000), while the least expensive
Residential Building Permits
were in Rockdale and Joliet ($113,000 and
$118,000). The average age of homes sold was 1991
The graphs below show single-family and
and the average size was 1,932 square feet.
multifamily building permits in four LUSA
Property taxes averaged 2.1% of the sales price.
municipalities between 2009 and 2018. Joliet had
the highest number of total permits (1,372),
followed by Manhattan (493) and Channahon (366).
Only 12% of the 2,237 units were multifamily, with
32You can also read