Mozambique Economic and Financial Research - Banco BPI
←
→
Page content transcription
If your browser does not render page correctly, please read the page content below
Economic and Financial Research
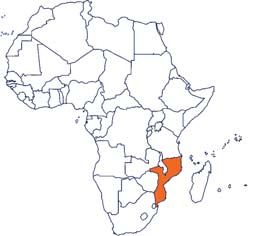
Mozambique
January 2016
CHALLENGES AHEAD FOR 2016
Economic activity continued to decelerate, with a cumulative GDP growth rate of 6.1% y/y for the first three
quarters of 2015. As a result, the annual growth rate for 2015 should fall below the average growth rate
performed over the past years of around 7%, mainly reflecting a deceleration in foreign investment inflows, a
tighter fiscal policy, lower external receipts (due to falling commodity prices) and the subsequent devaluation
of the metical.
Despite the budget deficit slippage in 2014, the Executive remains committed to ensuring a steady adjust-
ment of the public finances. The 2015 public deficit should have declined significantly compared with the
preceding year, and the fiscal adjustment should continue in 2016, albeit at a smaller pace. Still, public debt
is likely to remain on the rise, at a time when the public debt ratio is already beyond a prudent level. Such
concerns related to the sustainability of public debt, as well as the trend of economic growth deceleration,
were reflected in several international rating downgrades.
The external accounts deteriorated in 2015, due to slower megaproject activity, a decline in grants and a
reduction of foreign direct investment. The current lower commodity prices continued to hurt export growth
while goods imports outside of the megaprojects' sector have remained resilient. On the other hand, lower
imports of services and goods related to megaprojects confirm the deceleration reported in this sector. While
the current account deficit for 2014 decreased in comparison to the preceding year, the deficit actually de-
teriorated when removing the effects from the megaprojects.
The exchange rate had remained relatively stable over the past few years, but the pressure exerted on the
balance of payments in 2015 has resulted in a strong devaluation of the local currency. The Metical has
gradually devalued throughout 2015 (with a more abrupt drop in November), which resulted in a loss of
around 50% of its value since the start of the year, this despite attempts by the Central Bank to alleviate the
pressure on the exchange rate. In this context, the stock of international reserves also suffered a sizeable
deterioration, from US 2.88 billion in late 2014 to USD 1.97 billion by November 2015. Excluding megapro-
jects, the coverage ratio of imports of goods and services in 2015 should fall below a 4 months threshold,
which is considered an adequate level to ensure protection from possible external shocks.
The effects of this exchange rate deterioration have already had a significant impact on the inflation rate, a
scenario that is likely to continue throughout 2016. Anticipating this, the Bank of Mozambique immediately
adopted a tighter monetary policy, and decided to raise the main monetary policy interest rates, as well
as the required reserves ratio. Nevertheless, these efforts were not sufficient to contain pressure in prices,
with the inflation rate reaching a double-digit level in the last month of the year (10.55%). In this context,
we believe that the Central Bank should go beyond a tighter monetary policy and adopt measures aimed at
restoring exchange rate stability, which could possibly involve restricting demand for foreign currencies.
Paula Gonçalves Carvalho
paula.goncalves.carvalho@bancobpi.pt
Luísa Teixeira Felino
luisa.teixeira.felino@bancobpi.pt
Vânia Patrícia Duarte
vania.patrícia.duarte@bancobpi.ptINDEX Pág.
MOZAMBIQUE
DEVELOPMENTS IN THE ECONOMIC ACTIVITY 03
PUBLIC FINANCES 06
EXTERNAL SECTOR 10
EXCHANGE RATE POLICY 12
MONETARY POLICY AND INFLATION 15
DEVELOPMENTS IN THE INTERNATIONAL
COMMODITY MARKETS 16
Database 18
Economic and Financial Research
Paula Gonçalves Carvalho Chief Economist
Teresa Gil Pinheiro
Luísa Teixeira Felino
Vânia Patrícia Duarte
Technical Analysis
Agostinho Leal Alves
Tel.: 351 21 310 11 86 Fax: 351 21 353 56 94
Email: deef@bancobpi.pt http://www.bancobpi.pt
http://www.bpiinvestimentos.pt/Research http: www.bfa.aoE.E.F. - Mozambique * January 2016
DEVELOPMENTS IN THE ECONOMIC ACTIVITY
During the second half of 2014, Mozambique begun Contributions for the GDP growth rate
showing signs of an economic activity slowdown, which
saw a deceleration of growth from 9.0% y/y in the second (contributions for GDP growth)
quarter to 7.8% and 5.6% in the 3Q and 4Q, respectively.
Even so, according to the preliminary data published by the 40.0% 8.0%
National Statistics Office (INE), economic growth for 2014 as 30.0%
6.0%
a whole still recorded a robust 7.4%, a result mainly owed 20.0%
10.0%
to a good performance by the mining industry. On a similar 4.0%
0.0%
note, the public sector performed positively, supporting the
-10.0% 2.0%
economic activity in some strategically important sectors,
-20.0%
such as construction.
-30.0% 0.0%
2010 2011 2012 2013 2014
According to the preliminary data for the first two
quarters of 2015, this trend of economic activity Private Consumption Public Consumption
Investment Net Exports
deceleration in Mozambique kept throughout the year.
GDP growth rate (RHS) Source: INE; BPI calc.
Following a 6.9% y/y growth rate for the first quarter of
2015, data published by INE shows that the economic activity
decelerated to 5.7% y/y during the 2Q. The floods, which
fustigated the country during the early months, did not have
the negative impact on the agricultural activity as initially
foreseen, with the sector continuing to record favourable GDP growth
growth figures. At the same time, the mining activity expanded
considerably, despite the current context of weak commodity (yoy%)
external demand and the logistical constraints with the outflow 18%
of goods (such as in the case of coal). Simultaneously, we note 16%
the recovery of the manufacturing activity, which contributed 14%
12%
to strong growth rates in the secondary sector. Regarding
10% 7.2% 7.4%
the tertiary sector, we highlight the performance of financial 8% 7.1%
services, which contracted in comparison to the 2Q of 2014. 6%
This performance ended up offsetting the gains made in the 4%
2%
transportation and communication sectors. Preliminary data 0%
for the 3Q of 2015 place economic growth at 5.9% y/y,
II
IV
II
IV
II
IV
II
I
I
III
I
III
I
III
III
which means that GDP growth for the year is unlikely 2012 2013 2014 2015
to meet the Government estimate (7.5%, according to
yoy growth Annual Growth Rate
the State Budget 2016). On a cumulative basis, GDP Source: INE
for the first three quarters of 2015 recorded a 6.1%
growth rate, according to the INE.
Mozambique is currently constrained by several
restrictions, which hinder the economy’s ability to
meet the growth rate figures recorded in past years.
One such constraint is a strong devaluation of the GDP growth by sectors
metical against both the dollar and other foreign currencies.
Indeed, considering that a major part of the domestic debt (yoy%)
is denominated in foreign currency (84% of total debt, in 16%
2014), the debt burden is expected to increase with the 14%
currency depreciation. While, in theory, the depreciation of 12%
10%
the domestic currency can stimulate the export activity, the 8%
current excessive supply of commodities, as well as the major 6%
4%
drops in commodity prices, both negate Mozambique’s ability 2%
to leverage benefits from this trend of currency devaluation. 0%
Another constraint lies in the deceleration of the foreign -2%-4%
direct investment which, over the last few years, has been I II III IV I II III IV I II III
a substantial contribution towards strong growth rates and 2013 2014 2015
exchange rate stability. More so, external factors such as
Primary Sector Secondary Sector Terciary Sector
the deceleration of the Chinese economy, or the sizeable Source: INE
3E.E.F. - Mozambique * January 2016
DEVELOPMENTS IN THE ECONOMIC ACTIVITY
drop in commodity prices in the international markets GDP composition (Q2 2015)
(especially aluminium and coal), with the subsequent
drop in foreign reserves flowing into the country,
all serve to exacerbate the country’s vulnerable economic Agric. &
Taxes
position. 10% Fish.
22%
Other
Confidence Indicators Services Extract.Ind.
21% 4%
The economic climate indicator (ICE, original acronym),
Financial Manuf. Ind.
which gathers confidence indicators from entrepreneurs Services 9%
in multiple sectors, recorded a slight upwards trend 6%
during the 3Q of 2015. This rebound in business confidence Elect. &
Trans.Com. Water
is primarily owed to a strong outlook for future job creation, 12% 3%
even if confidence in future demand has proved less optimistic. Com.Serv.
Const.
2%
Despite this rebound, we also note some pessimism related to 11%
Source: INE; BPI calc.
the development of prices, which have kept on a downward
trend for two consecutive quarters, driven by deflationary
expectations from commerce sector, housing, restaurants
and similar.
On a sectorial basis, this slightly more favourable Economic Climate Indicator
outlook is mainly owed to increased confidence levels in
both the manufacturing and transports sectors. For the (index)
former, all business confidence variables record improvements
125
from the preceding quarter, with the most substantial
improvements being recorded in the job creation and business
115
volume outlooks. Even so, survey respondents note that tough
competition, lack of raw materials and equipment obsolesce
105
continue to be the main factors hindering their activity. The
transportation sector benefited from a significant increase in
business volume and the outlook for short-term job creation, 95
which thus lead to an improved outlook on future business.
Despite this, the transports sector continues to be hinder by 85
Nov-10 Sep-11 Jul-12 May-13 Mar-14 Jan-15 Nov-15
high operational costs, a highly competitive market and lack
Employment Expectations Demand Expectations
of demand. Prices Expectations Economic Climate
Source: INE
Growth outlook
The Executive expects GDP to grow at a rate of 7.5% in 2015, followed by a deceleration to 7.0% in 2016,
according to its 2016 State Budget proposal. The economic activity is expected to benefit from increased productivity
in the agricultural sector, coal production (which will benefit from coal shipments from Moatize, thru the new railway and to
the new coal deck in Nacala-a-Velha, as well as the re-opening of the Sena train path, currently undergoing renovations),
as well as the benefits from the new base of logistics located in Pemba.
The IMF has lowered its GDP growth forecast for 2015, arguing that while the economic activity remained solid,
new challenges arouse that may have hindered the rate of growth. Even so, the IMF forecasts a growth rate of 6.3%
for 2015, for which the main contributors were the transportation, communication and services sectors. The IMF believes
that, while the medium-term outlook remains positive, on the short-term, Mozambique faces serious external challenges
related to the lower commodity prices in practice, the lower growth rates reported by its main trade partners and the delays
in investments related to liquefied natural gas (LNG) project. For 2016, the IMF also lowered its GDP growth forecast from
8.2% to 6.5%, also expecting a medium-term acceleration towards figures between 7.5% and 8%, due to investments in
natural gas projects in the Rovuma basin as well as increased coal production. Nevertheless, according to the Standard
Bank, the economic growth in 2016 may drop below 6%, in case of delays in any of these projects.
Despite the challenges Mozambique faces, the international rating agencies continue to expect favourable
growth rates in 2016. Moody’s sees the country’s growth outlook positive for the medium term, driven by the country’s
4E.E.F. - Mozambique * January 2016
DEVELOPMENTS IN THE ECONOMIC ACTIVITY
substantial amount of natural resources, while nevertheless noting the small size of the Mozambican economy, its lack of
diversification (agriculture continues to represent a third of the GDP and employ 80% of the workforce), infrastructure
bottlenecks and low income per capita. As such, Moody’s expects the economy to grow 6.7% in 2015, followed by a stronger
7.5% in the current year.
The rating agency Fitch expects an average growth rate of 6.6% between 2015 and 2017, stating that the
medium-term economic outlook remains positive, supported by strong investment growth, expansive workforce
and the ongoing development of its ample natural gas resources. According to the agency, weak performance in
the mining sector is partially offset by strong growth in agriculture, transportation, utilities and services, which are likely
to continue to benefit from macroeconomic stability.
Standard & Poor’s expects a growth rate of 7.0% in 2015, followed by a stronger 7.5% reading in 2016, noting,
as did the other agencies, that the ongoing investments in projects related to the mining sector are likely to spur economic
growth over the following years.
Forecasts for 2016
GDP growth rate Inflation Rate
2015 2016 2017 2015 2016 2017
Executive 7.5 7.0 - 5.1 5.6 -
IMF 6.3 6.5 7.2 5.1 5.6 5.6
Moody's 6.7 7.5 - 5.0 5.6 -
Standard&Poor's 7.0 7.5 7.5 5.0 5.5 5.5
Fitch (period average) 6.6 - - - 5.0 -
Source: SB 2016, IMF, Moody's, Standard&Poor's and Fitch
Vânia Patrícia Duarte
5E.E.F. - Mozambique * January 2016
PUBLIC FINANCES
2015 Budget Execution (January-September)
The budget execution report for the January-September period of 2015, notes that the budgeted revenues
covered operating expenditures, but the capital expenditures recorded a poor execution rate.
On the revenue side, the rate of execution was 69%, down by 7.1 percentage points from the previous year’s figure. The
extraordinary revenues from capital gains recorded in 2014 explained this performance. It is important to highlight that the
percentage of the capital revenues earned in 2015 was 47%, significantly down from the 70% recorded for the same period
of the preceding year. This sizeable drop is explained by a significant decrease in the amount of dividends (65% less than
in the same period of 2014), reflecting the fact that the Government received no dividends from the Bank of Mozambique,
as well as lower revenues from the Caminhos de Ferro de Moçambique. Considering the database until September, it is
likely that revenue will amount to roughly 25% of GDP, less that the preceding year (around 29%).
The megaprojects’ contribution for total revenue
Contribution of Megaprojects to the fiscal revenues
improved over the first nine months of 2015, accounting
for 6.9% of the total revenue. Projects related to oil (million Meticals)
Jan-Sep Jan-Sep Weight Change
exploitation recorded the largest contribution, with an increase 2014 2015
of 12% from the same period of 2014. The energy production Energy production 1,730.5 1,912.4 25% 10.5%
sector also recorded a commendable performance and Oil exploitation 3,318.8 3,702.3 49% 11.6%
accounts for nearly a quarter of all megaprojects’ contributions Mineral resources exploitation 1,695.7 1,466.9 19% -13.5%
Other 418.4 529.7 7% 26.6%
for total revenue.
Total 7,163.4 7,611.4 100% 6.3%
Contribution of Megaprojects, 6.2% 6.9% - -
On the expenditure side, the budget execution between in % of total revenue
January and September of 2015 was similar to the preceding Source: National Budget Directorate.
year. While the amount of operating expenditure incurred
exceed the previous year’s figures, capital expenditure execution fell short of 2014 levels, a performance explained
by the late approval of the State Budget for 2015, which hindered the implementation in most investment projects,
the negative impact from the flooding season and the weaker disbursement of grants. Current expenditure execution
exceeded the figures for the same period of 2014, due to increased staff costs (due to the recruitment of new workers
for the education and healthcare sectors), payments of debt and increased payments of transfers (namely those
benefiting disadvantaged households). By annualizing the data recorded until September, we expect expenditure for
the year to amount to roughly 30% of GDP, down from 43% in 2014. Notwithstanding, it is important to note that
2014 also saw a sizeable increase in current expenditures related to non-recurring events, namely the incorporation
of the quasi-fiscal EMATUM operations (amounting to 2.8% of GDP, according to the IMF), as well as the expenditure
related to the general elections (0.6% of GDP).
In conclusion, according to the data published by Amortization of EMATUM's bond until maturity
the National Budget Directorate, the budget deficit
(before grants) amounted to Mt 24.7 billion for the (% GDP)
first nine months of 2015, down to Mt 10.8 billion when
including grants. It appears that the overall balance 0.9%
0.8%
for 2015 is likely to fall well below the 2014 deficit,
0.7%
which reflects the Government’s pledge to adjust public
0.6%
finances. According to the IMF, the deficit before grants
0.5%
in 2015 is likely to amount to 11.4% of GDP (-15.4%
0.4%
of GDP in 2014), down to -6.5% of GDP when including
0.3%
grants (-10.4% in 2014).
0.2%
0.1%
The Executive placed the first payment related to
0.0%
the bonds issued by the public company EMATUM. 2015 2016 2017 2018 2019 2020
The payment, made last September, amounts to USD 104 Source: Moody's; IMF; BPI calc.
million, of which USD 77 million are capital amortisation, and
the remainder USD 27 million are interests. This operation signalled the Government’s willingness to honour its financial
obligations, a move that was welcomed by several international organizations.
6E.E.F. - Mozambique * January 2016
PUBLIC FINANCES
State Budget 2016
According to the State Budget proposal for 2016, the budget deficit is expected to reach 10.2% of GDP before
grants, and 6.6% of GDP when including grants. Note that these figures are larger than the IMF estimates, who
expects that the current trajectory of deficit reduction will continue throughout 2016, anticipating -8.9% and
-5.5% of GDP, before and after grants, respectively. In drafting its State Budget, the Government assumed a
real growth rate of 7.0% and an average annual inflation rate of 5.6% for 2016.
The ratio of total revenues as a percentage of GDP is expected to continue deteriorating throughout 2016, according to the
official forecasts, who expected this figure to drop to 26% of GDP in 2015. Notwithstanding, we expect a 10% increase in
the collection of revenues, with tax revenue, particularly taxes on goods and services, continuing to represent the largest
part of the collected amount. Grants are expected to increase in 2016 and amount 3.6% of GDP, although its ratio will
remain below previous years (3.9% in 2014).
Regarding expenditures, the budget proposal calls for a 9% increase in total expenditure for 2016, even though its ratio as
a percentage of GDP is likely to decrease. Current expenditures are likely to record significant increases, in line with salary
increases for civil service employees and the developments in several key sectors (education, healthcare and defence),
as well as a substantial increase in debt servicing charges (namely interest payments on domestic securities, as well as
interest payments on external debt related to infrastructure investments).
On a sectorial basis, education, healthcare and infrastructure (primarily roads) remain the main recipients on budget
expenditures, accounting for over half the budgeted expenditure for 2016.
Budget Execution
(million Meticals)
2015
Exec. 2014 2016 SB
SB Exec. Jan-Set.
Total Revenues 156,336 160,708 110,440 176,409
Tax revenue 135,085 133,009 93,551 151,433
Nontax revenue 9,666 11,360 8,547 10,240
Capital revenue 2,887 3,187 1,505 3,187
Other 8,698 13,151 6,838 11,549
Grants 24,106 20,464 13,889 24,800
Total Revenues and Grants 180,442 181,172 124,329 201,209
Current Expenditure 118,470 120,352 91,504 136,159
Compensation to employees 59,831 64,217 50,710 71,308
Goods and services 26,038 24,679 17,152 28,966
Interest on public debt 5,193 6,923 5,549 12,500
Current Transfers 18,333 19,400 15,809 19,297
Subsidies 2,671 3,157 1,579 2,121
Other 6,404 202 18 1,967
Capital Expenditure 87,037 83,180 30,972 83,866
Domestically Financed 45,375 44,881 21,364 41,339
Externally Financed 41,662 38,298 9,608 42,527
Financial Operations 21,543 22,894 12,676 26,046
Total Expenditure 227,049 226,425 135,152 246,070
Overall Balance (before grants) -70,713 -65,717 -24,712 -69,661
% GDP -13.3% -11.0% - -10.2%
Overall Balance (after grants) -46,607 -45,254 -10,823 -44,861
% GDP -8.8% -7.6% - -6.6%
Source: National Budget Directorate; BPI calc.
Public Debt
According to the IMF, maintaining a rigorous tax policy through prudent management of debt will be essential, in order
to guarantee Mozambique’s medium-term public debt sustainability. According to the data published by the organization,
the public debt is expected to expand from 56.6% in 2014 to 73.6% in 2015. For 2016, debt is anticipated to decrease to
69.5% of GDP.
7E.E.F. - Mozambique * January 2016
PUBLIC FINANCES
The IMF’s external debt sustainability analysis points to
a significant rise during this decade, which is primarily Public Debt in Mozambique
owed to private sector investment in the natural gas (% GDP)
sector. By 2020, total external debt (both public and private) 2011 2012 2013 2014 2015 2016 2017
is expected to reach 188.7% of GDP, two thirds of which should Total Public Debt 39.6 39.9 50.9 56.6 73.6 69.5 65.9
be private debt, again due to investments in the natural gas External 32.9 34.5 42.4 48.1 63.6 60.8 59.1
sector. According to the report, Mozambique must ensure Domestic 6.7 5.5 8.6 8.5 10.0 8.6 6.8
that these natural gas production projects materializes, as Source: IMF (January 2016)
to ensure its debt sustainability, given the expected positive
effects on GDP growth, exports and budget revenues. On
the other hand, any delays in natural gas production or tax
revenues below expectations will contribute towards the
deterioration of the country’s debt ratio over the medium/long
Adjustment in public debt forecasts (IMF)
term. More so, the IMF highlighted the need for Mozambique to
continue improving its debt management and prioritize public
investment, as well as initiate the gradual fiscal consolidation, (% GDP)
in order to put public debt on a downward trajectory within the 80.0
medium term. In the last public debt sustainability analysis,
the IMF considered that the risks of public debt distress have 70.0
increased, given that the external debt weighs heavily on the
60.0
overall debt-to-GDP ratio.
50.0
Meanwhile, the IMF approved a loan facility worth USD
40.0
282.9 million, which aims to increase reserves and
uphold the macroeconomic stability. This line of credit 30.0
is expected to alleviate external pressures on the balance of 2012 2013 2014 2015 2016 2017
payments, and support the Government in reducing poverty Jan-13 Jul-13 Jan-14
May-14 Dec-14 Jan-16
and promoting social integration. The first payment will Source: IMF
amount to USD 117.9 million, released immediately.
The concerns about Mozambique’s debt sustainability lead the main rating agencies to revise downwardly its
forecasts. This July, Standard & Poor’s downgraded the country’s rating to B-, from B, with a negative outlook,
in line with the possibility of debt restructuring related to the EMATUM’s loan, as well as lower expectations for economic
growth. According to the agency, the financial difficulties reported by the public tuna company have raised concerns about
the country’s governance model and the management of public debt. Over the next couple of years, large-scale investments
related to the natural gas sector are expected to increase the country’s external indebtedness. Standard & Poor’s estimates
that gross public debt will have reached 53% of GDP during 2015, which, according to the agency, is an elevated ratio for
a country with a GDP per capita of USD 600.
Last August, Moody’s adjusted down its rating for the Public Debt
Mozambican economy to B2, from B1, with a negative
Outlook, according to debt indicators and weak fiscal (% GDP; % total budget revenues)
performance. The outlook reflects uncertainties over the
Government’s strategy to cover the incremental external debt 70% 250%
payments in foreign currency, which could add pressure to 60%
200%
50%
Treasury’s liquidity in the medium term. The agency expects
40% 150%
public debt to reach 58% of GDP, approximately, during
30% 100%
2016, up from 52% in 2014 and only slightly down from
20%
the 59% recorded in 2015. These ratios exceed the figures 50%
10%
usually observed in countries with similar ratings and are
0% 0%
well above the average for Sub-Saharan countries (29% in
2007
2008
2009
2010
2011
2012
2013
2014
2015
2016F
2017F
2014). Moody’s report relates this trend of debt growth with
the successive deficits recorded over the past few years which, Gross Debt/GDP
in turn, were driven by a high amount of capital expenditure,
reduced amount of grants and the devaluation of the metical
against the dollar.
8E.E.F. - Mozambique * January 2016
PUBLIC FINANCES
Fitch also adjusted its rating for the Mozambican economy down to B, from B+ with a stable outlook. Justifying
its decision, the agency argued that the country’s fiscal situation has deteriorated over the previous years, due to high
deficit figures, a large increase in public debt, volatile tax revenues and wage increases in the public sector. Fitch also
states that the acceleration of public debt reflects the country’s elevated funding needs and the depreciation of the metical
against the dollar. As such, Fitch expects public debt to have reached no more than 61.6% of GDP during 2015, followed
by a slight reduction during 2016-17. Even so, the increase of funding for public companies, as well as the potential use of
state guarantees, both present sizeable risks for the performance of public debt over the following years.
Fiscal Risks
-Commodity prices volatility -Impact on exports and budget revenues
-It could increase the public debt and its service;
-Exchange rate volatility -Increase the price of imports, with impact on inflation;
Macroeconomic Shocks
-Financial constraints for firms
-Mismatch between budget and executed revenue;
-Fiscal revenue volatility and impact in expenditure
-Executed capital expenditure below the budget amount
-Increasing public debt;
-Public Debt Sustentability
-Government guarantees (for example, USD 350 million of EMATUM)
-Public-Private Partnerships -Contingent liabilities
Specific risks
-Financial obligations could fall on Government;
-Public and participated enterprises -Financial guarantees and retrocession agreements granted by the
State.
Source: Fiscal Risks Statement, Ministry of Economy and Finance of Mozambique
Vânia Patrícia Duarte
9E.E.F. - Mozambique * January 2016
EXTERNAL SECTOR
Developments in the Mozambican external sector continue Foreign Direct Investment and Current Account
to be shaped by megaproject activities. Considering this,
the Bank of Mozambique released a new version of the (million USD)
Balance of Payments accounts, which allows us to subtract
7,000 -7,000
the effects from the megaprojects activities in the current
6,000 -6,000
account, allowing for a more accurate evaluation of the
5,000 -5,000
country’s external vulnerabilities.
4,000 -4,000
3,000 -3,000
The 2014 current account deficit declined due to
2,000 -2,000
smaller activity in the megaprojects…
1,000 -1,000
0 0
The current account balance continues to record a sizeable 2010 2011 2012 2013 2014
deficit for the size of the economy, totalling around FDI of other projects FDI of megaprojects
34% of GDP in 2014 (down from 39% of GDP in 2013), Current Account
Source: Bank of Mozambique
according to the figures from the Bank of Mozambique.
Nevertheless, the current account deficit declined slightly
in 2014, essentially due to a deceleration in megaproject
activity, and a decline in foreign direct investment, which
resulted in lower imports of goods and services. As noted
in previous reports, several factors may have hindered
activities in these projects during 2014, among which Megaprojects' exports and imports
we highlight: logistical constraints, political instability
and the project’s own useful life cycle. Simultaneously, (million USD; 4 cum.quarters)
imports unrelated to megaproject activities remained high
8,000
and continue to account for roughly 90% of all imports.
7,000
Even if only slightly, export revenue also decreased in
6,000
2014, resulting from losses in traditional exports, which 5,000
receded from 12.2% of GDP in 2013 to 9.5% of GDP in 4,000
2014, mainly due to the unfavourable price variation for 3,000
the products traditionally exported (essentially cotton, 2,000
sugar and cashew). On the other hand, despite the price 1,000
drops in coal, aluminium and gas, megaproject’s exports 0
Q1 Q2 Q3 Q4 Q1 Q2 Q3 Q4 Q1 Q2 Q3 Q4 Q1 Q2 Q3 Q4 Q1 Q2 Q3 Q4 Q1 Q2 Q3
actually increased slightly (+10%), probably due to a
2010 2011 2012 2013 2014 2015
larger amount of coal production. It is worth to note
Megaprojects' exports Megaprojects' imports
that foreign direct investment also receded substantially Exports excl.megap. Imports excl.megap.
in 2014, from USD 6.2 billion to USD 4.9 billion and Source: Bank of Mozambique
that, unlike in previous years, these capital inflows were
insufficient to cover the current account deficit.
... But, excluding the effect of the megaprojects, the
external deficit expanded in 2014
Current Account and FDI
Despite the above, this deficit is not fully representative of
(million USD, 4 cum.quarters)
the structural external imbalance present in the economy,
as it partially reflects the high amount of imports of 8,000 -8,000
goods and services related to ongoing megaprojects and 7,000 -7,000
funded, for the most part, by foreign direct investment. 6,000 -6,000
In this context, if we consider the current account 5,000 -5,000
balance excluding megaproject activities, the deficit 4,000 -4,000
3,000 -3,000
drops to 27% of GDP (2014), 6.7 p.p. less than when
2,000 -2,000
considering the balance including megaprojects. More so, 1,000 -1,000
the current account deficit rose 2 p.p. in comparison to 0 0
the preceding year, from 25% of GDP in 2013 to 27% of Q1 Q3 Q1 Q3 Q1 Q3 Q1 Q3 Q1 Q3 Q1 Q3
GDP in 2014, which is explained by the deterioration of 2010 2011 2012 2013 2014 2015
the trade balance. As such, as far as the megaprojects are FDI (Net) Current Account
concerned both exports and imports have declined, but if Source: Bank of Mozambique
10E.E.F. - Mozambique * January 2016
EXTERNAL SECTOR
we consider the deficit excluding the megaprojects, the external account deficit widened, given that the drop in the
export activity was not accompanied by a decrease in imports, which points to the overheating of internal demand.
The external accounts worsened in 2015, due to lower revenue from grants and the deceleration of
foreign direct investment.
During the early months of 2015, we continued to note a deceleration of foreign direct investment, as well as a
deterioration of the current account deficit. According to accumulated data for the Jan-Sep period, imports of goods
remained high despite a substantial reduction in megaproject-related imports (-43% y/y), this while exports of
goods continued to drop, on aggregate, despite a slight uptick in traditional exports. The services account deficit
also recoded a slight increase, but the higher current account deficit mostly reflects the drop, to nearly half, of
secondary earnings, a result driven by lower foreign grants.
In short, the main factors affecting the Balance of Payments were: (i) fewer grants (ii) lower foreign
direct investment (iii) imports resilience (iv) lower commodity prices.
Grants
Current Account - Quarterly figures
Jan-Sep Jan-Sep % (million USD)
2014 2015 change
2,000
Current Account -4,827.7 -5,172.7 7.1%
Goods -3,584.5 -3,545.5 -1.1% 1,500
Exports (FOB) 3,681.7 3,525.2 -4.2%
Of which: megaprojects 1,760.0 1,515.8 -13.9% 1,000
Imports (FOB) 7,266.2 7,070.7 -2.7%
500
Of which: megaprojects 1,286.5 735.2 -42.9%
Services -2,951.0 -2,351.3 -20.3%
0
Credit 704.4 685.9 -2.6%
Q1
Q2
Q3
Q4
Q1
Q2
Q3
Q4
Q1
Q2
Q3
Q4
Q1
Q2
Q3
Q4
Q1
Q2
Q3
Q4
Q1
Q2
Q3
Debit 3,655.4 3,037.1 -16.9%
2010 2011 2012 2013 2014 2015
Primary Income -189.4 -260.5 37.5%
Grants
Credit 114.7 108.0 -5.8% Source: Bank of Mozambique
Debit 304.1 368.6 21.2%
Secondary Income 1,897.2 984.5 -48.1%
Credit 2,014.2 1,104.2 -45.2%
Debit 117.0 119.7 2.3%
Source: Bank of Mozambique
Current Account
Including Megaprojects Excluding Megaprojects
Million USD % GDP Million USD % GDP
2013 2014 2013 2014 2013 2014 2013 2014
Current Account -6,253.4 -5,797.2 -39.1% -33.9% -3,960.0 -4,276.7 -25.2% -27.2%
Goods -4,356.9 -4,035.3 -27.2% -23.6% -4,619.5 -4,978.0 -29.4% -31.6%
Exports (FOB) 4,122.6 3,916.4 25.8% 22.9% 1,926.2 1,486.9 12.2% 9.5%
Imports (FOB) 8,479.5 7,951.7 53.0% 46.5% 6,545.6 6,464.9 41.6% 41.1%
Services -3,258.8 -2,932.3 -20.4% -17.2% -805.4 -613.9 -5.1% -3.9%
Receipts 645.5 724.8 4.0% 4.2% 645.5 724.8 4.1% 4.6%
Payments 3,904.3 3,657.2 24.4% 21.4% 1,450.9 1,338.7 9.2% 8.5%
Primary Income -58.6 -201.9 -0.4% -1.2% -7.7 -105.2 0.0% -0.7%
Receipts 134.3 128.0 0.8% 0.7% 132.2 121.2 0.8% 0.8%
Payments 192.9 329.9 1.2% 1.9% 139.8 226.5 0.9% 1.4%
Secondary Income 1,420.8 1,372.3 8.9% 8.0% 1,472.5 1,420.5 9.4% 9.0%
Receipts 1,506.0 1,497.1 9.4% 8.8% 1,506.0 1,497.0 9.6% 9.5%
Payments 85.2 124.8 0.5% 0.7% 33.5 76.6 0.2% 0.5%
Source: Bank of Mozambique and BPI calculation, according to GDP figures from INE
Luisa Teixeira Felino
11E.E.F. - Mozambique * January 2016
EXCHANGE RATE POLICY
The Metical has recorded a significant devaluation Nominal exchange rate of the metical against USD
against the USD since mid-2014, a trend which and ZAR
culminated in November 2015 with a 25% devaluation
in little over a week. This was a worrisome development as
exchange rate stability has been a major factor to maintain 60 6
a moderate growth of the general level of prices over the 55 5.5
past few years. More so, the sizeable drops in commodity 50 5
prices in the international markets, as well as the lower 45 4.5
amount of foreign direct investment, this in a context of 40 4
high dependency on imported goods (Mozambique remains 35 3.5
a major net importer for most products, including consumer 30 3
and intermediate goods), both exert pressure on the 25 2.5
balance of payments and lead to further devaluation of the 20 2
Metical. To this effect also contributed the strengthening of Dec-10 Dec-11 Dec-12 Dec-13 Dec-14 Dec-15
the USD against the major currencies, which has followed USD/MZN ZAR/MZN
both the upswing of the North-American economy, as well Source: Thomson Reuters; BPI calc.
as the reversal in the country’s monetary policy. As such,
Net International Reserves
the Mozambican currency devaluated at a brisker pace
throughout 2015, with the nominal exchange rate against
the dollar climbing from 32 MZN/USD at the start of the (million USD; MZN/USD)
year to 57 MZN/USD by the end of November, this before 3,500 55
stabilizing around 48 MZN/USD by the end of the year.
3,000 50
2,500 45
Despite this, the degree of effective currency
devaluation was significantly weaker than the 2,000 40
bilateral devaluation against the USD. In order to 1,500 35
assess whether the devaluation of the Metical properly 1,000 30
reflects the existence of external imbalances, it would 500 25
be more appropriate to consider the effective exchange
0 20
rate – which weighs the bilateral exchange rates weighted Nov-11 Nov-12 Nov-13 Nov-14 Nov-15
by the importance of the country’s trade partners. The
Net International Reserves MZN/USD (RHS)
main point to highlight here is that the degree of effective Source: Bank of Mozambique
currency depreciation is significantly smaller than when
considering solely the exchange rate with the USD. Indeed, Net International Reserves in months of imports of
note that both South Africa (due to geographical reasons) Goods and Services
and EU countries (due to historical reasons) are both major (months of imports)
Mozambican trade partners. As such, while the Metical was
5.0 4.6 4.7
hurt by the strong appreciation of the dollar, it nevertheless
benefitted from the devaluation of both the South African 4.0 3.3
3.1 3.1
Rand and the Euro against the US dollar. Nevertheless, the 3.0
most recent readings of the effective exchange rate confirm 2.2
that the Metical still suffered a sizeable depreciation. 2.0
1.0
The stock of external reserves also suffered a
0.0
sizeable drop, falling below figures deemed the 2013 2014 2015*
adequate minimum. Against the strong pressure on Months of G&S imports
the national currency, the Central Bank scaled up its Months of goods and services imports (excl. Megaproj.)
intervention in the foreign exchange market in order to Source: Bank of Mozambique; BPI calc.
alleviate the pressure on the currency (the rate of currency
purchases rose to USD 226.3 million during the third
quarter) and defend the international reserves stock. But
despite its efforts, the amount of international reserves declined significantly, from USD 2.88 billion in late-2014 to
USD 1.97 billion by November 2015. This results mostly from the balance of payments pressure and worsening terms
of trade, but reflects also lower grants and higher debt service payments (which have risen due to the Government’s
expansionist policies). In order to ascertain whether the current reserves holding are appropriate for precautionary
purposes (in particular for the management of any eventual external shock), one must measure the stock in terms
12E.E.F. - Mozambique * January 2016
EXCHANGE RATE POLICY
of months of imports of goods and services. Considering Effective exchange rate
the total of goods and services imports, the amount of
net foreign reserves in 2014 would be enough to cover (index Jan 2006=100)
around 3.1 months of imports, a figure which may worsen
to 2.2 months in 2015, according to our projections. With 350
that said, it is more appropriate to calculate this ratio by 300
Depreciation
excluding import activity related to the megaprojects, 250
given that such imports are relatively unresponsive to 200
variations in the exchange rate. For 2014, the stock
150
of international reserves covered close to 5 months of
imports of goods and services excluding megaprojects, 100
and our estimate places the 2015 figure below the 4 50
months threshold, assuming that the level of import would 0
have remained stable in 2016. Note that, by theoretical Dec-06 Jun-08 Dec-09 Jun-11 Dec-12 Jun-14 Dec-15
convention, a ratio below 4 months of imports is considered Source: Bank of Mozambique
inefficient in protecting the country from current account
shocks. As such, we can state that the current amount of
Inflation rate and metical
reserves is relatively short and that protecting this stock
is of great importance, so that the additional exchange
rate flexibility is enough to absorb most external shocks. (percentage)
Beyond adopting a tighter monetary policy, the Central 100 20.0
Bank may also adopt more unconventional measures 80
in order to stabilize the exchange rate by restricting 60 15.0
Depreciation
demand for foreign currencies. Such measures would
40
likely involve restrictions on imports or, as was recently 10.0
20
announced by the country’s monetary authority, to
0
impose limits on the use of debit and credit cards abroad. 5.0
-20
-40 0.0
Dec-06 Jun-08 Dec-09 Jun-11 Dec-12 Jun-14 Dec-15
nominal exchange rate (eop) - yoy% change
Inflation yoy % (RHS) Source: Bank of Mozambique
The effects of devaluation on the inflation rate
The effects of the currency devaluation on the inflation rate may be significant. One way to measure how
responsive are prices to changes in the exchange rate involves measuring the elasticity of local prices to exchange rate
movements (exchange rate pass through). In fact, in the case of Sub-Saharan economies, exchange rate variations
tend to be the number one factor in influencing inflation rate hikes1. On the other hand, the theoretical analysis
suggest that this effect has a lesser impact on countries with a more flexible exchange system, prudent macroeconomic
policies and low inflation. As such, given that the impact of a currency devaluation on the inflation rate is conditioned
by the economy’s politico-economic traits, in the case of Mozambique, several factors appear to point towards a
sizeable impact, even if some other factors also weigh in its favour. Firstly, we note the country’s high dependence
on imported goods (imports weigh over 60% of GDP) together with the relative inability to substitute imports (and
as such, import demand is more inelastic, while foreign companies are generally in a better position to determine
prices), which leads to the assumption that the increase in import costs will translate into price increases. According to
our estimates (which rest on some assumptions), the weight of imported goods on the Mozambican Consumer Prices
Index is likely to surpass 60%. More so, the analysis of previous periods of strong currency devaluation suggests a
sizeable impact on inflation, despite with a lagged effect. On the other hand, we should note the fact that the Metical
was overvalued (according to the IMF calculations using several models, the Metical was overvalued by around 5
to 10%), which allows for some wiggle room for the exchange rate to converge at a balanced level. With that said,
the most relevant factor to highlight is that a large part of goods imports come from South Africa and as such, the
devaluation of the South-African Rand against the USD weighs in its favour and offsets the strong devaluation of the
1
https://www.imf.org/external/pubs/ft/wp/2015/wp15189.pdf
IMF Working paper WP/15/189
13E.E.F. - Mozambique * January 2016
EXCHANGE POLICY
Metical against the Dollar. Given the current scenario, in order to properly evaluate the effects of the devaluation of
the Metical on the inflation rate, we adopted 3 possible scenarios to calculate the effective exchange rate. For the first
scenario we considered only the exchange rate against the USD, assuming that all external transactions are conducted
using said currency (most prices are determined in USD); for a second scenario, we considered an effective nominal
exchange rate weighted by the weight of the respective trade partners; and for the final scenario, we attributed a
larger weight to the South-African Rand. According to these simulations (and assuming a one year lagged effect),
we conclude that the devaluation of the Metical in 2015 is likely to result in the inflation rate climbing above the
5%-6% target for 2016, and possibly hovering aroud a double-digit level. In fact, in this context, the objectives
for the inflation rate are indeed ambitious and we expect the Central Bank to further tighten the monetary
policy, as well as implementing unconventional measures to restrict demand for foreign currency. Finally, there
can be significant risks to price stability related to the upward pressure on food prices or from fiscal policy.
Apreciation (+) / Depreciation (-) of average annual exchange rate
Scenario 1 Scenario 2 Scenario 3
Nominal Exchange Rate Nominal Effective Nominal Effective
(USD/MZN) Exchange Rate Exchange Rate
(weighted by the share of (25% USD; 25% EUR;
main trade partners) 50% ZAR)
2011 14.7% 12.8% 13.3%
2012 2.6% 8.8% 10.1%
2013 -6.0% -0.3% 1.6%
2014 -5.0% -0.8% 0.8%
2015 -24.1% -11.5% -9.4%
BPI forecasts for inflation rate in 2016
% imported goods in CPI
0.70 16.9% 8.1% 6.6%
0.60 14.5% 6.9% 5.6%
0.50 12.0% 5.8% 4.7%
Luisa Teixeira Felino
14E.E.F. - Mozambique * January 2016
MONETARY POLICY AND INFLATION
The devaluation of the Metical has begun to translate Inflation and Monetary Policy rate
into an acceleration of the inflation rate. Over the closing
months of 2015, the inflation rate has started to accelerate (percentage)
significantly, after having remained contained within the
Central Bank’s goals for a considerable period. The Maputo 20.0
18.0
consumer price index, which serves as the reference for
16.0
monetary policy decisions, stood as low as to record negative 14.0
readings during April and May before initiating a progressive 12.0
climb and reaching a double digit level in December (of 11% 10.0
y/y). Beyond the effect of the devaluation of the Metical, this 8.0
6.0
climb is also related to price increases in some subsidized 4.0
foodstuffs (mainly bread), as well as tariff increases for water 2.0
and electricity. 0.0
Dec-09 Dec-10 Dec-11 Dec-12 Dec-13 Dec-14 Dec-15
Anticipating this result, the Bank of Mozambique Lending Facility Rate y-o-y% Inflation
Source: Bank of Mozambique
immediately adopted a tighter monetary policy. In
reaction to the increasing general price level and the context
of additional inflationary pressures, we have observed an
inversion of the country’s monetary policy, which had so
far been accommodative, with interest rates set on historic Inflation Rate by components
lows (lending rate at 7.5%, deposit rate at 1.5%, reserve
requirement at 8%) since November 2014. The Bank of (percentage)
Mozambique proceeded with a first increase in its reference 12.0% Food&beverages
rate in October by 25 basis points, to 7.75%, followed by 10.0% Alcohol&tobacco
a further increase of 50 basis points in November and yet 8.0%
Clot.&footwear
Housing&util.serv.
another 150 basis points increase in December, which brought 6.0% Education
the lending rate to 9.75% at the year end. Meanwhile, the
4.0% Furniture, domes.equip.
interest rate on the deposit facility rose to 3.75% while the Cult.&leisure
2.0%
reserve requirement was set at 10.5%. Despite this rapid Communications
0.0%
tightening of the monetary policy, the Bank of Mozambique Transports
-2.0%
did not managed to fulfil its goal for inflation in 2015, which Health
Mar-15
Sep-15
Apr-15
Aug-15
Dec-15
Jun-15
Oct-15
Jul-15
Feb-15
Nov-15
May-15
calls for average CPI growth in Maputo between 5% and 6%. Rest.,hot.,cafés
Goods and diverse services
In this context, we believe that, in order to maintain inflation
rate at low levels in 2016, the Central Bank should proceed Source: Bank of Mozambique; BPI calc.
with additional measures.
Luisa Teixeira Felino
15E.E.F. - Mozambique * January 2016
Developments in the international commodity markets
The deceleration of the Chinese economy, explained by a change in its growth model, is having a
sizeable impact in commodity demand and, consequently, in the evolution of prices. Between 2002 and
2012, commodity prices recorded noticeable increases driven by significant demand for raw materials, mainly from
China. During this period, this country became the world’s largest commodity importer (in 2000, China consumed
about 12% of all metals in the market, a figure which expanded to 50% nowadays). Given the significant weight of
the Chinese economy in global consumption of raw materials, the introduction of a “new normal” constitutes one
of the main factors for downward pressure on commodity prices in the international markets. More so, oversupply
has also exacerbated this scenario.
According to the data published by the IMF, the index that aggregate energetic and non-energetic commodity prices,
recorded a 21% drop in 2015 and registered a 31% drop when compared to 2014. This result was driven not only by
energy prices but also the prices for metals (-25%) and for agriculture (-15%). These two are particularly important
for Mozambique, given that a substantial part of its exports include aluminium, heavy sands and coal, as well as
more traditional products, such as sugar, although at a smaller extend.
Traditional Exports
Shrimp Sugar Cotton
($/Kg) ($/Kg) ($/Kg)
19 0.7 5
17 0.6
4
0.5
15
0.4 3
13
0.3 2
11
0.2
9 1
0.1
7 0 0
2005
2006
2007
2008
2009
2010
2011
2012
2013
2014
2015
2000
2001
2002
2003
2005
2006
2007
2008
2010
2011
2012
2013
2015
2005
2006
2007
2008
2009
2010
2011
2012
2013
2014
2015
Megaprojects' exports
Australian Coal Aluminium Natural Gas
($/mt) ($/mt) (2010=100)
200 3,500 250
3,000
150 200
2,500
100 150
2,000
50 100
1,500
0 1,000 50
2005
2006
2007
2008
2009
2010
2011
2012
2013
2014
2015
2005
2006
2007
2008
2009
2010
2011
2012
2013
2014
2015
2005
2006
2007
2008
2009
2010
2011
2012
2013
2014
2015
Source: World Bank
16E.E.F. - Mozambique * January 2016
Natural Gas
The consumption of natural gas grew nearly 50%, which made this commodity the fastest rising fossil fuel in the world.
The expansion in consumption recorded for China and the Middle East explain this performance, which surpassed the
EU, where gas usage is unlikely to record the consumption highs recorded in 2010. According to the International
Energy Agency (IEA), natural gas should continue expanding its weight on global usage, with the agency anticipating
a 2% increase per year until 2020. The expansion of natural gas consumption may be hindered by the introduction
of more fuel-efficient technologies, competition from renewable energy, usage of coal to generate electricity and the
possibility that the current low prices in practice may lead to investment delays.
Even if natural gas prices continue dropping in the international markets, the main gas companies present in
Mozambique (Anadarko and ENI) remain confident about the sustainability of their projects. Moody’s also doesn’t
call into question the sustainability of these projects and expects them to remain resilient as price determination
remains highly competitive, despite the current low prices for natural gas in the international markets. On the other
hand, EIU sees the production of natural gas in large quantities as unlikely during the next decade, as the current
level of production is likely to meet demand until mid-2020. As such, EIU estimates that substantial exports will
only start after 2025.
Coal
Usage of coal has decreased in recent years, resulting in excess capacity and lower prices. The IEA notes that,
following a decade of significant growth, global demand for coal stagnated. As such, the agency believes that
demand will continue to decrease, due to the economic adjustment process underway in China, who accounts for
half the global usage of this commodity. More so, environmental concerns, namely the agreement struck during the
Climate Summit in Paris, are likely to hinder demand for this commodity. Among the OECD countries, coal demand
is expected to drop 40% until 2040, while Asia is expected to account for 4 out of every 5 tons of coal used globally.
It is expected that coal accounts for merely 15% of electricity production outside of Asia in 2040, losing ground to
both natural gas, nuclear power and renewable energy.
In Mozambique, if the international coal prices continue to drop, the expansion plans in the coal mines could be
threatened. According to the IMF, this may affect economic growth by 0.5 percentage points in 2016. Meanwhile,
the Brazilian company Vale recently stated it is doubling coal production, with the second phase of extraction already
underway, which is expected to expand from 5 million tons (mt) in 2014 to 17 mt and 26 mt in 2016 and 2018,
respectively.
Vânia Patrícia Duarte
17E.E.F. - Mozambique * January 2016
18E.E.F. - Mozambique * January 2016
Database
Main economic indicators
2011 2012 2013 2014 2015 2016
Population (million) 24.6 25.2 25.8 26.5 27.1 27.8
GDP per capita (USD PPP) 977.1 1,039.2 1,107.1 1,178.3 1,243.5 1,327.9
Source: IMF
Gross domestic product
2011 2012 2013 2014 2015 2016
GDP (MZN billion) 385.0 433.0 482.0 536.0 598.0 673.0
GDP (USD billion) 13.2 15.2 16.0 17.0 15.2 14.8
GDP composition (sectoral approach)
Agriculture, livestock, forestry and fishery 26.3% 25.2% 24.1% 23.0% - -
Mining Industry 2.2% 3.0% 3.2% 3.5% - -
Manufacturing Industry 10.3% 9.1% 8.6% 9.0% - -
Electricity and water 3.2% 3.2% 3.4% 3.5% - -
Construction 2.1% 2.1% 1.8% 2.1% - -
Trade and Services 10.3% 11.0% 11.7% 11.1% - -
Transport, storage and communications 7.9% 8.3% 8.9% 8.7% - -
Other Services 37.8% 38.1% 38.3% 39.1% - -
Source: Statistics Mozambique (INE), BPI, IMF (Article IV Jan.2016)
Real growth forecasts (GDP yoy%)
2015 2016
State Budget for 2016 7.5 7.0
IMF (Article IV Jan. 2016) 6.3 6.5
Economist Intelligence Unit (Jan.2016) 6.3 6.2
Source: Mozambique Ministry of Finance (DNO), Economist Intelligence Unit, IMF
Consumer prices
2011 2012 2013 2014 2015 2016
Inflation rate (annual average) 10.4 2.1 4.2 2.3 1.9 5.6
Inflation rate (end-of-period) 5.5 2.2 3.0 1.1 5.1 5.6
Source: IMF (Article IV Jan.2016)
19E.E.F. - Mozambique * January 2016
Database (cont.)
External sector
2011 2012 2013 2014 2015 2016
Exports (USD billion) 3,118.3 3,856.0 4,123.0 3,927.0 3,557.0 3,643.0
Imports (USD billion) 5,367.6 7,903.0 8,480.0 7,952.0 7,090.0 7,863.0
of which: megaprojects 1,513.1 2,143.0 1,934.0 1,487.0 802.0 2,058.0
Current account, after grants (%GDP) -23.1 -44.7 -39.1 -34.1 -30.2 -33.1
Current account, before grants (%GDP) -31.3 -48.3 -41.9 -37.4 -33.1 -36.1
External grants (%GDP) 785.0 538.0 460.0 568.0 441.0 442.0
Gross International Reserves (USD billion) 2.4 2.8 3.2 3.1 2.5 2.8
in months of imports 2.4 2.7 3.3 3.9 3.0 2.3
Source: IMF (Article IV Jan.2016)
Public finances
% do PIB
2011 2012 2013 2014 2015 2016
Total expenditure (% GDP) 31.9 30.7 34.0 42.2 35.3 33.9
Total revenue (% GDP) 27.1 21.9 26.3 27.3 25.2 26.2
Fiscal balance, after grants (% GDP) -5.0 -3.9 -2.7 -10.6 -6.0 -4.0
Fiscal balance, before grants (% GDP) -12.4 -8.9 -7.9 -14.8 -10.0 -7.7
Public debt (%GDP) 37.5 39.9 50.9 56.6 73.6 69.5
External 31.2 34.5 42.4 48.1 63.6 60.8
Domestic 6.3 5.5 8.6 8.5 10.0 8.6
Source: IMF (Article IV Jan.2016)
Financial indicators
2011 2012 2013 2014 2015
Exchange Rate
End-of-period
USD/MZN 27.13 29.70 30.02 32.55 48.00
EUR/MZN 35.16 39.20 41.25 41.14 52.12
ZAR/MZN 3.36 3.50 2.86 2.94 3.10
Average
USD/MZN 29.04 28.27 30.15 31.35 39.54
EUR/MZN 40.40 36.35 40.04 41.65 43.79
ZAR/MZN 4.04 3.45 3.14 2.89 3.08
Central bank rates (end-of-period)
Standing lending facility 15.00 9.50 8.25 7.50 9.75
Deposit facility 5.00 2.25 1.50 1.50 3.75
Lending rates (average)
1 year 23.6 22.2 20.3 20.8 18.7
> 2 year 23.5 22.8 20.9 21.2 19.1
Source: Bloomberg, Bank of Mozambique, BPI
20BPI
"This document is only for private circulation and only partial reproduction
is allowed, subject to mentioning the source. This research is based on
information obtained from sources which we believe to be reliable, but is not
guaranteed as to accuracy or completeness. At any time BPI or any affiliated
companies (or employees) may have a position, subject to change, in these
markets. Unless otherwise stated, all views (including estimates or forecasts)
herein contained are solely expression of BPI Economic and Financial Research
and subject to change without notice."
BANCO BPI, S.A.
Rua Tenente Valadim, 284 4100 - 476 PORTO
Telef.: (351) 22 207 50 00 Telefax: (351) 22 207 58 88
Largo Jean Monnet, 1 - 9º 1269-067 LISBOA
Telef.:(351) 21 724 17 00 Telefax: (351) 21 353 56 94You can also read