Mpumalanga Economic Growth & Development Path - October 2011 "Towards a more equitable and inclusive economy"
←
→
Page content transcription
If your browser does not render page correctly, please read the page content below
Mpumalanga Economic Growth &
     Development Path

 “Towards a more equitable and inclusive economy”

               October 2011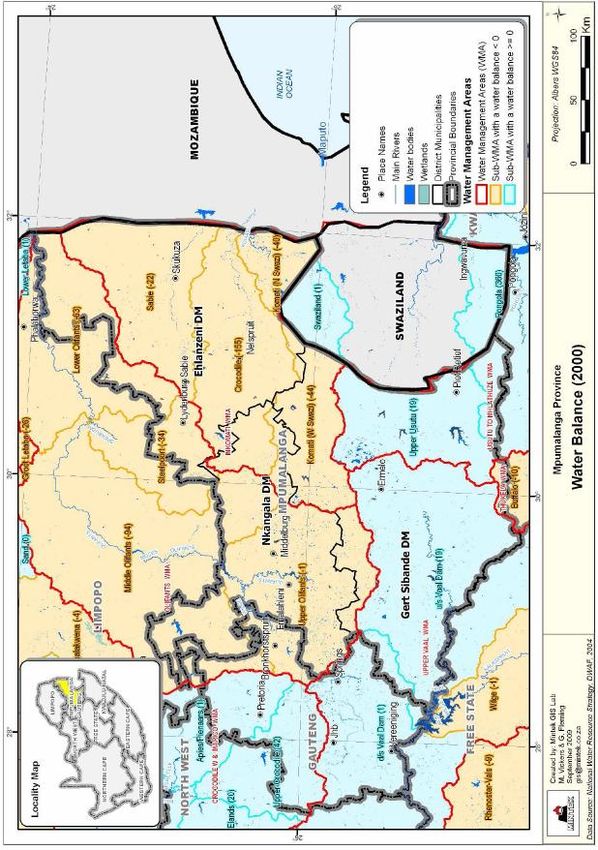
TABLE OF CONTENTS

CONTENTS:                                                                                                                                       PAGE

1. EXECUTIVE SUMMARY ....................................................................................................................... 1
2. MPUMALANGA SITUATIONAL ANALYSIS .......................................................................................... 6
   2.1 Population ..................................................................................................................................... 6
      2.1.1 Provincial Labour Market Characteristics .............................................................................. 7
      2.1.2 Reducing unemployment ....................................................................................................... 9
   2.2 Inequality .................................................................................................................................... 12
      2.2.1 Reducing inequality.............................................................................................................. 12
   2.3 Poverty ........................................................................................................................................ 13
      2.3.1 Reducing poverty ................................................................................................................. 14
      2.3.2 Human Development Index (HDI) ........................................................................................ 15
   2.4 Resource Analysis........................................................................................................................ 15
      2.4.1 Land ...................................................................................................................................... 16
      2.4.2 Water ................................................................................................................................... 21
      2.4.3 Biodiversity........................................................................................................................... 25
      2.4.4 Transport Infrastructure ...................................................................................................... 27
      2.4.5 Electricity.............................................................................................................................. 30
   2.5 Information Communication Technology (ICT)........................................................................... 33
   2.6 Human Capital............................................................................................................................. 35
   2.7 Sector Analysis of the Provincial Economy ................................................................................. 35
      2.7.1 Provincial Gross Domestic Product (GDP)............................................................................ 35
      2.7.2 Contribution to national and provincial economy ............................................................... 36
      2.7.3 Sectoral contribution and growth ........................................................................................ 36
      2.7.4 Contribution to Regional Gross Geographic Product........................................................... 41
      2.7.5 Mining .................................................................................................................................. 43
      2.7.6 Manufacturing ..................................................................................................................... 45
      2.7.7 Trade .................................................................................................................................... 46
      2.7.8 Tourism sector ..................................................................................................................... 46
      2.7.9 Community services ............................................................................................................. 47
3. OVERVIEW OF THE NATIONAL GROWTH PATH AND PROVINCIAL APPLICATIONS AND
    IMPLICATIONS ................................................................................................................................. 48
   3.1 Global Economic Situation .......................................................................................................... 48

                                                                            i
3.2 National Economic Performance and Outlook ........................................................................... 49
   3.3 National Labour Market .............................................................................................................. 49
   3.4 Main Challenges South Africa Faces ........................................................................................... 50
      3.4.1 Structures of Production and Control .................................................................................. 51
      3.4.2 Structural Changes in the Provincial Space Economy .......................................................... 54
   3.5 The National Growth Path as a fulcrum to remedying the challenge ........................................ 54
   3.6 Sectors to Support Employment Creation outlined In the National Growth Path ..................... 55
   3.7 Job drivers ................................................................................................................................... 56
      3.7.1 Infrastructure ....................................................................................................................... 56
      3.7.2 Main Economic Sectors ........................................................................................................ 57
      3.7.3 Seizing the Potential of New Economies ............................................................................. 57
      3.7.4 Investing in Social Capital and Public services ..................................................................... 57
      3.7.5 Spatial Development ............................................................................................................ 58
   3.8 Macroeconomic and Microeconomic Interventions .................................................................. 58
4. THE MPUMALANGA ECONOMIC GROWTH AND DEVELOPMENT PATH ......................................... 60
   4.1. Strategic objectives .................................................................................................................... 60
   4.2 Mpumalanga in the next ten years ............................................................................................. 60
   4.3 Job drivers ................................................................................................................................... 60
      4.3.1 Infrastructure as a job driver for job creation and catalyst for development ..................... 61
      4.3.2 Main Economic Sectors ........................................................................................................ 61
      4.3.3 Sectors Seizing the Potential for New Economies ............................................................... 72
      4.3.4 Investing in Social Capital & the Public Service ................................................................... 74
      4.3.5 Spatial Development ............................................................................................................ 75
5. STRATEGIC INTERVENTIONS ............................................................................................................ 77
   5.1 Principles for unlocking growth and employment...................................................................... 77
      5.1.1 Broad Based Black Economic Empowerment (BBBEE) ........................................................ 77
      5.1.2 Strategic Procurement ......................................................................................................... 77
      5.1.3 Labour and Skills Development............................................................................................ 78
      5.1.4 Inclusive and Shared Growth of the Economy ..................................................................... 79
      5.1.5 Cooperatives ........................................................................................................................ 79
      5.1.6 Small Micro Enterprises (SME’s) .......................................................................................... 80
      5.1.7 Finance and Funding ............................................................................................................ 81
   5.2 High level interventions for the Growth Path to work ............................................................... 82
      5.2.1 Land Claims .......................................................................................................................... 82

                                                                           ii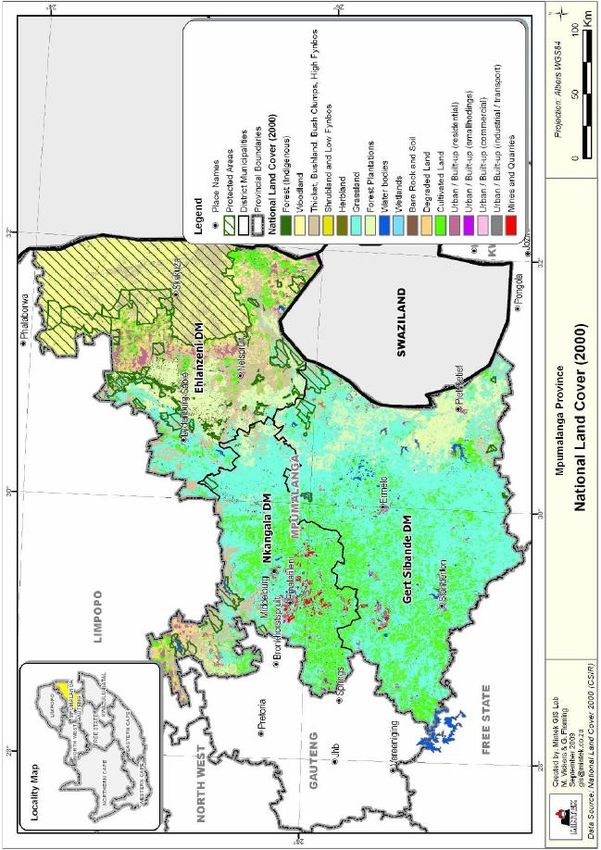
5.2.2 Water Allocation .................................................................................................................. 82
       5.2.3 Transport and Logistics ........................................................................................................ 82
       5.2.4 Electricity.............................................................................................................................. 82
       5.2.5 Policy & Regulations............................................................................................................. 82
       5.2.6 Communication .................................................................................................................... 82
   5.3 Sustainability of the Mpumalanga Economic Growth and Development Path (MEGDP) .......... 83
       5.3.1 Provincial Spatial Development Plan ................................................................................... 83
       5.3.2 Provincial Infrastructure Development Plan........................................................................ 83
       5.3.3 Provincial Industrial Plan (IPAP 2 as a strategy) ................................................................... 83
       5.3.4 Provincial Water Management Plan .................................................................................... 83
       5.3.5 Energy Distribution Plan ...................................................................................................... 83
       5.3.6 Provincial Skills Development Plan ...................................................................................... 84
       5.3.7 Environmental Plan .............................................................................................................. 84
   5.4 Institutional Arrangements ......................................................................................................... 84
   5.5 Monitoring and Evaluation ......................................................................................................... 84
6. CONCLUSION .................................................................................................................................... 85
7. REFERENCES ...................................................................................................................................... 87

                                                                           iii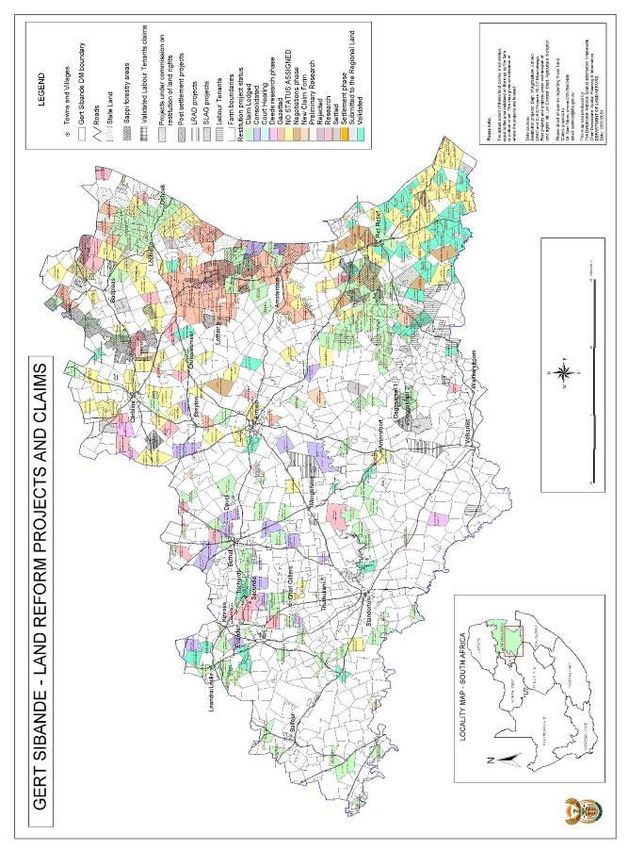
ABBREVIATIONS AND ACRONYMS

BEE       Black economic empowerment
BRICS     Brazil, Russia, India ,China & South Africa
COGTA     Department of Cooperative Governance and Traditional Affairs
DARDLA    Department of Agriculture, Rural Development and Land Administration
DBSA      Development Bank of South Africa
DED       Department of Economic Development
DEDET     Department of Economic Development, Environment and Tourism
DoF       Department of Finance
DPWR&T    Department of Public Works, Roads and Transport
EMF       Environmental Management Framework
EPWP      Expanded Public Works Programme
ESR       Educator-school ratio
EXCO      Executive Committee
GEAR      Growth Employment And Redistribution
GVA       Gross Value Added
IEC       Industrial and Economic Cluster
IPAP 2    Industrial Policy Action Plan
LER       Learner-educator ratio
LSR       Learner-school ratio
MEGDP     Mpumalanga Economic Growth and Development Path
MP        Mpumalanga Province
MPG       Mpumalanga Province Government
MTEF      Medium Term Expenditure Framework
MTSF      Medium Term Strategic Framework
PDC       Provincial Development Council
PGDS      Provincial Growth and Development Strategy
PIC       Public Investment Commissioners
PMC       Provincial Management Committee
RDP       Reconstruction and Development Programme
SASSA     South African Social Services Agency
SIC       Standard Industry Codes
SOE       State owned enterprises
StatsSA   Statistics South Africa
TSA       Tourism Satellite Accounts
UN        United Nations
WTTC      World Travel and Tourism Council

                                    iv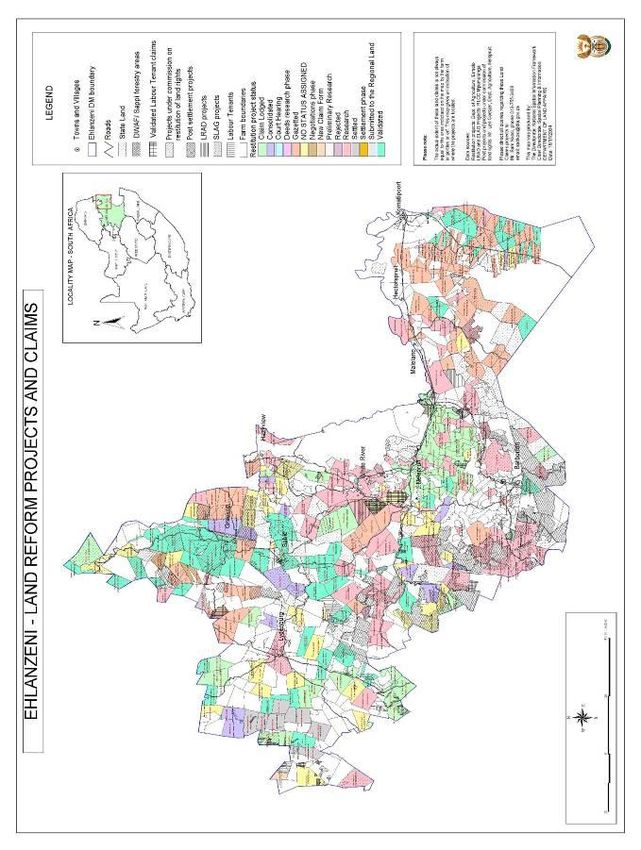
1. EXECUTIVE SUMMARY
Introduction
Mpumalanga is a province rich in resources, people and heritage. Large-scale joblessness, poverty
and inequality however, compromise the Province’s triple bottom line agenda, i.e. addressing the
social; economic and environmental needs of its citizens. The Province is committed to local
economic development, which promotes shared and inclusive growth via the creation of decent
local jobs and sustainable livelihoods. This document provides a detailed framework for the
realisation of these objectives.
The economic growth and development path highlighted in this document illustrates the current
economic landscape of Mpumalanga with a view to future economic growth and development.
This dynamic (will evolve with time) and strategic (will inform future growth) document captures:
Key comparative and competitive advantages of the province;
Economic triggers which will have a positive impact on Low-skill labour absorbing job creation,
Domestic beneficiation of raw materials and Local content and supply into production processes;
Growth trajectories which are strategically linked to sustainability and new economies; and
Strategic interventions (projects, programmes or policies) which will positively support and
contribute to the province’s strategic objectives.
The Provincial Economic landscape
The first chapter of this Economic Growth and Approximately 72% of the population
Development Path provides a high-level overview of is under 34 years of age.
the current economic landscape of Mpumalanga
Province (MP). Mpumalanga has a youthful population Sectors such as Agriculture have lost
with approximately 64% of the population consisting of approximately 20% of jobs between
economically active people (15 to 34 years of age). the 1st quarter of 2009 and 2010.
This provides significant human resources for future
According to the 2007 Community
economic growth and sustainability.
Survey, approximately 23% of the
The labour market characteristics however paint a population has no schooling.
concerning picture. From the 1st quarter of 2009, MP
Manufacturing represents the largest
has been shedding jobs at a faster rate than the
sector in the Province (21%) by value
country as a whole.
add, closely followed by Mining (19%)
The primary, secondary and tertiary
sectors contribute 22.3%, 28.1% and
49.6% respectively.
1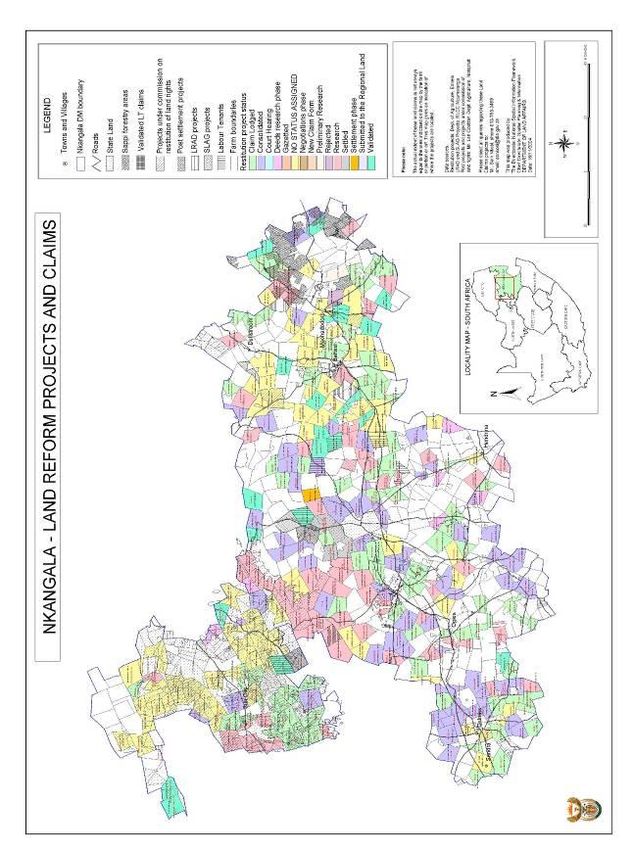
According to the 2007 Community Survey, socio-economic indicators such as annual household
income are lower than that of the country (the most common household income bracket was
significantly lower than the SA average). Urban-rural migration also has the potential to increase the
demand for services in urban areas while inhibiting economic growth in rural areas. The current
economic landscape captured in this document provides a good platform to design, develop and
implement innovative solutions which will boost economic growth and development.

The first chapter of this Economic Growth and Development Path provides a high-level overview of
the current economic landscape of Mpumalanga Province (MP). Mpumalanga has a youthful
population with approximately 64% of the population consisting of economically active people (15 to
34 years of age). This provides significant human resources for future economic growth and
sustainability. The labour market characteristics however paint a concerning picture. From the 1st
quarter of 2009, MP has been shedding jobs at a faster rate than the country as a whole.

According to the 2007 Community Survey, socio-economic indicators such as annual household
income are lower than that of the country (the most common household income bracket was
significantly lower than the SA average). Urban-rural migration also has the potential to increase the
demand for services in urban areas while inhibiting economic growth in rural areas. The current
economic landscape captured in this document provides a good platform to design, develop and
implement innovative solutions which will boost economic growth and development.

The National Economic Growth Path

The second chapter focuses on the National Economic Growth Path and high level Provincial
applications. A focal point of the New Growth Path (NGP) is massive investments in infrastructure as
a key driver of job creation across the economy. According to the National Economic Growth Path
Framework, “the aim is to target our limited capital and capacity at activities that maximise the
creation of decent work opportunities.”

The new growth path considers the infrastructure programme to be a trigger to build a local supplier
industry for the manufacture of the components for the build-programme. Other job drivers include:
labour absorbing activities across the main economic sectors; opportunities in the knowledge and
green economies; leveraging social capital; and rural development and regional integration.

                                                  2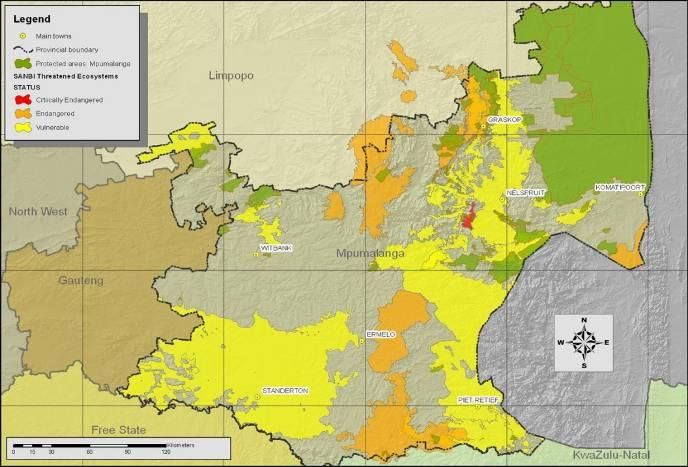
Figure 1: Key Sectors in MEGDP identifies the following sectors, which will assist in job creation:

Figure 1: Key Sectors in MEGDP

The National Economic Growth Path highlighted above closely informs the Mpumalanga Province’s
Economic Growth and Development Path (MEGDP). The focus of job creation in the Agricultural,
Manufacturing, Infrastructure and Mining sectors was previously driven by significant growth in
skilled, knowledge, information and service jobs (non-labour absorbing) and a decline in low skilled,
process and manual work (labour absorbing) jobs. Mpumalanga’s Economic Growth and
Development Path will therefore focus on reversing this trend towards a shared and inclusive
economy.

Mpumalanga Province’s Economic Growth and Development Path (MEGDP)

Mpumalanga has taken an innovative approach to the development of its Economic and
Development Growth Path. Although, the MEGDP is closely aligned to the National Strategy, it
however takes into consideration Mpumalanga’s province-specific comparative and competitive
advantages and the linkages to key provincial strategic objectives.
The primary objective of the MEGDP is to foster economic growth that creates jobs, reduce poverty
and inequality in the Province. The growth path is anchored on a number of parameters including
sector development, Inclusive & shared growth, spatial distribution, regional integration, sustainable
human development and environmental sustainability with clearly defined strategic targets over the
medium to long term.

                                                     3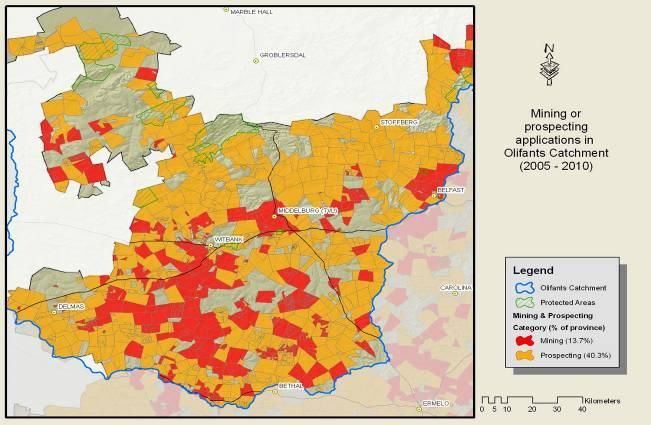
Table 1: Key opportunities per sector in the MEGDP (these are examples of high impact projects and not an
exhaustive list):

                        KEY OPPORTUNITIES IN MP ECONOMIC SECTORS
SECTOR               AREAS OF STRATEGIC OPPORTUNITES
Forestry             Charcoal Production
                     New ventures into community forestry plantations
                     Expansion of Ngodwana Plant
                     Expand Packaging Industry
                     Bio-mass plant at Lomati Mill
Agriculture          Bio-energy production from sugar cane off-cuts
                     SMME and Cooperatives development
Mining               Beneficiation (centralised mining refinery)
                     Re-treatment of sub-economic deposits & dumps
                     Mining of dimension stone
Energy               Eskom New Build Programme (Kusile Project)
                     Re-commissioning of Camden, Komati & Grootvlei power stations
                     Alternative energy production
Manufacturing        Establish capacity for manufacture of smokeless stoves (vesto)
                     Establish a manufacturing plant to manufacture solar cells, then modules.
                     Establish a Centre of Competence for high level skills and high technology
                     focusing on Furniture, Steel and Tooling
                     Innovation Centre (industry sectors e.g. leather/general goods
Tourism and cultural Promotion of wildlife, nature, entertainment, adventure tourism, industrial,
                     township tourism, and cultural heritage
Green Economy        Bio-mass converters for extraction of renewable energy & charcoal
                     Establish Hydro-power plant
Information and      Broadband deployment
Communication        Business Process Outsourcing and Off-shoring
Technology (ICT)
Investing in Social  Promotion of cooperatives, non-governmental organizations, stokvels, burial
capital and Public   societies, etc
Service              HIV control and Management
                     Building a critical mass of skills
Spatial              Rural Development: Identify First and second order nodal development
Development          potential for crowding in investment
                     Provision of infrastructure & housing
                        Regional & International Co-operation: Strategic partnerships with other
                        countries on the continent( strong link & niche role) on many areas such as
                        tourism, agriculture, ICT and transport and logistics, etc.
Infrastructure          New rail development
Development             Revitalize rail freight
                        New Air freight and passenger airport
                        Industrial Infrastructure Development of SEZ in Govan Mbeki

Strategic Interventions to unlock and support the MEGDP

The last section of the MEGDP focuses on specific strategic interventions which, unlock and support
the realisation of the initiatives noted in Mpumalanga’s economic growth and Development Path.
Some of the key interventions include:

                                                    4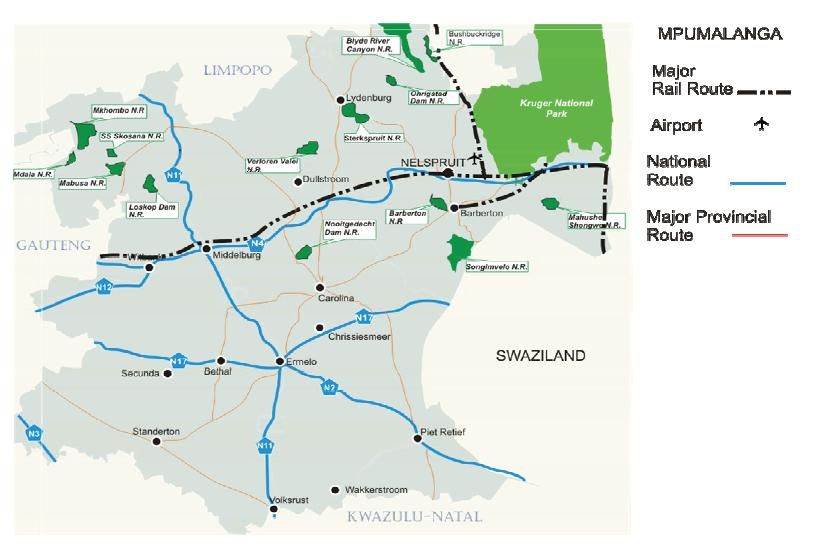
Effective and efficient BBBEEE which empowers previously disadvantaged to positively
contribute to the economy;
Skills development and capacity which is linked to the identified growth trajectories;
Reducing the cost of doing business in MP and barriers to entry;
Increasing MPs competitive advantages and creating appropriate investment incentives;
Support to Cooperatives and SMMEs to ensure sustained development;
Project financing; and
Provision of conducive Infrastructure for economic growth and development (land claims, water
licences, communications, etc).
Concluding remarks
The MEGDP is a dynamic ‘living’ document which will evolve over the next 10 years as the economy
develops and key opportunities which are aligned to the Provinces strategic objectives are identified.
The focal point of this Economic Growth and Development Path is the creation of decent labour
absorbing jobs which will have positive direct, indirect and induced effects on the Provincial
economy and the living standards of its people. Our president Jacob Zuma captured this well in his
inaugural State of the Nation Address in June 2009, when he said:
“It is my pleasure and honour to highlight the key elements of our programme of action. The creation
of decent work will be at the centre of our economic policies and will influence our investment
attraction and job creation initiatives. In line with our undertakings, we have to forge ahead to
promote a more inclusive economy.”
52. MPUMALANGA SITUATIONAL ANALYSIS
2.1 Population
The mid-year population estimates for 2010 indicate that Mpumalanga’s population was 3 617 600.
This is 7.2% of the South African population and makes Mpumalanga the 6th most populous
province, ahead of the North West, Free State and Northern Cape.
Females constituted 1.85 million or 51.2 per cent of the provincial population distribution and males
1.76 million (48.8 per cent). The youth cohort (0-34 years) made up 71.9 per cent of the total
population in the province whilst the age group 15-34 makes up 63.4 percent of the provincial
population. The age cohort of 10-14 years represented the most populous age cohort with 429 300
individuals or some 11.9 per cent of the provincial population. Nationally the most populous age
cohort was the 15-19 years group that represented some 10.5 per cent of the population.
Figure 2: Population Pyramid for South Africa & Mpumalanga
80+ 80+
South Africa Mpumalanga
75-79 75-79
70-74 70-74
65-69 65-69
60-64 60-64
55-59 55-59
50-54 50-54
45-49 45-49
40-44 40-44
35-39 35-39
30-34 30-34
25-29 25-29
20-24 20-24
15-19 15-19
10-14 Youth (0-34 years) = 10-14
Youth (0-34 years) = 71.9%
5-9 5-9
68.6% of total population of total population
0-4 0-4
3,000,000 1,500,000 0 1,500,000 3,000,000 250,000 125,000 0 125,000 250,000
Female 51.3% Male 48.7% Female 51.2% Male 48.8%
Data Source: Statistics South Africa-Mid Year Population Estimates 2010: Own Calculations
The youthful nature of the population is typical to developing economies. It requires a growth and
development agenda that puts an emphasis on the youth for future sustainability. The fact that the
most populous age group for Mpumalanga is lower than that of national, has implications for where
to put more emphasis in terms of interventions and resources in areas such as education, health as
well as social grants as compared to national. Timely interventions within the youth will reap better
long term gains for provincial growth and development.
The population growth rate of South Africa and Mpumalanga declined over the period 2002 to 2010.
During this period, the average annual population growth rate for Mpumalanga was 0.9 per cent
6compared with the 1.2 per cent recorded nationally. In Mpumalanga, although females outnumber
males, the population growth rate of males exceeded that of females in each of the nine years. The
average annual population growth rate for males was 1.0 percent and that for females was 0.7
percent.
2.1.1 Provincial Labour Market Characteristics
Job creation underpins the Mpumalanga Economic Growth and Development Path (MEGDP). A clear
understanding of the Provincial labour market characteristics will assist in identifying potential
structural challenges in the labour market and possible interventions, which will foster employment
creation.
The general labour market characteristics in Mpumalanga are captured in tables 1 and 2 below. The
employment data below is shown in comparison to South Africa as a whole. This is done in order to
provide a benchmark given the high attrition rate of jobs during the 2008 economic down-turn.
Table 2: A Comparison of Employment in Mpumalanga and South Africa
Source: Quarterly Labour Force Survey, Q1 2010, Statistics South Africa
According to table 2 above, employment in Mpumalanga fell in all quarters, except from quarter 3 of
2009 to quarter 4 of 2009 (no change was experienced). The biggest decrease in employment
occurred between Q4/2009 to Q1/2010. During this period the change in employment was -3.3%
compared with the South African rate of -1.3%. This indicates that the province is generally shedding
jobs at a faster rate than the country as a whole (holding all other factors constant such as potential
relief and recovery from the economic down-turn). During the same period (Q1/2009 to Q1/2010),
the Provincial economy lost 3% more jobs than that of South Africa as a whole.
The labour market in Mpumalanga remains under pressure although the economic recession has
lifted. The provincial labour force was stable at 1.2 million individuals between the end of the
second and third quarter 2010. The number of people employed at the end of the third quarter
2010 (890 000) was 9 000 lower than at the end of the second quarter 2010. It was also 18 000
lower than the 908 000 employed at the end of the third quarter 2009. The number of unemployed
increased from 344 000 to 353 000 between the end of the second quarter 2010 to the end of the
third quarter 2010.
7Table 3: Employment by Sector in Mpumalanga
Source: Quarterly Labour Force Survey, Q1 2010, Statistics South Africa
Employment in the informal (non-agricultural) sector dropped by 9% from quarter 1 of 2009 to Q1
quarter 1 of 2010.The largest year on year percentage change was in the agricultural sector. This
sector experienced a decrease in employment of 19.8% over the given time period.
Mpumalanga contributed 6.9 per cent to the national number of employed. The trade sector
(wholesale and retail trade) employed the largest share of individuals in the province at 24.0 per
cent. Community and social services (18.9 per cent) was the second biggest employer followed by
finance (10.0 per cent) and manufacturing (9.1 per cent). The sectors that contributed the least
were transport (4.7 per cent) and utilities (2.4 per cent).
The occupational profile of Mpumalanga was heavily skewed towards semi- and unskilled
occupations. The share of highly educated or skilled occupations (managers and professionals) was
only 9.4 per cent. The share of the category of elementary occupations (unskilled or semi-skilled)
was 26.2 per cent.
Disaggregation according to gender reveals that more males (57.7 per cent) than females (42.3 per
cent) were employed in Mpumalanga. The age group of 30-34 years was the highest represented
among the number of employed with a share of 18.5 per cent. The youth cohort (15-34 years) made
up some 45.9 per cent of the number of employed.
According to Statistics South Africa’s QLFS, 56.1 per cent of the employed found themselves
employed in the urban areas of the province, whereas the remainder (43.9 per cent) worked in rural
areas. The local municipality with the highest number of employed was Mbombela, followed by
Emalahleni and Govan Mbeki.
The unemployment rate in Mpumalanga was 25.5 per cent at the end of the third quarter 2009 and
increased to 28.4 per cent at the end of the third quarter 2010. This was higher than the national
8average, which was recorded at 25.3 per cent at the end of the third quarter 2010. Mpumalanga,
recorded the second highest unemployment rate among the nine provinces after Free State
(29.5 per cent). The province contributed some 8.0 per cent to the national number of unemployed.
The unemployment rate of females (32.0 per cent) was 6.5 percentage points higher than that of
males (25.5 per cent) in the province. Females, with 177 400, contributed some 50.3 per cent to the
total number of employed, although only contributing 44.6 per cent to the labour force. The age
group of 20-24 years was the highest represented among the number of unemployed with a share of
29.0 per cent. The youth cohort (15-34 years) with 258 000 unemployed individuals made up nearly
three quarters (73.2 per cent) of the number of unemployed. The unemployment rate of the youth
cohort was 38.7 per cent, some 10.3 percentage points higher than the provincial average
unemployment rate.
Geographically, the number of unemployed was skewed towards rural areas with 55.2 per cent of
the unemployed in the province found there. The unemployment rate of rural areas at 33.3 per cent
was higher than the provincial rate as well as that of urban areas (24.0 per cent). The local
municipality with the highest number of unemployed was Dr JS Moroka, whilst Emakhazeni was the
municipality with the least number of employed. Although not official, it is calculated that Dr JS
Moroka (58.2 per cent) had the highest unemployment rate whilst Thaba Chweu (9.7 per cent) had
the lowest unemployment rate.
A worrying reality is the long term nature of unemployment in the province with some 70.4 per cent
of the unemployed in Mpumalanga that have been seeking employment for one year and longer.
This was marginally higher than the corresponding national figure of 65.8 per cent, a figure that
emphasises the notion of the systemic and entrenched nature of unemployment in the country.
2.1.2 Reducing unemployment
Three scenarios were modelled to determine where the provincial unemployment rate could be in
the next 10 years, based on historic data. Figure 1 depicts the historic data up to 2010 and the three
scenarios up to 2020. The broken yellow line portrays a continuance of the unemployment rate’s
historic trend in Mpumalanga. According to this scenario the unemployment rate will gradually
decline to approximately 22.2 per cent by 2020. Should, however, the historic job creation trend
(broken red line) continue into the future, the unemployment rate can be expected to hover around
23.5 per cent by 2020. However, the overarching aim, both nationally and provincially, is to
decrease the unemployment rate to 15 per cent within 10 years. This is shown by the broken green
line and is referred to as the required job creation trend.
Figure 3: Historic and forecasted unemployment rate in Mpumalanga, 2000-2020
935%
At the historic trend of job creation, the
unemployment rate should decrease from
30% 28.4% in Q3 2010 to 23.5% by 2020.
Unemployment rate in Mpumalanga 28.4%
25% 23.5%
20% 22.2%
Considering the historic trend of unemployment,
15% the unemployment rate should decrease from
28.4% in Q3 2010 to 22.2% by 2020. 15%
10% At the required trend of job creation, the
unemployment rate should decrease
from 28.4% in Q3 2010 to 15% by 2020.
5%
0%
2000
2001
2002
2003
2004
2005
2006
2007
2008
2009
2010
2011
2012
2013
2014
2015
2016
2017
2018
2019
2020
Year
Historic unemployment rate Unemployment rate @ historic job creation
Unemployment rate @ required job creation Unemployment rate @ historic rate extrapolated
Source: Statistics South Africa – LFS & QLFS & own calculations
10Figure 4: Historic and forecasted employment numbers in Mpumalanga, 2000-2020
1 800 000
At the required trend of job creation,
the number of employed need to
1 600 000 increase by 719 656 in 10 years, or
on average by some 71 966 per year.
Number of employed in Mpumalanga
1 400 000
1 609 656
1 200 000
1 000 000 1 204 406
800 000 890 000
At the historic trend of job creation,
600 000 the number of employed is expected
to increase by 314 406 in 10 years, or
on average by some 31 440 per year.
400 000
200 000
-
2000
2001
2002
2003
2004
2005
2006
2007
2008
2009
2010
2011
2012
2013
2014
2015
2016
2017
2018
2019
2020
Year
Employed @ required trend Employed @ historic trend
Source: Statistics South Africa – LFS & QLFS & own calculations
Over the 10-year period from 2000 to 2010, Mpumalanga did not experience jobless economic
growth. This stems from the fact that the number of employed increased from 818 000 in 2000 to
890 000 by the end of the third quarter of 2010 (Figure 4). By extrapolating this historic job creation
trend into the future it can be expected that the number of employed will increase to 1.2 million by
2020. Under normal conditions based on historic trends, the Mpumalanga economy is expected to
create 314 406 jobs in the next decade. By following this trend, coupled with moderate increases in
the economically active population, the unemployment rate of 23.5 per cent as shown in Figure 1
may be reached by 2020.
Should the province, however, aim for an unemployment rate of 15 per cent by 2020 a much higher
rate of job creation is necessary. This required number of new jobs is depicted as the red area in
Figure 4. According to the outcome of the modelling scenario, 719 656 new jobs is necessary to
reach 1.6 million jobs by 2020 and subsequently an unemployment rate of 15 per cent. This
represents an average increase of 6.1 per cent in the number of employed per annum.
The above analysis of the labour market characteristics provide a clear context as to which sectors
and targets groups the MEGDP should focus on in order to aggressively create new jobs.
112.2 Inequality
South Africa has one of the highest imbalanced income distributions in the world. The national Gini-
coefficient was calculated to be between 0.653 and 0.702 in 2009 depending on the data source
(Table 1). Since 1995 the national level has deteriorated from between 0.640 and 0.674 to the
current levels. The national Government through its outcome approach has targeted the national
Gini-coefficient to improve to 0.59 by 2014. It is evident from Table 2 that the provincial income
distribution (between 0.65 and 0.68) followed the national scenario and became more unequal from
1996 to 2009. The local municipality with the highest inequality was Steve Tshwete (0.69), whilst
Nkomazi (0.59) was the municipality with the lowest inequality.
Table 4: Gini-coefficient measurements for South Africa and Mpumalanga, 1995-2009
Measurement source 1995 1996 2000 2005 2008 2009
South Africa
IES 0.640 - 0.680 0.690 0.679 0.679
AMPS 0.674 0.678 0.682 0.683 0.666 -
GHS – Income - - - 0.712 - 0.702
GHS – Expenditure - - - 0.686 - 0.683
ReX - 0.623 0.650 0.666 0.662 0.653
Mpumalanga
NIDS - Income - - - - - 0.680
NIDS - Expenditure - - - - - 0.650
ReX - 0.606 0.644 0.660 0.659 0.650
Sources: Presidency – Development Indicators, 2010
Global Insight – ReX, 2010
Note: The main data sources used for the calculation of the Gini-coefficient are the Income and Expenditure Surveys (IES) for 2000 and
2005, the General Household Surveys (GHS) for 2005 and 2009, the All Media and Products Surveys (AMPS) for 1993-2008 as well as the
National Income Dynamics Study (NIDS) for 2009. The income sources that are included in the per capita income variable are wage income,
income derived from self-employment, state transfers, private pensions and residual income (i.e. letting property, insurance claims).
2.2.1 Reducing inequality
After the political transition, government social spending per person increased in real terms by
21 per cent from 1995 to 2000 and by a further 40 per cent by 2006. Spending also became much
better targeted. Fiscal redistribution through the grant system has had some success in reducing
poverty. However, fiscal and state capacity sets limits to such redistribution and makes this an
inauspicious tool for future change. The fiscal capacity constraint arises from the fact that grant
spending already constitutes a high proportion of GDP and that such grants need to compete with
other public spending. Transfers also cannot really affect inequality much. Their overall magnitude
is too small, even in South Africa, to have a great effect on inequality measures, despite good
targeting.
Job creation, though crucial for poverty reduction, will also do little to reduce overall inequality. The
weak endowments of those currently unemployed would not assure them of high labour market
12earning. Thus even if they were employed, it would probably be at low wages, thus leaving wage
and hence aggregate inequality high and little affected. In the absence of improved education,
direct interventions to artificially change labour market outcomes also hold little prospect of
improving poverty and distribution and may reduce the efficient functioning of the labour market,
with various possible side-effects.
Decomposition analysis shows that most income inequality originates in the labour market, through
the distribution of jobs and the wage formation processes. Thus change in South African inequality
must start with a reduction of inequality in wage earnings. Without more equal labour market
outcomes, aggregate inequality will remain high and will undoubtedly encourage further direct
labour market interventions in an attempt to affect distributional outcomes. Thus the labour market
is at the heart of inequality, and central to labour market inequality is the quality of education. To
reduce income inequality substantially requires a different wage pattern based on better human
capital for the bulk of the population.
2.3 Poverty
Poverty income is defined as the minimum income needed to sustain a household and varies
according to the size of the household. For example, the monthly poverty income in 2009 for a
household of four, as calculated by the Bureau for Market Research (BMR), was R2 440 and R3 396
for a household of six. The poverty rate then is the percentage of people living in households with
an income less than the poverty income.
In 2009, Mpumalanga’s poverty rate of 46.8 per cent was higher than the national rate of 41.3 per
cent. Mpumalanga’s poverty rate was the fourth highest (worst) among the nine provinces. It was
estimated that 1.75 million of Mpumalanga’s citizens lived in households with an income less than
the poverty income. Over the 13-year period from 1996 to 2009, the poverty rate in Mpumalanga
deteriorated (increased) by 0.8 percentage point, which was more than the 0.4 percentage points at
which the poverty rate increased by nationally.
Among the local municipalities, Mbombela (253 500) registered the largest number of poor
individuals followed by Nkomazi (245 500) and Bushbuckridge (221 000). Mkhondo (70.4 per cent)
recorded the highest poverty rate, whereas Emalahleni (30.1 per cent) recorded the lowest poverty
rate. A shortcoming of the poverty rate as an indicator of poverty is that it does not give any
indication of the depth of poverty i.e. how far the poor households are below the poverty income
level. Here, the poverty gap proves useful in that it measures the difference between each poor
household’s income and the poverty line. It thus measures the depth of poverty of each poor
household. The aggregate poverty gap is calculated by summing the poverty gaps of each poor
13household. It is thus equivalent to the total amount by which the incomes of poor households need
to be raised each year to bring all households up to the poverty line and hence out of poverty.
According to this dimension of poverty measurement, the poverty gap in Mpumalanga was
R5.6 billion in 2009. As might be expected from a country experiencing an economic recession the
poverty gap in South Africa increased (deteriorated) by 1.6 per cent between 2008 and 2009.
Mpumalanga’s (4.4 per cent) poverty gap increased the fastest, marginally ahead of Gauteng that
deteriorated by 4.2 per cent. Over the 13-year period under review, the national poverty gap
deteriorated by 7.9 per cent annually. Mpumalanga’s increase was even worse with a 10.0 per cent
annual deterioration between 1996 and 2009. Bushbuckridge registered the largest poverty gap
with a value of R1.3 billion followed by Dr JS Moroka (R1.2 billion), whereas the poverty gap in
Emakhazeni (R41 million) was the smallest)
Another indicator of poverty levels is the percentage of people living on less than a dollar (US$) a
day. In Mpumalanga, this indicator showed much improvement from a rate of 4.7 per cent in 1996
to 0.9 per cent of the population in 2009. The national figure was slightly better at 0.8 per cent in
2009, however the improvement over the 13-year period was not as large as in the province.
2.3.1 Reducing poverty
In order to reduce the province’s poverty rate from the 2009 level of 47.8 per cent to 25 per cent in
10 years it was calculated that on average 62 100 individuals need to be taken out of poverty
annually for the next 10 years. This equates to approximately 18 400 households whose combined
earnings needs to increase to at least the poverty line every year. It is important to note that once
at this minimum level of the poverty line, the households must be kept at that minimum level for the
remainder of the 10 year period.
In monetary terms the noted number of individuals will require a combined R218 million in the first
year to meet or exceed the poverty line. At 0.8 per cent of Mpumalanga’s provincial budget it may
seem small enough to even consider funding it from government coffers, however, to meet the 2020
poverty rate target of 25 per cent they need to be kept at the poverty line again the following year
together with the next 62 100 individuals. Cumulatively, by 2020 some 620 000 individuals or
185 000 households need be kept at the minimum poverty line with a combined R2.2 billion (8.4 per
cent of Mpumalanga provincial budget).
SASSA, currently distributes social assistance grants in Mpumalanga in the order of R6 billion per
annum to approximately 1 million beneficiaries and, whilst adding more or increasing the monetary
value of individual grants is possible, it appears unsustainable in the long run. It is therefore more
desirable that at least one person in each the 185 000 households benefit from one of the 719 656
14jobs calculated in the unemployment scenario’s. Together with focusing on job creation, through
tools such as public works programmes and employment guarantee schemes, the provincial
government can focus on infrastructure and service provision as well as education and skills
attainment of people in poverty.
2.3.2 Human Development Index (HDI)
HDI level equal to SA by 2020: South Africa’s HDI was calculated to be 0.56 in 2009 and that of
Mpumalanga 0.50. At the current rate of improvement South Africa’s HDI score will be 0.64 by
2020, whereas Mpumalanga’s HDI will be 0.57. To equal South Africa’s HDI level in 2020 three
indicators must improve as follows over next 10 years:
2.3.2.1 Literacy level
Over the period 1996-2009, 40 045 more individual became literate per annum - an improvement of
some 2.1 per cent per annum. In order to catch up to South Africa’s level of HDI by 2020, it is
necessary to achieve an improvement of 3.7 per cent per annum over the period 2010-2020. In
other words, 62 671 more individuals need to become literate per annum to achieve the goal. Such
an improvement necessitates either a doubling of the current expenditure or doubling the efficiency
and effectiveness of interventions that improves basic literacy.
2.3.2.2 Life expectancy
Over the period 2004-2009, the life expectancy in the province improved by 0.2 per cent per annum.
In order to catch up to South Africa’s level of HDI by 2020, it is necessary to achieve an improvement
of 0.7 per cent per annum over the period 2010-2020. Such an improvement necessitates either
three times more expenditure or tripling the efficiency and effectiveness of interventions that
improves life expectancy.
2.3.2.3 Per capita income
Over the period 1996-2009, the per capita income in Mpumalanga improved by 2.3 per cent per
annum or some R346 annually. In order to catch up to South Africa’s level of HDI by 2020, it is
necessary to achieve an improvement of 4.9 per cent per annum or some R1 110 annually. Such an
improvement necessitates either a doubling of the expenditure or doubling the efficiency and
effectiveness of interventions that create sustainable jobs. Should the employment growth of
70 000 net jobs per annum therefore materialise over the next 10 years, the improvement should be
sufficient to help Mpumalanga catch up to South Africa’s level of HDI.
2.4 Resource Analysis
It is imperative to recognise that for any meaningful growth and development, certain fundamentals
need to be in place and these include natural resources such as land, water and biodiversity;
15material resources such as electricity, road and rail infrastructure, ICT and financial services; human
resources such as skills, education, research and development. An analysis of these resources in the
case of Mpumalanga is outlined as follows:
2.4.1 Land
Land Utilization
The Mpumalanga Province covers an area of 76,495 km2 (7,649,460 ha), or 6.3% of the country.
Agriculture is the largest land user, utilising approximately 68% of the Province. Cultivation using
15% and grazing 53% of the land cover. Nature reserves cover 19% and forestry plantations 9% of
the Province. The remaining part of the Province is used by human settlements, water bodies (dams
and pans) and mines.
Figure 5: Land Cover Patterns
Source: MINTEK 2009
16The primary land use requirements in Mpumalanga are for agricultural production, mining,
industries, forestation, ecotourism, private game farming, and protected areas for nature
conservation (Figure 5). The Province is dominated by vast open areas of natural vegetation which
accounts for around 71% of the total land area in the Province. The extent of transformed land
and/or degraded land is reportedly relatively small. Most of the converted land is under some form
of cultivation (26%), including commercial plantations, which comprise 8% of the total area of
Mpumalanga. Urban areas only comprise about 1.25% of the Province which is relatively small.
The continued expansion of agricultural, mining and industrial activities in the Province have
impacted on the biodiversity of the region through land clearing, deterioration of soil quality,
erosion and contamination. Since land is a limited resource, demand for land will become more
competitive in the years to come and measures have to be put in place to regulate and balance
economic growth priorities, with population growth requirements and the preservation of the
environment.
It must be noted that about 70% of all the arable land in the province is under claim. There is a need
to pay attention to the land reform legislation to expedite all the backlogs in land claim in the
province. The question of land availability is a serious concern in the province and land remains one
of the critical means of production, and should be given attention. The ownership patterns of
strategic land in the province are in private hands. This inhibits the state’s capacity to influence
development aimed at the poor and previously disadvantaged. There is a need for the province to
embark on a process of empowering the state by proactively acquiring strategic land and use it as a
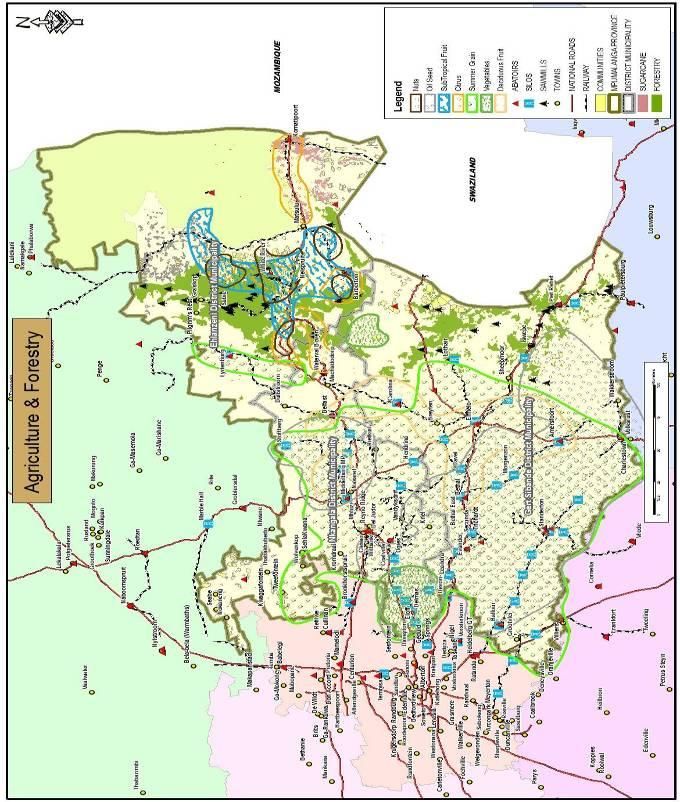
tool to foster economic development. The maps below show the land claims in the province per
district.
17Figure 6: Land claims- Ehlanzeni District
18Figure 7: Land claims- Nkangala District
19Figure 8: Land claims- Nkangala District
20Land tenure on traditional land is also a key challenge that needs to be addressed. Land tenure
reforms in rural areas could unlock dormant capital and be an incentive as well as a source of
empowerment for communities.
2.4.2 Water
As a semi-arid country, South Africa is faced with a critical situation with regard to its water
resources. The long-term preservation and sustainability of ecosystems, communities and economic
activities depends on the continued availability and accessibility to fresh water sources, principally
obtained through rainfall (precipitation), surface flow (rivers) and groundwater. According to the
Department of Water Affairs (DWA) maintains that all three of these sources, which are intimately
linked in the hydrological cycle, are currently under stress.
The annual precipitation varies from less than 500 mm in the eastern Lowveld and 700 mm in the
western Highveld to more than 1 100 mm in the escarpment. Water is acknowledged by the
Provincial Government as a scarce resource and there is concern that there has been a general
decrease in water quality and quantity over the past few years. Water quality indicators indicate an
increase in surface water nutrients which portray a potential for enrichment, which could
compromise riverine eco-systems and human health. The most significant impacts on water quality
are a result of mining, malfunctioning sewage treatment works and soil erosion from various
practices especially agriculture and urban and rural development projects.
With regards to water quantity, the water resources in all the catchments in the Mpumalanga
Province, with the exception of the Sabie River and upper Usutu, are over committed with current
demands on the available water outstripping the water available in the system. New development
initiatives must consider the water availability prior to engaging in unsustainable developments with
high water demands.
Mpumalanga is the source of four of Southern Africa’s major river systems with as much as 53% of
the Province drained by the Olifants River System, the Orange River System (Vaal River), Nkomati
River System (Crocodile, Sabie, Sand and Komati Rivers) and the Pongola River System (Usutu River).
Water resources are controlled and regulated within four Water Management Areas (WMAs) – the
Olifants, Nkomati, Usutu and Upper Vaal WMAs. The Mpumalanga provincial boundary runs
variously through each of these WMA. The entire Inkomati WMA sits within the provincial boundary
whereas approximately 50% of the Olifants WMA (the southern portion) resides within
Mpumalanga. Around 15% of the upper Vaal WMA (the upstream Vaal Dam sub-WMA) and 20% of
21the Usutu WMA (Upper Usutu sub-WMA) reside within the provincial boundary. There are
pronounced differences in water availability within each WMA. DWA estimates, the Olifants and
Upper Vaal WMAs to be under stress, while the Inkomati and Usutu WMAs have available water
resources per capita above these two.
The Olifants WMA, as much as 47% of water available is derived from surface resources, 30% is
made available from transfers into the WMA, and 11-12% from return flows and groundwater. Large
transfers exist from both the Usutu and the Inkomati WMAs into the Upper Olifants sub-WMA for
power generation. Transfers into the Middle Olifants sub-WMA are from releases from Loskop Dam
to downstream users.
Within the Inkomati WMA surface water contributes 88% of water availability and return flows
about 9.5%, mainly from irrigation (75% of total return flows). A very small contribution arises from
groundwater (1%) and only 1.5% from transfers into the WMA. In the Upper Usutu sub-area, surface
water contributes 96% of water available while the upstream Vaal Dam sub-area has water
resources available from both surface water (51%) and from transfers into the area (39%). Within
Mpumalanga, the greatest volume of water available per annum (412 million m3 per annum) can be
found in the Upper Olifants sub-area, followed by the Crocodile with 339 million m3 per annum. The
smallest volume of water available per annum in the province is in the Steelpoort sub-area. Water
availability within a catchment or sub-WMA must however be assessed in light of the demand
placed on that water by users. This gives an indication of the stress under which the catchment is
placed.
22Figure 9: Water management areas under stress
Source: MINTEK 2009
According to DWA, Water use in South Africa is dominated by irrigation. This is also true for
Mpumalanga as 46% of its water is required for irrigation. This demand for water is localised in a
23few of the WMAs, as is the demand for water for power generation. Water use for agricultural
purposes is unevenly distributed throughout the WMAs. The second largest requirement for water is
for ‘transfers out’. Water resources in Mpumalanga are therefore important in supplying water to
neighbouring catchments and WMAs. The issue of water sharing, both internationally with
Mozambique and Swaziland as well as internally (between provinces) is extremely important, and
one which requires careful management. The issue of water trading as well as water use licensing
need to be given attention for the Mpumalanga government to realise its growth trajectory.
Use of water in the urban sector in Mpumalanga is slightly less (8%) than the requirements for the
whole of South Africa (11%), while the requirements of the industrial, forestry and mining sectors
are the same as those of South Africa (8%).
It is evident that in the Olifants WMA, irrigation is the biggest single user of water resources while
power generation (dominant in the Upper Olifants) accounts for about 17% of total requirements,
then mining, urban and rural. Sixty percent of irrigation requirements are from the Middle Olifants
sub-area and 20% from the Lower Olifants. Almost all (82%) of water for power generation is
required in the Upper Olifants sub-area, with the remainder in the Vaal sub-area. As much as 97% of
transfers out of the Olifants WMA occur from the Upper Olifants sub-area.
In the Inkomati WMA, irrigation is the biggest single user of water resources, followed by
afforestation – which accounts for 17% of the WMAs water requirements. Irrigation and
afforestation are the biggest users of water in the Komati West, Crocodile and Sabie sub-areas.
Around 46% and 38% of total irrigation requirements are from the Crocodile and Komati North sub-
areas, respectively. Irrigation requirements in the Komati North area are followed by transfers out.
This amounts to 35 million m3 per annum which flows into Mozambique. Transfers to the Olifants
WMA from Komati West are for use in power generation. Transfers out of the Crocodile sub-area
flow across the border to Mozambique (28 million m3 per annum).
The Upper Usutu sub-WMA is dominated with large transfers to the Upper Olifants sub-area for use
in power generation. Afforestation accounts for 23% of total water resources required in the area,
followed by irrigation and the urban-rural sectors. In the Upstream Vaal Dam sub-area, mining
accounts for 38% of total water requirements. This is followed by the urban sector, requirements for
power generation and transfers out, which each account for 15% of total requirements.
Requirements for irrigation follow with 11% (DWA).
24You can also read