Mud Bay's Good Jobs Journey - Zeynep Ton and Katie Bach
←
→
Page content transcription
If your browser does not render page correctly, please read the page content below
18-190
                                                                                                         February 19, 2019

Mud Bay’s Good Jobs Journey
Zeynep Ton and Katie Bach

In May 2018, Marisa Wulff, co-CEO of Mud Bay, a chain of 45 pet stores in the Pacific Northwest,
took the stage at Mudstock, an annual day of team-building, learning and fun for all Mud Bay
employees, known internally as “Muddies.” The theme that year was the 1980s. Dressed in pink
leopard-print pants, black biker boots, fingerless gloves, and a pink mohawk, Marisa told the crowd,
“As employee owners, we should all have an understanding of the financials of Mud Bay.”

Mud Bay had introduced an Employee Stock Ownership Plan (ESOP) in 2015 as part of an integrated
effort to create good jobs and a great customer experience—and to position Mud Bay to live beyond
the hands-on ownership and leadership of its three founders (Marisa, her mother Elsa and her brother,
co-CEO Lars). Employee ownership was intended to make Muddies think, feel, and act like company
owners and to give them a long-term stake in Mud Bay’s future. As Marisa went through the financials,
she pointed to strong sales and customer affection, but then highlighted a weakness. Since 2014, Mud
Bay had increased wages, benefits, and training while also reducing prices. Net profit margins had
fallen from 2.18% in 2014 to 1.99% in 2017. “Profit itself is not a goal,” Marisa concluded, “but it’s
critical to our mission.”

As Mud Bay’s cross-functional annual planning team had struggled to squeeze an adequate level of
profit out of the 2018 budget, Chief Operating Officer (COO) Tracy Yamane had proposed an idea to
raise operating margins: close stores an hour earlier. Monday through Saturday, Mud Bay stores were
open from 9:00am to 9:00pm. Closing earlier would better meet Muddies’ needs outside of work and
would generate labor savings. Tracy had raised this idea several times over the past couple of years.
Marisa had supported it. Lars, however, had strongly opposed it.

This case was prepared by Katie Bach, Managing Director of the Good Jobs Institute, and Associate Professor Zeynep Ton.
Copyright © 2019, Zeynep Ton and Katie Bach. This work is licensed under the Creative Commons Attribution-
Noncommercial-No Derivative Works 3.0 Unported License. To view a copy of this license visit
http://creativecommons.org/licenses/by-nc-nd/3.0/ or send a letter to Creative Commons, 171 Second Street, Suite 300, San
Francisco, California, 94105, USA.
MUD BAY
Zeynep Ton and Katie Bach

The Pet Store Industry
In 2017, there were 18,370 pet stores in the United States. Total sales from pet stores, including online
pet food and supply sales, were $25.2 billion, with $29.4 billion expected by 2022. Traffic to many
brick-and-mortar pet stores was under pressure from grocery stores, mass retailers such as Walmart and
Costco, and online stores that offered greater convenience and, frequently, lower prices (Exhibit 1).

More people were owning pets and willing to spend more on them. In 2018, 68% of U.S. households
owned at least one pet. Natural and organic pet products, once a niche segment, were now produced by
major food manufacturers such as Nestlé and Mars. Millennials, who accounted for more than a third
of all pet owners,1,2 spent more money than any other age group on their pets and were more likely to
pamper their “fur babies” with cashmere Ralph Lauren dog sweaters, CBD-infusedi gluten-free dog
treats for anxiety, mud baths, and “pawdicures.”3

PetSmart, the largest U.S. pet store chain—with more than 1,600 stores, including 117 in Canada—had
been owned by a private equity firm since 2014. Stores ranged from 12,000 to 27,500 square feet,
carried more than 11,000 products, and provided services such as in-store boarding, grooming,
obedience training, and veterinary. From 2013 to 2018, PetSmart’s revenue declined at an annualized
rate of 0.9%. This decline was driven by decreased in-store traffic and increased online competition,
but was partially offset by higher sales of premium products and increased sales of services.4 In 2017,
PetSmart acquired Chewy, an online specialty pet food and supply retailer, for $3.4 billion.

Like PetSmart, Petco, the second largest U.S. pet store chain, was privately owned. Petco operated
1,552 stores in 2018, including 80 smaller-format “Unleashed by Petco” locations that focused on
natural, organic, premium products. In its larger stores, which averaged 14,000 square feet, Petco
offered up to 10,000 products. As of 2015, its Unleashed stores averaged 5,000 square feet and carried
5,000 to 7,000 products.5 Between 2013 and 2018, Petco’s revenue grew at an annualized rate of 1.7%,
driven in part by sales of premium products.6 As Petco struggled to achieve strong organic growth, it
turned to acquisitions. In 2015, Petco acquired online pet supply company Drs. Foster and Smith. In
2017, it acquired PetCoach, an online platform that offered on-demand advice from veterinarians, vet-
recommended food and supplies, and pet health educational resources. And in 2018, Petco partnered
with JustFoodForDogs, a company that provided hand-crafted pet meals with ingredients certified for
human consumption. JustFoodForDogs planned to run exhibition kitchens and fresh food pantries in
hundreds of Petco stores, where customers and their pets could watch chefs prepare dishes such as
venison and squash.7 (Exhibit 2 provides financial and operational data for PetSmart and Petco from
2010 to 2014.)

i
    CBD stands for cannabidiol, a naturally occurring cannabinoid constituent of cannabis.

February 19, 2019                                                                                       2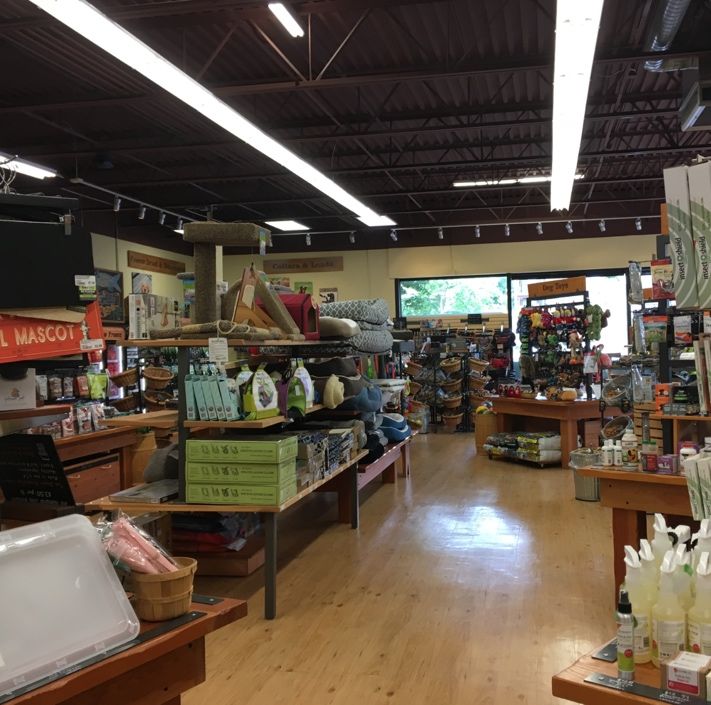
MUD BAY
Zeynep Ton and Katie Bach

Mud Bay’s First Two Decades
In 1988, Elsa Wulff bought a small farm store on a hill above Mud Bay outside Olympia, Washington.
The store sold a wide variety of items, including local oysters, pop tarts, folk art, hog feed, and dog
food. Elsa believed that she had a duty to graciously help everyone, even if it didn’t result in a sale, and
tried to create an environment in which everyone would feel welcome. Customers loved warming their
hands over the wood stove, but in its first full year of operations, Mud Bay lost $46,000 on sales of
$277,000. In 1989, Elsa’s son Lars left the mountain cabin where he had been working on a novel to
join his mother, becoming Mud Bay’s third employee. In 1993, Elsa’s youngest daughter Marisa
returned to Olympia after completing her MBA in Holland and began moonlighting at Mud Bay while
working full-time for Microsoft.

Believing that success would require focus, Elsa, Lars, and Marisa narrowed Mud Bay’s assortment,
gradually eliminating almost everything but products for dogs and cats. The store offered the healthiest
foods and highest-quality supplies the Wulffs could source, including homemade organic dog cookies
they made at a local bagel bakery they rented on Friday nights. They also realized that customers needed
information just as much as they needed high-quality food, so Mud Bay began training store employees
on dog and cat nutrition and produced educational booklets for customers such as “How to Read a Pet
Food Label” and “Natural Flea Prevention.”

In 1999, the company had developed a reputation as a pioneer in the nascent category of natural pet
retail. Then, in 2000, Mud Bay bought eight stores from a court-appointed receiver charged with
winding down the Pacific Northwest’s largest chain of home-grown pet stores, Bosley Pet Food Marts.

Unable to compete against the surging national chains, Bosley’s had spiraled into insolvency under the
pressure of declining sales and poor management. After purchasing its assets, Mud Bay transformed
Bosley’s conventional full-line pet stores into natural dog and cat food stores by eliminating products
that didn’t meet its standards, slashing the number of SKUs, and focusing on staff training and customer
experience. After two challenging years, Mud Bay was again a profitable company, now with 85
employees and nine stores.

Once Mud Bay had achieved profitability—and years before it had repaired its balance sheet enough
to secure additional bank financing—the company began to look forward again, improving and
expanding its nine stores and starting to open new locations, first in Washington and later in Oregon.
As the years passed and the company grew, Elsa retired, and Lars and Marisa, now co-CEOs, began to
focus on codifying and articulating Mud Bay’s mission, values and culture. Increasingly, Mud Bay’s
three-part mission—1) contributing to the health of dogs and cats, 2) contributing to the happiness of
people who care for animals; and 3) building a strong company that we’re proud of—became its
spiritual mainspring (see Exhibit 3).

February 19, 2019                                                                                         3
MUD BAY
Zeynep Ton and Katie Bach
Mud Bay in 2014
By the end of 2013, Mud Bay operated 27 stores, earned $1.05 million profit on $38.4 million in annual
revenue, and had 261 employees, 225 of whom worked in stores. Roughly 60% of revenue came from
pet food products, the balance from pet supplies. Comparable store sales—sales from stores open more
than 12 months—grew by 12% in 2013, after averaging below 4% in 2011–2012. Margins were in the
low single digits. Lars and Marisa were comfortable with tight margins because they saw the business
as being highly predictable. (See Exhibit 4 for Mud Bay financials.)
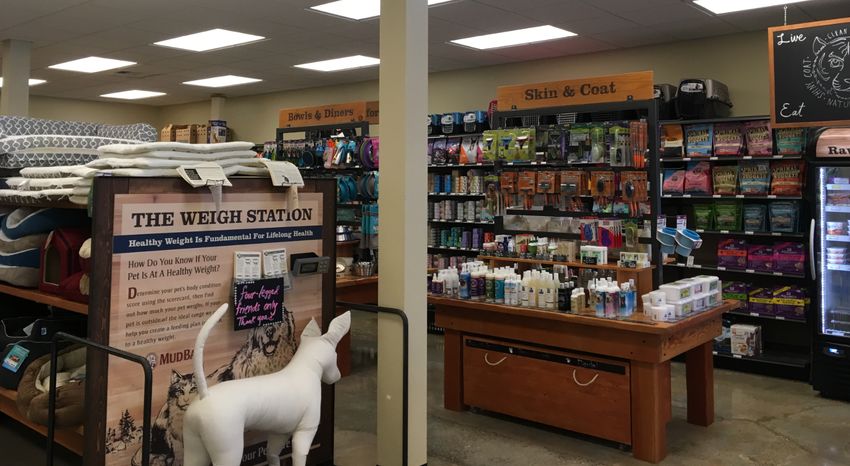
A typical store was just over 4,200 square feet, with around 3,750 SKUs. The layout allowed for easy
self-navigation. Most non-food merchandise, such as dog collars and cat litter, was on tables and stands,
while food lined the walls. Large signs, visible from anywhere in the store, marked product categories.
On shelves behind the registers Muddies stocked dozens of food and treat samples, and there were large
bins of dog treats on the floors, where dogs could help themselves. (See Exhibit 5 for store photos.)
Customer Experience (“The Mud Bay Experience”)
Mud Bay’s go-to-market strategy was encapsulated in the nine elements of a statement dubbed the
“Mud Bay Experience.” (See Exhibit 3.) Creating the Mud Bay Experience for every dog and cat owner
who walked in the door was the over-arching goal of all Muddies, both in-store and in support roles.
At the heart of Mud Bay’s service offering was consultative selling. All Muddies received extensive
training in dog and cat health and behavior as well as in the products Mud Bay carried, and engaged
customers in detailed conversations about their pets’ needs. Customers would often come to Mud Bay
with a question before going to their vet.ii “Our staff has the reputation of being the best trained in
nutrition and dog and cat behavior in the nation, and people trust us,” Marisa said.
Muddies would do anything reasonable to help pet owners, irrespective of its impact on revenues, in a
warm welcoming environment. To help pet owners find the right solutions, Muddies provided free
product samples and free information, reached out to colleagues or did independent research, and even
sent pet owners to other retailers. As one Muddy said, “Whatever we can do to help the customer or
their animal, we’ll do it. It isn’t about sales.” Muddies developed personal relationships with many of
their regular customers—human as well as canine and feline.iii They frequently played with pets that
came in, and, after checking that they didn’t have allergies, offered them treats. First-time visitors to
Mud Bay (known internally as “FTVs”) received a “first-time visitor thank you pack” with a
handwritten note on nice stationary, a “Welcome to Mud Bay” brochure, and a $5.00 coupon.
Mud Bay was committed to offering the highest-quality products, from companies that took pet health
as seriously as Mud Bay, at low prices, every day. Mud Bay staff visited the manufacturing plants for
ii
Muddies were careful not to offer veterinary advice or to contradict the recommendations of a customer’s veterinarian.
iii
Most of the animals that visited stores were dogs, but a few unusual cats made regular store visits as well.
February 19, 2019 4MUD BAY Zeynep Ton and Katie Bach all food products, even as far away as New Zealand, conducting in-depth interviews with plant and brand managers to assess quality control processes and ingredients. “We are not going to drag the market price down, but we never want price to be a reason someone doesn’t shop with us,” said Marisa. Mud Bay did not offer promotions and had no loyalty program, though they would honor the loyalty programs of brands they stocked, if customers asked. Employee Experience Lars and Marisa had long been committed to creating a great place to work and building a culture of openness and support. By 2014, Mud Bay had a five-member executive team (Lars, Marisa, COO Tracy Yamane, CMO Al Puntillo and Chief Financial Officer Mike Becker), and a shared commitment to creating a great place to work was one of the key principles around which the team aligned. Many Muddies began as customers, and were attracted to Mud Bay’s culture, as well as to its mission and customer promise. A generous staff discount and the ability to bring dogs to work (as long as they played well with others)—helped Mud Bay recruit people who loved dogs and cats. Pay and benefits. For many years, Mud Bay’s practice had been to pay at or below market rate. Mud Bay had embraced this approach after reading Jack Stack’s The Great Game of Business, a popular book for leaders of employee-owned companies and practitioners of open-book management. Lars said that what he learned from this book, and others like it, was to “keep your wages below market, so you can keep your overhead below your competitors’. And keep sharing profits. So it’s not an entitlement, but you share the fruits when they’re there.” In January 2014, Mud Bay’s starting wage was $10.25/hour (up from $9.50/hour in 2008), nearly a dollar higher than the $9.32 minimum wage in Washington and just below the $10.30/hour median wage for U.S.-based salespeople. Muddies who worked more than 30 hours a week (69% in 2014) were eligible for medical insurance, but high co-pays and deductibles kept participation rates fairly low. Work schedules. Store managers worked to accommodate staff members’ scheduling needs and wishes and tried to provide work schedules at least two weeks in advance. Career paths. In 2014, about 65% of store manager positions were held by Muddies who had been internally promoted. There were five levels of store employees, with increasing managerial responsibility. Store managers could be promoted to district managers, who oversaw an average of seven locations. Transparency and profit sharing. In the early 2000s, Mud Bay adopted open-book management, sharing financial data and strategic plans with all Muddies and giving them a stake in overall performance. Each year, the company aimed to distribute 1% to 5% of compensation in direct profit- sharing to employees, with the actual amount determined by company performance and pro-rated to an employee’s salary or hourly wage. From 2012 to 2014, Mud Bay shared around 6.1% of wages through its gainsharing (profit sharing) program. February 19, 2019 5
MUD BAY
Zeynep Ton and Katie Bach

Job design. Muddies not busy with customers were expected to perform all non-managerial tasks,
including shelving and restocking, building displays, making samples, cleaning (including back rooms
and bathrooms), and creating signage. After customer service, inventory management took up the most
time; stores received up to nine deliveries a week.

Performance management. All Muddies received quarterly or biannual performance reviews from
their direct managers. Each was rated on a 1–5 scale, based on the extent to which the manager felt the
employee had fulfilled the expectations of his or her role. Higher ratings brought higher raises. Store
managers and staff did not receive bonuses based on their own store’s performance. All Muddies were
eligible to earn gainshares based on the performance of the company as a whole. COO Tracy, store and
district managers reviewed daily reports on business metrics, the most important being sales versus
budget, sales growth versus the previous year, and the number of First-Time Visitors that had been
identified and logged, but numbers were not the highest priority. Tracy and store and district managers
used metrics to gain insight and identify stores or areas to investigate further, but they primarily focused
their efforts on the quality of customer-staff and staff-staff interactions and on stores’ effectiveness at
critical tasks and processes.

Mud Bay’s Good Jobs Vision
In 2014, Mud Bay’s sales performance was strong, but the company was falling short of the executive
team’s aspirations to make the company a great place to work. Staff turnover was 48%—relatively low
for retail, but high at a company where expertise was so valued. Tracy, who had joined as COO in 2011,
insisted that to hire and retain the right people, Mud Bay had to raise wages. “People felt they didn’t
have to be leaders because of what they were getting paid,” she argued. However, low profit margins
made it hard to justify higher pay.

In the spring of 2014, Mud Bay’s executive team had aligned on a way out of this dilemma: Mud Bay
would first invest in higher pay and better benefits, and then look to pay for the investments through
stronger sales growth and reduced expenses. It would not be easy, and it wasn’t without risk. Increasing
employee productivity and contribution would require significant changes in how Mud Bay ran its
business, from merchandising to store operations to staffing to the home-office–store relationship.

Lars believed that for such a large organizational change to succeed, Mud Bay would have to undertake
a high-impact and high-involvement change process. With input from the rest of the executive team,
he created the curriculum for a series of eight weekly small group discussions. Every store manager
together with every member of the home office was assigned to one of the small groups, a total of 67
Muddies in all. Over eight weeks, Muddies explored many of the key choices retailers make and how
they could make them to improve jobs and raise productivity and contribution (see Exhibit 6).

After eight weeks of discussions, participants elected six store managers, six home office employees,
and three district managers to join the five members of the executive team as part of a 20-person

February 19, 2019                                                                                         6
MUD BAY
Zeynep Ton and Katie Bach

strategic planning team (later named “The Twenty”). The group was charged with developing a “Good
Jobs Vision” (GJV) for Mud Bay.

In July, The Twenty met for a two-day workshop. Lars told them, “This is a journey and like most
significant journeys, it’s impossible for any of us to say at the beginning exactly how the journey is
going to go.” Over two days, The Twenty defined a compelling vision: “By 2017, Muddies will
continuously improve, own, and operate one of the best loved retailers in the Pacific Northwest.” They
also identified five specific “strategies” Mud Bay would employ to realize its vision: (1) invest in staff,
(2) deliver more by offering less at everyday low prices, (3) standardize processes and empower staff
through continuous improvement, (4) improve effectiveness by cross-training and operating with slack,
and (5) partner with organizations that contribute to the well-being of animals. After The Twenty had
defined their vision, the executive team built a 2014-2017 strategic roadmap that identified the key
initiatives Mud Bay would use to advance each of the five strategies and realize its vision (see Exhibit
7).

Communicating the Vision
At the end of July, Mud Bay shared with the entire company a document describing the vision and the
five strategies. It stated: “We will continue to involve Muddies in the more detail-oriented decisions
that follow. Our approach will be to give those who are closest to the action or have the greatest insight
the lead role in making decisions. This means, for example, that store leadership teams will play a lead
role in standardizing processes and deciding how to empower staff.” It also described how Muddies
would learn more about the Good Jobs Vision through online training and at Mudstock, and it
encouraged staff to call members of The Twenty if they had questions. The next month, Muddies
gathered for their annual Mudstock. They were generally excited about the Vision but also had several
concerns about how customers would react to being offered less and how standardization, especially if
done without store input, could hinder the creativity and individuality of each store (see Exhibit 8).

As company leaders implemented the changes called for in the Vision, they tried to communicate
regularly and get feedback on what they were doing through Mudstock, Mud Bay’s internal blog, town-
hall style meetings, annual plan descriptions, and year-end look-backs. Lars explained: “We were
integrating the language of our Good Jobs Vision and strategies into everything we were
communicating to the company. We were making it clear to the company that this wasn’t simply a one-
time event. This was actually now becoming part of Mud Bay.” Marisa added: “It’s wasn’t one big
initiative. It was, ‘How can we continually improve our company with the GJV?’ So, you are doing
small things all the time, explaining why, and then collaborating on the how.”

Changes Planned and Changes Made from 2014 to 2017

With so many initiatives on the roadmap—and with so many other initiatives being suggested at
meetings of The Twenty and at Mudstock—Mud Bay had to prioritize. In 2015, the company invested
in staff through higher wages, an increase in the percentage of Muddies eligible for medical insurance,

February 19, 2019                                                                                         7
MUD BAY
Zeynep Ton and Katie Bach

implementing an ESOP, and introducing a new training curriculum. It reduced the number of SKUs,
launched category teams and lowered prices; made some progress in standardization; and made a lot of
progress partnering with pro-animal organizations. Through 2018, Mud Bay continued to make changes
and launch initiatives that aligned with its five strategies, progressing well in some and falling short on
others, especially standardizing processes, creating a culture of continuous improvement, and operating
with slack. (See Exhibit 9 for a timeline of changes.)
Strategy 1: Invest in Staff

Pay and benefits. In August 2014, Mud Bay began to raise hourly wages twice a year in $.50
increments in addition to yearly wage increases tied to annual performance reviews (an average of
$0.50). From 2014 to 2017, the average hourly wage of most hourly staff had increased from $11.50 to
$15.00, an annual investment of $1.5 million, not including payroll tax. Mud Bay’s starting wage at the
end of 2017 was $13.50. (See Exhibit 10 for average wage data.) As average and starting wages
increased, two new compensation issues emerged: 1) Was there enough gap between the rates of pay
for new hires and long-term Muddies? (wage compression); and 2) Was it fair to use the same pay
scales in areas with widely differing costs of living?

Mud Bay increased the percentage of medical insurance-eligible Muddies by reducing the number of
part-time positions, creating “shared key holder” positions that allowed Muddies to work at multiple
stores, and redistributing the hours of Muddies who left the company to existing employees first before
hiring anyone new. By 2017, 82% of employees were eligible for medical insurance. To increase the
percentage of eligible Muddies who actually signed up for medical insurance, Mud Bay increased its
contribution percentage and switched to plans with lower deductibles and copays. In 2015, Mud Bay
established an Employee Stock Ownership Plan (ESOP) that granted ownership stakes annually to
every Muddy who had worked more than 1,000 hours. Muddies were 20% vested after two years and
fully vested after six. In 2017, Mud Bay introduced an Employee Assistance Program (EAP), giving
Muddies and their families free counseling on personal issues such as finances and mental health. By
the end of 2017, the company had not, however, implemented an 401(k) match program, paid
maternity/paternity leave, or pet insurance as it had hoped to.

Training. Beginning in 2015, the training of new staff members evolved from a day-long classroom
session to a self-guided, video-based “first year journey,” supplemented with on-the-job practice and
feedback from more tenured Muddies. When they had free time at work, new staff were expected to
watch short videos on dog and cat health, nutrition, and products. More senior staff could watch new
videos to stay up-to-date on the latest products and health news. Mud Bay also began formally investing
in leadership development. In 2016, it launched a “District Manager in Training” program, which
involved ride-a-longs and one-on-one coaching with existing district managers for select store
managers. In 2017, Mud Bay began teaching its company approach to leadership to every Muddy who
had supervisory responsibilities. The program consisted of seven all-day workshops, delivered once per
month for seven months to cross-functional leadership cohorts composed of ten to fifteen Muddies. The
curriculum was developed by Mud Bay’s Co-CEOs, its newly hired Chief People Officer and its

February 19, 2019                                                                                         8
MUD BAY
Zeynep Ton and Katie Bach

Learning & Development leader, and it was based on a vison of Mud Bay leadership to which more
than a hundred Muddies had contributed their thoughts. (See Exhibit 11.) In 2017, Mud Bay also began
offering workshops focused on workplace harassment training and on diversity and inclusion.
Strategy II: Deliver More by Offering Less at Everyday Low Prices

In September 2014, Mud Bay solicited “Stop Doing” suggestions through blog posts and Survey
Monkey in order to create time and free up resources to work on the GJV. The adopted changes included
discontinuing faxing and accepting checks, and rejecting special orders on brands that were not part of
the assortment. In addition, Mud Bay took three other steps.

Simplifying assortment. Mud Bay reduced its number of active SKUs from 3,750 to 3,375 in 2015
and to 3,180 by 2017, primarily by eliminating redundant products; for example, carrying two rather
than three sizes of the same dog food. “It reduced the overall workload and knowledge requirement
from the staff,” Al said.

Category expert teams. To ensure Mud Bay carried the right products, Mud Bay gave store staff a
greater voice in product selection. Historically, product introductions and withdrawals were managed
by a four-person home office category team. Stores’ involvement was limited to emailing category
teams with questions or comments on products, including customer objections when products were
discontinued, and voting on new products at Mudstock, where manufacturers set up displays. In 2015,
Mud Bay created “Category Expert Teams,” made up mostly of store managers and staff, to advise
category managers on which products to add and which to eliminate.

Reducing prices. When Al joined Mud Bay as its first chief merchant in 2013, he found that despite
the company’s stated commitment to everyday low prices, Mud Bay’s prices for certain products were
higher than its competitors. Late in 2014, Mud Bay started putting its money where its mouth was,
systematically reducing prices and compressing its gross margins.
Pillar III: Standardize Processes and Empower Staff through Continuous Improvement

Standardizing processes. Mud Bay made some progress in standardizing the processes for customer
returns, special orders, unloading and putting away merchandise, and managing inventory expiration
dates. Stores were encouraged to lay out their register counters in the same way—for example, putting
scissors in the same drawer in each store—to help district managers and staff who took shifts in multiple
stores work more efficiently. In 2017, Mud Bay created a training for the delivery drivers who worked
for the company’s distributors in order to standardize how warehouse crews built pallets for delivery,
where delivery drivers left merchandise within stores and how Mud Bay prepared items for reverse
logistics. Drivers were also introduced to a message board where they could leave and receive notes if
there was an issue. Standardization of shared delivery processes cut the percentage of problem
deliveries almost in half, from 8.6% in 2016 to 4.8% in 2017. In 2017, Mud Bay improved the way it
asked staff for input into store schedules, enabling Muddies to indicate not only the hours they were
available to work but also those they preferred.

February 19, 2019                                                                                       9
MUD BAY
Zeynep Ton and Katie Bach

Much had been accomplished in a few busy years. Still, in the summer of 2018, Mud Bay’s leadership
strongly believed that much more needed to be done. Lack of standardization in some processes and
practices sometimes led to confusion and inefficiency, and, despite annual hand wringing, Mud Bay
had made no improvement in inventory adjustments, which cost the company 1.2% of sales in 2017.
At least part of this cost, it was believed, could be attributed to unstandardized inventory processes.

Mud Bay also had much work still to do on standardizing its people practices. In 2017 alone, Mud Bay
hired over 200 new store staff. All stores still did their own hiring, from soliciting applications to
making offers. Managers found their ownership of hiring empowering, but the unstandardized process
was inefficient and sloppy: many applicants never heard back after submitting an application. This was
particularly problematic because most job applications were current Mud Bay customers. In 2017, Mud
Bay hired a Chief People Officer, Michelle Markus, who, among other things, would work on
strengthening recruiting efforts, standardizing hiring practices and developing clearer career paths,
articulating what skills were required for each position and offering position-specific training.

Empowering through continuous improvement. The strategy Mud Bay had the greatest difficulty
getting traction on was empowering staff through continuous improvement. By 2018, Mud Bay still
had not implemented an idea system. As Al explained, “Stuff bubbles up and I feel like we are a
continuous improvement company, but we don’t have a solid structure around it.” Some of the store
staff had another explanation. According to Mark Lipke, a district manager who joined Mud Bay in
2008: “We haven’t been yet been able to harness our slack. The idea of GJV was to create space for
your staff and teams to have time to think about how to do their jobs more effectively and we haven’t
been able to do that systematically yet.”

For the most part, the standardization and improvement approach was done top-down. There was still
an urge to control things from the home office. Lars acknowledged: “We’ve learned throughout our
history and particularly in the past three years how valuable it is to give up that control ...but it’s still
challenging.” Yet Mud Bay had always empowered Muddies to make decisions for customers. Prices
were set by the home office, but any Muddy could offer a discount at the register if, for example, a
customer said that he or she usually bought a product less expensively elsewhere. The home office
issued guidelines for all stores on merchandising, including suggestions on signage. “We spent about
six months trying to come out with uniform signage that looked Mud Bay,” Al said. But then, for non-
core products, they decided to create mini-chalkboards and empowered staff to use their creativity and
knowledge of their customers to fill them. “It’s been just an explosion, “Al continued. “I mean, our
artists now I think are one of the biggest parts of Mud Bay culture.”
Strategy IV: Improve Efficiencies by Cross-training and Operating with Slack

Cross-training. Since the first store opened, all Muddies, including store managers, were trained and
expected to perform almost all store tasks. This gave stores flexibility: customer conversations were
always the top priority and if a staff member was engaged in a long conversation, other Muddies stepped

February 19, 2019                                                                                          10
MUD BAY
Zeynep Ton and Katie Bach

in to open a second register, restock shelves, or replenish sample supplies. The exception to this was at
the “store lead” level. Leads, who were two levels above entry level and just below assistant store
manager, included shift leads—responsible for monitoring the floor, assessing conversations, coaching
staff, and solving more difficult customer issues—and inventory leads—charged with receiving, putting
away, re-stocking, and monitoring all inventory. In 2017, Mud Bay combined the two roles into a
unified lead position in order to increase Mud Bay’s scheduling flexibility.

Smoothing workload. Before 2015, two Muddies arrived at the store at 5 am to make sure all overnight
deliveries were shelved before the store opened at 9:00 am. In 2015, field leaders encouraged the
company to try a new approach: the two store openers would arrive 30–45 minutes early and shelve the
largest, heaviest items, storing the rest of the merchandise in the back room. Then, throughout the day,
all Muddies would put the rest away during lulls.

Operating with slack. Operating with slack required estimating the workload over a given shift or day
and staffing stores with more hours than the expected workload in order to give staff time to think about
ways to do their job more effectively and efficiently. Mud Bay staffed its stores at higher levels than
its competitors, but it was incapable of implementing a task-based staffing system. Instead of planning
and tracking separate hours allocations for customer service, putting away merchandise, store opening
and closing, community outreach, ongoing training, training new staff and training staff for new stores
etc., stores were simply given a total weekly allocation of labor hours based on projected sales for the
year. Managers built staff hours schedules based on a rule of thumb (one Muddy for every eight
transactions per hour) and staffed all of the other activities they were responsible for as best as they
could. In 2016, Mud Bay identified its staffing and scheduling system as a significant area of weakness.

Mud Bay did make a few changes to reduce understaffing and create slack. Rather than banking the
labor saved by not having two people arrive at 5:00 am, all stores retained their existing hours
allocations, enabling them to put more staff on the floor during opening hours. The "shared keyholder”
position was introduced as a way to enable Muddies to work as many hours as they wanted to (up to
40) by working in multiple stores. As of 2018, Mud Bay had evolved this position into a “shared lead”
and had 4 shared leads with more projected to move into this position in 2019. The company also shifted
from physical to electronic keys, allowing any key-holding staff member to open any store.
Strategy V: Partner with Organizations that Contribute to the Well-being of Animals

In 2015, Mud Bay nearly doubled the number of company-sponsored pet adoption events, increased its
shelter donations by more than 50%, and launched FUTY (From Us To You), an annual festival to
honor animal shelter and welfare volunteers. The company also hired three community outreach staff
to build relationships with local animal organizations. In 2017, Mud Bay opened its first “Mudlet,” a
small-format Mud Bay store, inside the Seattle Humane Society’s building. 100% of operating profits
from the Mudlet were donated to the Humane Society.

February 19, 2019                                                                                      11
MUD BAY
Zeynep Ton and Katie Bach

Progress
In the middle of 2018, Mud Bay’s GJV journey was still continuing. “I feel like we have a way to go
on pretty much every aspect of it,” Marisa said. Others agreed. According to Chief Information Officer
Robert Maas, who joined Mud Bay in 2016, “Our aspirations are so much bigger than our capacity to
execute them and we don’t have a really good mechanism to plan ideas out. We’ll just jam them
through.” As a result, Mud Bay consistently fell short of implementing 100% of the initiatives laid out
in its annual plans. Town halls were planned for 2016 but not implemented until 2017. Budgeting and
forecasting software was identified as an important need in 2016 but still had not been selected by the
end of 2018. Home delivery was identified as a key opportunity in 2016 but had not been launched by
the end of 2018.

Some ideas that were identified early in the process, like implementing a better point-of-sale system
that would improve store-level efficiencies, were delayed because of insufficient time, money and/or
leadership capacity. And as the company started making changes, the list of ideas it wanted to
implement continued to grow. For example, as development and training requirements increased,
Muddies asked for additional hours for in-store meetings and training. Another idea that surfaced was
the creation of a centralized support team to provide Muddies with immediate telephone support. Field
managers and home office staff spent a lot of time answering questions on topics including customer
service, products, IT, dog and cat health, accounting and HR. A centralized support team that tracked
staff questions and pain points would be able to develop insights that could guide continuous
improvement efforts throughout the company.

For the most part, Mud Bay did not attempt to assess the impact of individual Good Jobs initiatives.
Analyzing data to understand the impact of various decisions was not a company strength. Lars had his
reasons for this:

    I grew up in business loving Excel. At the same time, [Marisa and I] both understand very clearly
    that the business we’re in is a business of human beings and that those human beings are making
    decisions every second that affect what shows up or doesn’t show up in Excel. So, I think when
    you look at something like the cost of pay raises, there is no way that we could say, “It’s going to
    cost us this and we can be confident that we will make it up with this, this, and this.” What we had
    to do is say fundamentally, “We’re not paying people enough. If we want to be the sort of company
    that we want to become, if we want a retention rate of 80% or 90%, if we want people to love their
    job, we’re going to have to pay more.” Ultimately, we will have to make the bottom line work, but
    the truth is that a bottom line is composed of a few hundred lines on an income statement. Although
    it may be appealing at some emotional level, the reality is that it’s very difficult to say this moved
    14 basis points in one direction and I made it up with eight basis points here, five basis points here,
    and one basis point there. It’s not reality. It’s fiction.

February 19, 2019                                                                                        12
MUD BAY Zeynep Ton and Katie Bach For example, one of the biggest business impacts in 2017 came not from any Good Jobs work, but from a supplier issue that cost the company sales. Nonetheless, by the end of 2017, the company was able to gauge the overall effect of the changes (see Exhibit 12 for select operational and employee metrics): Improvements to Customer Experience and Competitive Positioning Under Al’s leadership, Mud Bay followed through on its renewed commitment to everyday low prices. By 2018, Mud Bay’s prices averaged about 7% below the everyday prices of its primary brick-and- mortar competitors, PetSmart and Petco, and about on par with those of its primary online competitors, Amazon and Chewy. “Over the last few years, we’ve drawn customers because they know they can have confidence in the price,” Al observed. In 2017 and 2018, Yelp, Google, and Facebook reviews averaged 4.8 or 4.9 on a scale of 1 to 5. (See Exhibit 13 for example reviews.) Mud Bay was also in a stronger position to mobilize Muddies to implement customer-facing solutions. For example, in-store weigh stations were introduced to help pet owners keep track of weight goal progress. Rolling out the weigh stations required collaboration between the marketing, store development and store operations teams and the stores themselves. As Marisa said, “We piloted it in a few stores and we tweaked it. We tried different scales. We tried different locations in the store. And because we got feedback, because we collaborated, because we tested, at the point when it rolled out, it was just like, boom.” Larger strategic changes were also becoming easier to make. Late in 2015, the annual planning team realized that dog product sales were on pace to grow 23% compared to only 16% for cat products. Mud Bay therefore proclaimed 2016 “The Year of the Cat,” explaining the problem to Muddies and encouraging them to become “cat geeks.” By Q2 of 2016, the difference between dog and cat product growth had shrunk to less than one percentage point. Overall, company leaders felt that a stronger and more stable workforce was enabling them to execute changes more easily and would enable them to offer more services to customers in the future. Improvements to Employee Experience From 2014 to 2017, the percentage of employees working at least 30 hours increased from 69% to 82% and the average wage of an hourly store employee increased from $12.12 to $15.06. Those changes translated into an average annual earnings increase of approximately $3,800 for non-managerial employees. According to Lars, “If we didn’t raise wages to the point where we take pay off the table, we wouldn’t be able to do any of the good things we wanted to do.” Store staff turnover decreased from 48% to 31% and Mud Bay staff went from owning none of the company to owning 4.8% of it. Muddies were proud of the steps that Mud Bay was taking. After 2018’s Mudstock, one Muddy commented, “I will stay with this company as long as I possibly can. They still have things to work on, but they’re actually trying.” Robert Maas spoke about the focus that the GJV brought: “You’ve either made your customer’s life better or you made a Muddy’s life better or you’ve done both. We do as much as we can with the resources that we have.” February 19, 2019 13
MUD BAY
Zeynep Ton and Katie Bach

Financial Performance
From 2014 to 2017, total sales grew by 70% and same-store sales growth averaged above 9%. While
new stores contributed to topline growth, they took around 14 months to become profitable, and nearly
5 years to reach “steady state” (growing at the same rate as an older store). Sales per labor hour,
including managerial and non-managerial hours, increased from $116.86 to $132.07. Meanwhile,
however, cost of goods sold grew from 56.2% to 57.7% of sales due to lower prices. The home office
grew from 36 to 56 people, and wage and benefit costs rose, driving a net profit margin decline of
nearly 10%. This decrease in profitability did not come as a surprise. The 2015 annual plan stated:
“With more stores and strong same-store growth, we expect the highest sales in our history… On the
other hand, higher wages, stronger benefits, lower retail prices (by our choice), employee ownership,
and a lot of new or young stores all combine to reduce our earnings.”

Lars saw lower profitability as the price to be paid for long-term success: “None of us who lead the
company are concerned with these three years of performance as the primary thing we should be
focused on. We’re building a company to last for decades and what I’m quite confident about is that
the GJV has made us the sort of organization that is much more likely to be here, healthy, growing, and
profitable 10 and 20 years from now than we would be otherwise.” Nevertheless, insufficient
profitability was preventing the annual planning team from finalizing the 2018 plan and budget.

Store Hours Decision
The idea of reducing store hours had shown up as early as 2014 among staff suggestions for improving
Mud Bay. Now, as she had for the past two years, Tracy made the case for shorter hours to the planning
team. Field leaders were hearing from store staff that they disliked staying until 9:30 (half an hour after
closing), particularly on Saturdays, when they wanted to be with families and friends; additionally,
Muddies reported that the stores were “dead” late in the evening. “So, they were saying, ‘well, we’d
rather be at home’, but also, ‘why are we even open now?’” Tracy said. Tracy and her team proposed
closing an hour earlier, at 8:00 pm, Monday through Saturday. In addition to helping employees get out
earlier and generating labor savings, this would eliminate “clopenings” (when Muddies had fewer than
ten hours between ending one shift and beginning the next) and allow the company to staff for 11 hours
versus 12 hours, increasing mid-day overlap between openers and closers and removing unpopular
short midday shifts.

Marisa was supportive – two years living in France had reinforced her belief in the human value and
economic viability of shorter retail hours – but Lars resisted. Lars had moved Mud Bay to its current
schedule to match Petco and PetSmart hours, and he worried that closing early would inconvenience
customers and violate Mud Bay’s commitment to graciousness. He was also concerned that lost revenue
would more than offset the labor savings. Before making the decision, he wanted to see an impact
analysis.

February 19, 2019                                                                                        14
MUD BAY
Zeynep Ton and Katie Bach

Robert and his team analyzed sales data for almost all of Mud Bay’s stores over six different weeks in
three different seasons. For each day of the week, they compared the volume of sales during the first
two half hours and the last two half hours to the average volume per half hour. Because Muddies
frequently made sales before opening and after closing, they also included the half hours before opening
and after closing. (Exhibit 13)

As the annual planning team gathered one more time to try to agree on revisions to the 2018 budget,
they reviewed the analysis. Now it was time for them to make a decision.

February 19, 2019                                                                                     15
MUD BAY
Zeynep Ton and Katie Bach

Exhibit 1a Pet Store Industry Data

Industry growth (*estimated numbers); sales in $ billions and number of pets in millions

                 Brick &             Online       Number of pets                    16%
   Year        Mortar Sales          Sales        (cats and dogs)
                                                                                    14%                                                Brick & Mortar
  2010            15.65               2.88             164.6
                                                                                                                                       Stores
  2011            16.12               3.31             164.4                        12%
                                                                                                                                       E-Commerce
  2012            16.66               3.74             171.7                        10%

                                                                    Annual Change
  2013            16.94               4.14             178.9                        8%
  2014            17.36               4.64             171.3
                                                                                    6%
  2015            18.30               5.21             163.6
  2016            19.07               5.78             173.8                        4%
  2017            18.99               6.18             183.9                        2%
  2018*           19.58               6.60             186.9                        0%
  2019*           20.10               7.00             192.7                              2011 2012 2013 2014 2015 2016 2017 2018 2019 2020 2021 2022
                                                                                    -2%
  2020*           20.53               7.35             197.5
  2021*           20.99               7.67             202.7
  2022*           21.42               7.99             207.2

Source: Kelsey Oliver, “Pet Stores in the U.S.,” IBISWorld, 2018.

February 19, 2019                                                                                                      16
MUD BAY
Zeynep Ton and Katie Bach
Exhibit 1b Share of Consumers Using Selected Distribution Channels for Pet Product
Purchases in the U.S. in 2017
Share of Respondents
Drugstores and C-stores 7%
Wholesale Membership Clubs 11%
Veterinarians 12%
Other Pet Stores 15%
Online 17%
Discount Stores 24%
Petco 26%
Petsmart 36%
Supermarkets 46%
0% 5% 10% 15% 20% 25% 30% 35% 40% 45% 50%
Share of Respondents
Sources: Packaged Facts; APPA; Statista (https://www-statista-com.libproxy.mit.edu/statistics/728232/pet-products-consumer-
distribution-channels-us/, accessed August 12, 2018).
Exhibit 1c Share of Consumers Using Online Channel for Pet Product Purchases in the U.S.
18% 17%
16%
14% 13%
12%
10% 9% 9%
8% 7% 7%
6% 6%
6%
4%
2%
0%
2010 2011 2012 2013 2014 2015 2016 2017
Sources: Packaged Facts; APPA; Statista (https://www-statista-com.libproxy.mit.edu/statistics/728236/pet-products-online-
consumers-us/, accessed August 12, 2018).
February 19, 2019 17MUD BAY
Zeynep Ton and Katie Bach
Exhibit 1d Share of Online Pet Product Consumers Using Selected Channels for Pet Product
Purchases in the U.S. in 2019
Walmart / Sam's 14%
Petco 17%
PetSmart 19%
Chewy 26%
Amazon 55%
0% 10% 20% 30% 40% 50% 60%
Exhibit 1e Pet Store (Brick & Mortar) Industry Cost Structure
Cost % Revenue
Purchases 55.8
Wages 14.4
Rent & Utilities 9.4
Marketing 1.9
Depreciation 0.9
Other 13.6
Profit 4
Source: Kelsey Oliver, “Pet Stores in the U.S.,” IBISWorld, 2018.
February 19, 2019 18MUD BAY
Zeynep Ton and Katie Bach
Exhibit 2 Petco and PetSmart Financial and Operational Data
2010 2011 2012 2013 2014
Petco
Net Sales (000s) $ 2,869,113 $ 3,101,862 $ 3,528,030 $ 3,785,153 $ 3,995,368
Gross Profit (000s)* $ 884,997 $ 979,674 $ 1,124,965 $ 1,183,298 $ 1,216,941
Net Income (000s) $ 22,468 $ 63,975 $ 98,821 $ 84,765 $ 75,342
Number of Stores 1064 1145 1230 1314 1383
Comp Store Sales Growth 1.8% 5.2% 7.6% 4.9% 1.8%
Net Sales per Square Foot $ 186.3 $ 192.9 $ 208.6 $ 213.4 $ 217.0
PetSmart
Net Sales (000s) $ 5,693,797 $ 6,113,304 $ 6,758,237 $ 6,916,627
Gross Profit (000s) $ 1,654,531 $ 1,804,423 $ 2,062,139 $ 2,115,937
Net Income (000s) $ 239,867 $ 290,243 $ 389,529 $ 419,520
Number of Stores 1187 1232 1278 1333
Comp Store Sales Growth 4.8% 5.4% 6.3% 2.7%
Net Sales per Square Foot $ 213.9 $ 224.4 $ 242.8 $ 243.0
* Gross profit excludes cost of sales and occupancy
Source: Petco Holdings Form S-1, August 17, 2015; (https://www.sec.gov/Archives/edgar/data/1582846/000119312515293270/d42894ds1.htm, accessed 10/30/2018); PetSmart
Form 10-K, for the fiscal year ended February 2, 2014 (https://www.sec.gov/Archives/edgar/data/863157/000086315714000040/petm-20140202x10k.htm, accessed 10/30/2018).
February 19, 2019 19MUD BAY
Zeynep Ton and Katie Bach
Exhibit 3 Mission, Values & The Mud Bay Experience
MISSION
To contribute to the health of dogs and cats and the happiness of those who care for them as we build
a strong company we’re proud of.
VALUES
Accountability: We follow through
Education: We empower with knowledge
Integrity: We do the right thing
Generosity: We help others succeed
Responsibility: We use our best judgement
Fun: We create workplaces that are filled with laughter
THE MUD BAY EXPERIENCE
Gracious Dog and cat owners are the reason we’re here, and we’ll do anything
reasonable to help them.
Healthy Everything we carry is healthy and well-made.
Happy Visiting our stores is a happy and educational experience.
Solutions We give useful, accurate answers and focus on helping people choose
healthy foods for their dogs and cats.
Fair prices Our prices are among the lowest in the area.
Satisfaction If something doesn’t work, we’ll happily take it back.
Clean Our work spaces are well-organized, and our displays sparkle.
Carry-outs We carry out purchases over fifteen pounds.
Consistently varied The human experiences we create are unique to each moment, customer,
staffer and store, but each reflects Mud Bay’s values and character.
Source: Mud Bay.
February 19, 2019 20MUD BAY
Zeynep Ton and Katie Bach
Exhibit 4 Mud Bay P&L and Select Balance Sheet Metrics
2011 2012 2013 2014 2015 2016 2017
Mud Bay P&L
Store Retail Sales 28,990,887 33,010,827 38,430,683 45,518,036 54,659,273 66,504,680 76,707,575
Cost of Sales 17,373,753 19,235,746 21,546,927 25,587,137 31,170,989 38,338,038 44,263,661
Gross Profit 11,617,134 13,775,081 16,883,756 19,930,899 23,488,285 28,166,642 32,443,914
Occupancy 2,701,913 3,048,659 3,569,523 4,293,386 5,145,031 5,993,794 6,839,910
Wages, PTO 2,989,973 3,854,652 4,355,297 5,490,277 6,963,053 8,915,389 10,199,537
Payroll taxes & benefits 474,223 568,699 688,251 890,808 1,101,502 1,424,329 1,711,536
Profit Sharing 19,396 98,410 140,000 181,200 55,763 - 118,216
Other 1,505,080 1,701,560 2,021,805 2,519,498 2,841,851 3,251,894 3,634,405
Depreciation 262,363 339,309 411,321 519,638 640,854 792,616 934,197
Total Operating Expense 7,952,948 9,611,289 11,186,197 13,894,807 16,748,055 20,378,023 23,437,802
Operating Income 3,664,186 4,163,792 5,697,559 6,036,092 6,740,230 7,788,619 9,006,112
-
General & Administrative 3,146,207 3,131,672 4,043,244 4,423,701 4,854,513 6,044,369 6,819,738
ESOP Contribution 125,000 399,000 438,352
Other (Income) Expense (33,362) 49,423 (23,874) (14,741) (24,381) 32,793 694
Interest Expense 116,044 83,479 69,496 17,131 2,953 43 -
Profit Before Taxes 435,297 899,218 1,608,693 1,610,001 1,782,145 1,312,415 1,747,328
Total Income Tax Expense (152,824) (311,749) (556,307) (618,483) (671,669) (583,619) (222,364)
Net Income (Loss) 282,473 587,469 1,052,386 991,518 1,110,476 728,796 1,524,964
Select Balance Sheet Metrics
Cash 557,045 1,224,625 1,387,655 1,405,504 1,832,253 1,905,729 2,132,356
Total receivables 637,770 340,217 1,203,356 797,127 1,419,693 744,553 1,113,983
Total payables 2,017,893 2,726,865 3,589,357 4,275,789 5,000,712 4,958,056 5,786,989
Inventory 2,732,374 3,193,223 3,365,219 4,158,755 4,637,932 5,181,968 6,664,448
Source: Mud Bay.
February 19, 2019 21MUD BAY Zeynep Ton and Katie Bach Exhibit 5 Mud Bay Store Photos Source: Casewriters. February 19, 2019 22
MUD BAY
Zeynep Ton and Katie Bach

Exhibit 6     Example Discussion Questions for Mud Bay’s 8 Weeks of Small Group Discussions

    •    Are retail staff a key asset to invest in or the largest expense to minimize?
    •    Should processes be standardized or should staff be empowered to use their judgment—or
         both?
    •    Should retail roles be highly specialized or should staff be cross-trained and empowered to
         move between different tasks?
    •    Should pricing be set at levels that maximize the profitability of transactions or at levels the
         maximize the volume of business units?
    •    What are the advantages and disadvantages of offering more or fewer product choices?
    •    Should retail staffing levels be set a level that minimizes expenses or maximizes sales or
         someplace in between?
    •    Should schedules be designed to maximize business efficiency or maximize staff members’
         quality of life?

February 19, 2019                                                                                           23
MUD BAY Zeynep Ton and Katie Bach Exhibit 7 Mud Bay’s GJV Roadmap (as of January 2015) February 19, 2019 24
MUD BAY
Zeynep Ton and Katie Bach

Exhibit 8     Mudstock 2014 Assessment of Mud Bay 2017

What aspects of Mud Bay 2017 are most EXCITED about?
   1. Investing in staff: full-time jobs, opportunities for advancement
   2. Higher pay and stronger benefits
   3. Offering less at EDLP: Fewer brands, more knowledge, in-depth training
   4. Mud Bay staff are owners of Mud Bay
   5. Cross-training and Operating with Slack

What aspects of Mud Bay 2017 are we most CONCERNED about?
   1. Fewer products: Making customers unhappy (and losing them) because we don’t have what they want
   2. Standardization: Too much standardization causing loss of individuality, culture, being Consistently
        Varied
   3. Overpromising and underdelivering: setting the right priorities, saying no, getting things done by 2017
   4. Not enough communication between stores and home office, not enough store input in decisions
   5. Maintaining our culture and integrity

Exhibit 9     Timeline of Changes

2015:
   •     ESOP launched
   •     10% SKU reduction
   •     Category teams introduced
   •     New approach to busting (putting product away) rolled out
   •     Change in training approach (shift to video-based ‘first year journey’)

2016:
   •     DM development program launched
   •     Additional SKU reduction (
MUD BAY
Zeynep Ton and Katie Bach
Exhibit 10 Mud Bay’s Pay Data 2013 – 2017
$17.00
Mud Bay average hourly wage and WA minimum wage
$15.00
$13.00
$11.00
$9.00
$7.00
$5.00
2013 2014 2015 2016 2017
Mud Bay WA state Seattle Oregon
Sources: Mud Bay; ://www.lni.wa.gov/WorkplaceRights/Wages/Minimum/History/default.asp (accessed August 31, 2018);
https://www.usatoday.com/story/money/nation-now/2017/06/27/report-finds-seattles-15-minimum-wage-may-hurting-
workers/431424001/ (accessed January 31, 2019); https://evans.uw.edu/sites/default/files/NBER%20Working%20Paper.pdf
(accessed January 31, 2019); https://www.oregonlive.com/money/index.ssf/2014/09/oregon_minimum_wage_will_incre.html
(accessed January 31, 2019); https://www.oregon.gov/boli/whd/omw/pages/minimum-wage-rate-summary.aspx (accessed
January 31, 2019) https://www.washingtonpost.com/blogs/govbeat/wp/2013/09/25/is-seattle-headed-for-a-15-minimum-
wage/?utm_term=.92b461448b58 (accessed January 31, 2019).
Exhibit 11 Description of Mud Bay Leadership: How We Work Together
HOW WE WORK TOGETHER
With open minds, listening, asking questions, seeking to understand.
With open hearts, speaking honestly, connecting with others, letting ourselves be vulnerable.
With empathy, self-awareness and a sense of humor.
With good judgement and a focus on long-term outcomes
With passion for Mud Bay’s mission, a desire to learn and a drive to do the extraordinary.
Walking our talk, doing our share and being true to ourselves.
Sharing ownership, empowering others, assuming good intentions.
February 19, 2019 26You can also read