Multi-Sensor Observation of a Saharan Dust Outbreak over Transylvania, Romania in April 2019 - MDPI
←
→
Page content transcription
If your browser does not render page correctly, please read the page content below
atmosphere
Article
Multi-Sensor Observation of a Saharan Dust
Outbreak over Transylvania, Romania in April 2019
Nicolae Ajtai, Horat, iu S, tefănie, Alexandru Mereut, ă, Andrei Radovici and Camelia Botezan *
 Faculty of Environmental Science and Engineering, Babes, -Bolyai University, 30 Fântânele St.,
 400294 Cluj-Napoca, Romania; nicolae.ajtai@ubbcluj.ro (N.A.); horatiu.stefanie@ubbcluj.ro (H.S, .);
 mereutaalexandru90@gmail.com (A.M.); radovici_andrei@yahoo.com (A.R.)
 * Correspondence: camelia.costan@ubbcluj.ro

 Received: 17 March 2020; Accepted: 8 April 2020; Published: 9 April 2020

 Abstract: Mineral aerosols are considered to be the second largest source of natural aerosol, the
 Saharan desert being the main source of dust at global scale. Under certain meteorological conditions,
 Saharan dust can be transported over large parts of Europe, including Romania. The aim of this
 paper is to provide a complex analysis of a Saharan dust outbreak over the Transylvania region of
 Romania, based on the synergy of multiple ground-based and satellite sensors in order to detect
 the dust intrusion with a higher degree of certainty. The measurements were performed during the
 peak of the outbreak on April the 24th 2019, with instruments such as a Cimel sun-photometer and a
 multi-wavelength Raman depolarization lidar, together with an in-situ particle counter measuring
 at ground level. Remote sensing data from MODIS sensors on Terra and Aqua were also analyzed.
 Results show the presence of dust aerosol layers identified by the multi-wavelength Raman and
 depolarization lidar at altitudes of 2500–4000 m, and 7000 m, respectively. The measured optical and
 microphysical properties, together with the HYSPLIT back-trajectories, NMMB/BSC dust model, and
 synoptic analysis, confirm the presence of lofted Saharan dust layers over Cluj-Napoca, Romania.
 The NMMB/BSC dust model predicted dust load values between 1 and 1.5 g/m2 over Cluj-Napoca at
 12:00 UTC for April the 24th 2019. Collocated in-situ PM monitoring showed that dry deposition was
 low, with PM10 and PM2.5 concentrations similar to the seasonal averages for Cluj-Napoca.

 Keywords: Saharan dust; aerosol remote sensing; lidar; sun-photometer; MODIS

1. Introduction
      Aerosols are an important component of the atmospheric mixture which influence radiative
forcing through the atmosphere [1]. Besides the radiative effects, aerosols can pose a significant hazard
to human health [2,3] and to certain economic sectors, having a significant economic impact. In this
case, similar to what took place in some Eastern and Western Asian countries, aerosols can affect
constructions, aerial and terrestrial transportation (flight delay and traffic accident rate changes), trade,
agriculture (crop degradation), manufacturing, and households over short and long term periods [4,5].
      Mineral aerosols are considered to be the second largest source of natural aerosol [6]. They usually
originate from soil ablation in arid areas and are lofted to high altitudes by thermal turbulences and are
subjected to long range transport [7,8]. Dust originating from the Sahara and Sahel regions of Northern
Africa accounts for more than 50% of the global atmospheric mineral dust [9,10]. It is estimated
that roughly 800 million tones/year of dust is subjected to aeolian transport from these two sources
alone [11,12]. Upwards of 10% of these Saharan dust emissions are transported over continental
Europe and the Mediterranean Sea [11]. Seasonal trajectories have been discussed in the scientific
literature, with peak emissions observed in spring and summer [12,13]. Studies such as [14] show
that transport over larger ranges are expected during April through June, while vertical transport is

Atmosphere 2020, 11, 364; doi:10.3390/atmos11040364                             www.mdpi.com/journal/atmosphere
Atmosphere 2020, 11, 364                                                                             2 of 14

highest from April through September. Under certain meteorological conditions, significant amounts
of Saharan dust are transported north, over the Mediterranean basin [15–17] and in severe cases, even
over Western, Central, and Eastern Europe [18–21]. Dust outbreaks have been observed as far as
northern Europe and the Baltic Sea [10,22]. Dust trajectories from North Africa to Continental Europe
are often linked to the movement of two pressure systems. The strength and dynamics of these systems
determine the potential to carry dust plumes over long ranges [22,23].
      A severe dust intrusion can have intense socio-economic and environmental consequences.
In previous studies, it was observed that the amount of Saharan dust in Romania can be above the
threshold presented in the national legislation, which poses danger for human health [24]. Furthermore,
a Saharan dust plume can influence the climate of Romania. Dust particles lofted above Romania are
majorly mixed with pollutants of other European countries, and can easily lead to air pollution [25].
Concerning the additional environmental impacts of a dust intrusion, the pH of precipitations can
increase due to the influence of Saharan dust events, similar to what took place in other European
countries [26].
      There is a need, at stakeholder level, for near-real-time monitoring and early warning systems.
These systems could be developed for a region as extensive as Romania with the input of additional
data sets from other sources [27]. With the integration of different data sets, information on the size
and concentration of the dust particles, the dynamics of the dust plume, its altitude, etc. could be
obtained. Generally, using different data from various sensors gives us the ability to comprehensively
identify the dust intrusion’s characteristics (that could not be performed using just a single sensor).
The more information is sent to stakeholders, policy makers, and natural hazards specialists, the more
accurate their decisions will become.
      Therefore, in this paper, our main intention is to provide more information through multi-source
data integration. In Romania there are several studies focusing on Saharan dust intrusions [28–31].
However, these studies were conducted in the southern and eastern part of Romania. In the
north-western part of Romania, there is limited information on Saharan dust intrusions, with the
majority of the studies carried out in this region [24,32,33] relying mostly on single-sensor information.
      Due to the high degree of heterogeneity and spatial-temporal variability of atmospheric aerosols,
the study of their composition, distribution, and dynamics is currently monitored at a global level.
This monitoring can be ground-based, airborne or satellite-based.
      Talianu et al., 2007 [34] detected a dust event over Bucharest, Romania, and also determined the
dust type using a lidar system accompanied by a model data prognosis and air masses backward
trajectories. Tudose, 2013 [25] studied a Saharan dust intrusion in Romania (occurred in July 2012)
and its influences on the local weather using lidar data and complementary methods. Ajtai et al.,
2017, [32] found that the aerosol properties over Cluj-Napoca, Romania derived from AERONET
sun-photometric data using a CIMEL CE 318A radiometer. Labzovskii et al., 2014 [29] attempted to
determine the properties of a Saharan dust intrusion (occurred in May and June 2013) over Bucharest
(south of Romania) using lidar and sun-photometer. S, tefănie et al., 2015 [24] detected the dust intrusion
over Cluj-Napoca, Romania (in April 2014) using a lidar system, FLEXPART and HYSPLIT models.
They identified the source of the dust plume and measured the ground level concentration of dust
particles using an optical aerosol monitor. Cazacu et al., 2017 [35] assessed the temporal and vertical
variation of Saharan dust concentration near Bucharest, Romania (from the data related to 2012) using
the lidar system and some auxiliary methods. Mărmureanu et al., 2019 [36] studied the synoptic-scale
conditions leading to the Saharan dust intrusion that was mixed with snow precipitation (occurred in
March 2018) over the south-east of Romania. They analysed the dust morphology, particle size, and
the physical and chemical properties. They also developed a method that visualized the presence of
some minerals.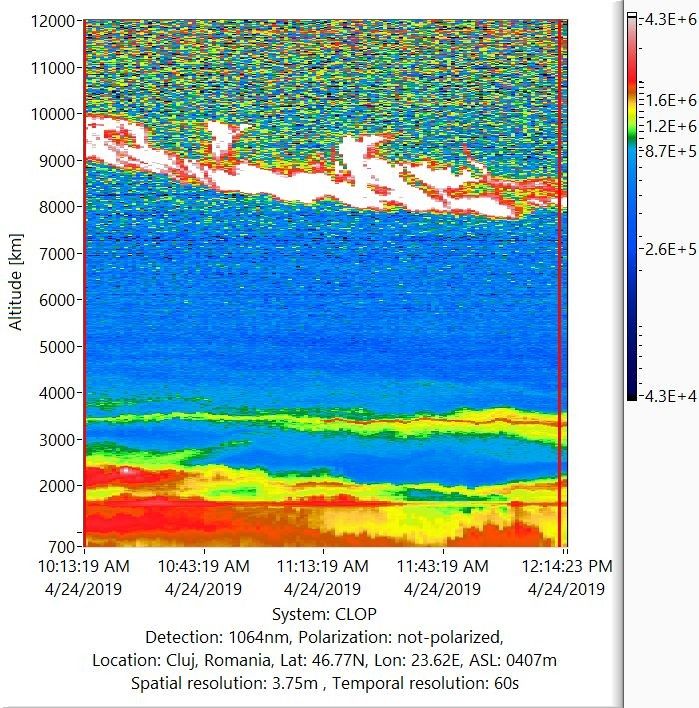
Atmosphere 2020, 11, 364                                                                             3 of 14

     This paper contributes to the above-mentioned regional studies analyzing Saharan dust intrusions
in the north-western part of Romania (which have not yet been sufficiently studied in this part of the
country) using integrated, prevalent techniques and equipment types and satellite-based imagery.
Thus, the integration of different datasets brings added value and leads to the extraction of valuable
and more reliable information on the phenomenon of dust intrusions.
     The aim of this paper is to provide a complex analysis of a Saharan dust outbreak over the
Transylvania region of Romania based on the synergy of multiple ground-based and satellite sensors,
in order to detect the dust intrusion with a higher degree of certainty. This outbreak occurred between
April 21st and 25th 2019, affecting large areas of the European continent, reaching as far north as Iceland
and Norway [37]. The exceptionally dust event was generated by a “haboob”- a cold low-pressure
system, developed on 20th of April 2019 over north-west Africa (Morocco and Algeria). Significant
amounts of dust were lifted up into the upper troposphere and then advected by the persistent southern
circulation, at first towards Western Europe and western Mediterranean, and later on (starting on
23rd of April 2019) towards south-eastern Europe. Dust loaded air masses arrived over Transylvania,
Romania on April the 24th 2019.

2. Instruments and Method
     We analyzed data measured in Cluj-Napoca, Romania on April the 24th 2019 with a series of
ground-based remote sensing instruments, such as multi-wavelength Raman depolarization lidar, part
of the European Aerosol Research Lidar Network (EARLINET) [38], and a sun-photometer, part of
the Aerosol Robotic Network (AERONET) [39]. Currently, the two networks are part of the Aerosols,
Clouds, and Trace gases Research InfraStructure (ACTRIS) [40]. The Cluj-Napoca ACTRIS station can
be considered representative for the whole Transylvanian territory, and also for the Pannonian Basin,
given the limited coverage of AERONET and EARLINET in Hungary, Austria, and south-western
Ukraine. Besides the ground-based instruments, remote sensing data from MODIS sensors on Terra
and Aqua satellites were used in this analysis. During the intrusion, an in-situ optical particle counter
measured particulate matter concentrations at ground level to account for potential dust deposition.
     Each data source has some limitations. For example, the altitude information is not included in
the MODIS product, but can be inferred from the lidar data. On the other hand, the two-dimensional
distribution of dust is inferred by the MODIS images. By integrating these single sensor data products,
new added value information will be extracted which could not have been collected by a single sensor.

2.1. Cimel CE 318 Sun Photometer
      The Cimel CE 318 sun-photometer is a ground-based sun and sky tracking automated radiometer,
which measures aerosol optical properties using a combination of filters and azimuth and zenith
mobility. It measures sun and sky radiance in order to derive the aerosol properties. It provides aerosol
optical depth at eight spectral channels in the wavelength range of 340–1640 nm. It is a part of the
AERONET [41]. The AERONET network provides two types of data: direct Sun spectral data based
on the extinction of light through the atmospheric column (Aerosol Optical Depth (AOD), Ångström
Exponent (α), SDA (Spectral Deconvolution Algorithm) Fine mode fraction, SDA Fine/Coarse AOD,
etc.), and inversion data derived from the angular distribution of the sky radiance (volume particle size
distribution, asymmetry factor, complex refractive index, single scattering albedo (SSA), absorption,
and extinction optical depths, etc.) [42]. In this study we analyzed the aerosol optical depth (AOD),
Ångström Exponent [43], volume particle size distribution, and the single scattering albedo (SSA) from
the CLUJ_UBB AERONET station.

2.2. Multi-Wavelength Raman and Depolarization Lidar
     Multi-wavelength lidar systems are active remote sensing instruments, which can provide useful
information regarding the aerosol properties on different layers due to their high temporal and vertical
resolutions. The Cluj-Napoca lidar system (CLOP) emission is based on a Nd-YAG laser Continuum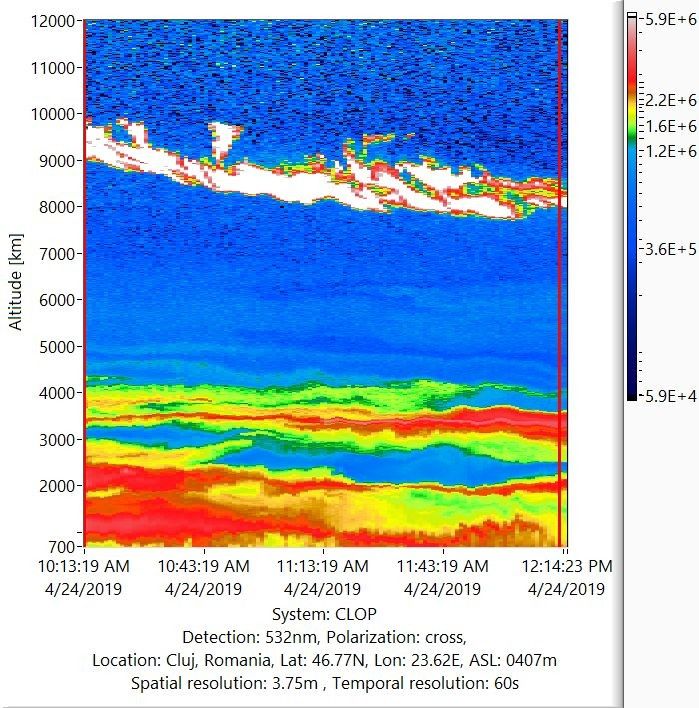
Atmosphere 2020, 11, 364                                                                            4 of 14

INLITE II-30, which has a repetition rate of 30 Hz and is equipped with second and third harmonics.
The radiation at 1064, 532, and 355 nm is simultaneously emitted into atmosphere. The backscattered
radiation is collected by a Cassegrain type telescope (D300 aerosol LIDAR, Raymetrics S.A., Athens,
Greece) with a focal length of 1500 mm. The signal detection unit has a total of 6 detection channels,
4 channels for the elastically backscattered radiation at 1064, 532 (cross and parallel), and 355 nm
and 2 channels for the Raman radiation backscattered by nitrogen molecules at 607 and 387 nm. The
raw data vertical resolution is 3.75 m. The lidar system is part of the EARLINET [44]. For this event
the measurements were made during daytime with all the elastic channels and depolarization at 532
nm. Measurement sets of 2 h each were performed with a temporal resolution of 60 s. The calibrated
depolarization vertical profiles of the aerosols were computed using the method proposed by [45,46].

2.3. MODIS Retrievals
      The Moderate Resolution Imaging Spectroradiometers (MODIS) onboard NASA’s Terra and Aqua
platforms have been retrieving aerosol parameters since 1999 and 2002, respectively [47]. The polar
orbiting satellites perform daily overpasses at 10:30 and 13:30 local solar Equatorial crossing time [48].
Retrieval products are split over land and ocean surfaces by three different sets of algorithms.
      The standard Level-2 aerosol product has a 10 km spatial resolution, providing parameters such
as total AOD at 550 nm and fine mode fraction based on the spectral fitting error. Other parameters
may be derived from lookup tables, including Ångström Exponent, AOD at different wavelengths,
and several inversion products. Detailed descriptions of the algorithms are presented extensively in
the literature [47–50].
      The 3 km product offers the same parameters as the combined land and ocean 10 km algorithm,
using a similar structure, inversion methods, and lookup tables. Differences are found in the way
reflectance pixels are selected and grouped for retrieval. This higher resolution is particularly useful
for tracing fine gradients in smoke and pollution plumes, as well as in dust events. The AOD product
selected for this study, Optical_Depth_Land_And_Ocean, provides the highest quality assurance
confidence (QAC) for AOD at 0.55 µm, QAC = 3 over land and QAC > 1 over ocean surfaces [51].
Since a similar product for Ångström Exponent is not available at this resolution (3 km), the coarser 10
km product was used as a proxy for estimating aerosol size.

2.4. Modelling Tools
    Hybrid Single-Particle Lagrangian Integrated Trajectory model-HYSPLIT back-trajectories were
used to analyze the long-range transport of aerosols [52] and to identify the source area.
    The NMMB/BSC forecast model developed by Barcelona Supercomputing Center [53] was also
used in order to analyze the dynamics of this event.

2.5. In-Situ Measurements
     During the analyzed period, in order to identify potential dry deposition of the lofted dust
particles, in-situ measurements were performed with a DUSTTRAK™ DRX Aerosol Monitor optical
particle counter (Model 8533 with external pump, DUSSTRAK DRX Aerosol Monitor 8533EP, TSI
Incorporated, Shoreview, MN, USA) at 1.5 m above ground. It can simultaneously measure size
segregated mass fraction concentrations (PM1 , PM2.5 , Respirable/PM4 , PM10 /Thoracic, and Total PM)
over a wide concentration range (0.001–150 mg/m3 ) in real time.

3. Results and Discussion

3.1. Sun Photometer Data Analysis
     For the April the 24th 2019 at Cluj_UBB AERONET site, we analyzed Version 3, level 1.5 data,
which are cloud screened and quality controlled, but without the final calibration. As seen in Figure 1a,
the Aerosol Optical Depth (AOD) at 500 nm has a daily average of 0.26 ± 0.02, higher than the 0.20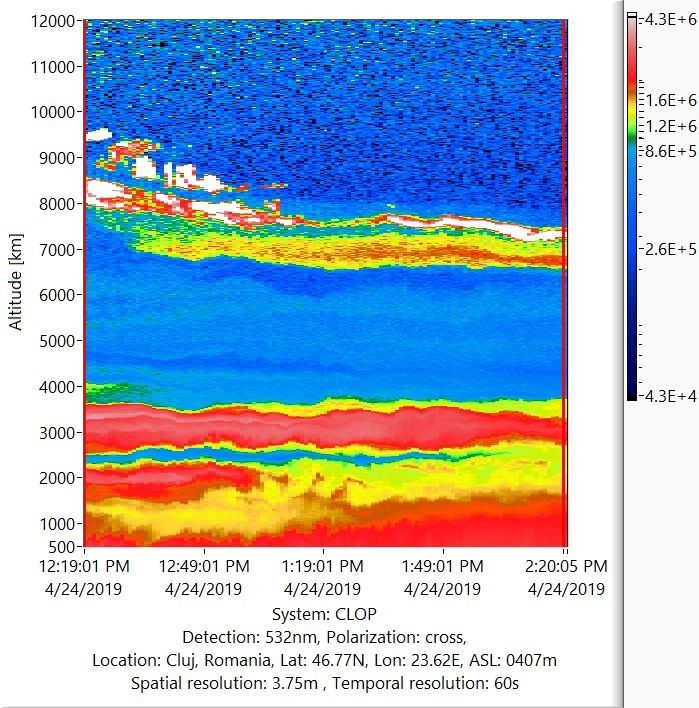
Atmosphere 2019, 10, x FOR PEER REVIEW                                                                                                                   5 of 14

     For the April the 24th 2019 at Cluj_UBB AERONET site, we analyzed Version 3, level 1.5 data,
Atmosphere 2020, 11, 364                                                                                                  5 of 14
which are cloud screened and quality controlled, but without the final calibration. As seen in Figure
1a, the Aerosol Optical Depth (AOD) at 500 nm has a daily average of 0.26±0.02, higher than the
± 0.05 multi-annual
0.20±0.05   multi‐annual     monthly
                          monthly         average
                                     average    for for  April
                                                     April        at the
                                                              at the       Cluj_UBB
                                                                      Cluj_UBB           station.
                                                                                    station.       Regarding
                                                                                              Regarding          the 440–870
                                                                                                            the 440–870      nm
Ångström
nm Ångström  Exponent      (Figure
                    Exponent         1b), the
                                 (Figure    1b),measured
                                                 the measured valuesvalues
                                                                        are low are(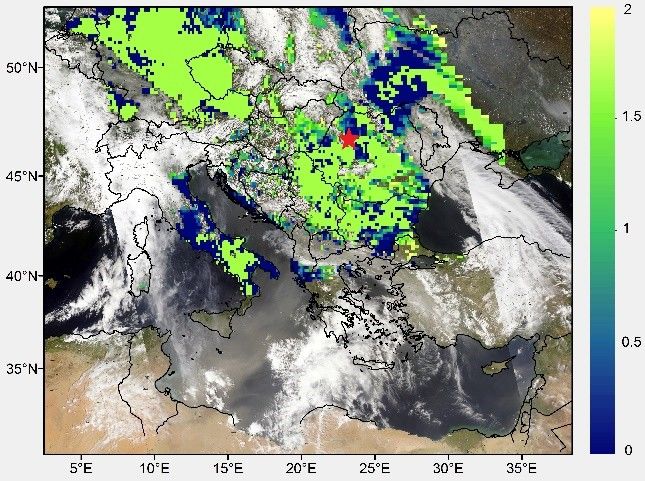
Atmosphere 2019, 10, x FOR PEER REVIEW                                                                            6 of 14

of 0.05 and 0.06, characteristic to non‐dust aerosols (urban‐industrial and/or biomass burning
aerosols). The particle depolarization ratio for the dust aerosol layer is 0.27, and varies between 0.1
and 0.13 2020,
Atmosphere for the   lower non‐dust aerosol layers, which are in agreement with the values presented
                11, 364                                                                               in
                                                                                                 6 of 14
the literature for these aerosol types [57].

                                                                                         (b)
                             (a)

                                                           (c)
     Figure2.2. Cluj-Napoca
     Figure     Cluj‐Napoca lidar
                             lidar system
                                    system (CLOP)
                                            (CLOP) lidar
                                                    lidarRCS
                                                          RCSfor
                                                              for24.04.2019:
                                                                  24.04.2019: 10:15–12:15
                                                                              10:15–12:15 UTC,
                                                                                             UTC, Cluj-Napoca,
                                                                                                  Cluj‐Napoca,
     407m
     407 mASL,
            ASL,atat1064
                     1064nm
                         nm(a)(a)and
                                  and532
                                      532nm
                                          nmcross
                                              cross(b);
                                                    (b);volume
                                                         volumedepolarization
                                                                depolarizationratio
                                                                                 ratioatat532
                                                                                           532nm
                                                                                               nm(c)
                                                                                                 (c).

      The  volume
       In the second depolarization   ratio (Figure
                       lidar measurements             2c) for the higher
                                               set (24.04.2019:            aerosol
                                                                  12:20–14:20      layer
                                                                                UTC)   we(2500–4000
                                                                                           can see them)samereaches  0.1,
                                                                                                                aerosol
characteristic
 layer between  to 2500
                   Saharan
                         anddust
                               3700[56], while
                                     m. In      the lower
                                            addition,   a newaerosol
                                                                 layerlayers (below at
                                                                        is detected  2500  m) exhibit
                                                                                        higher           values
                                                                                                 altitude,       of 0.05
                                                                                                             at approx.
and
 70000.06,
       m, ascharacteristic to non-dust
              seen in the RCS    at 1064 aerosols
                                          (Figure 3a)(urban-industrial
                                                        and 532 nm cross   and/or  biomass
                                                                              (Figure       burning
                                                                                       3b), below    theaerosols).  The
                                                                                                          cirrus clouds
particle
 detecteddepolarization
             between 7500ratio andfor the m.
                                    9500  dustTheaerosol
                                                     volumelayerdepolarization
                                                                 is 0.27, and varies
                                                                                 ratiobetween
                                                                                        slightly0.1   and 0.13 to
                                                                                                   increased     for0.12,
                                                                                                                     the
lower    non-dusttoaerosol
 characteristic     Saharan  layers, which are
                               dust (Figure   3c).inThe
                                                     agreement
                                                        particle with    the valuesratio
                                                                   depolarization    presented
                                                                                          for theindust
                                                                                                    the literature   for
                                                                                                          aerosol layer
these   aerosol
 is 0.24, whichtypes   [57].
                 is in agreement     with the values presented in the literature for this aerosol type [57].
      In the second lidar measurements set (24.04.2019: 12:20–14:20 UTC) we can see the same aerosol
layer between 2500 and 3700 m. In addition, a new layer is detected at higher altitude, at approx. 7000
m, as seen in the RCS at 1064 (Figure 3a) and 532 nm cross (Figure 3b), below the cirrus clouds detected
between 7500 and 9500 m. The volume depolarization ratio slightly increased to 0.12, characteristic to
Saharan dust (Figure 3c). The particle depolarization ratio for the dust aerosol layer is 0.24, which is in
agreement with the values presented in the literature for this aerosol type [57].
Atmosphere 2020, 11, 364 7 of 14
Atmosphere 2019, 10, x FOR PEER REVIEW 7 of 14
(a) (b)
(c)
Figure 3.
Figure 3. CLOP
CLOP lidar
lidar RCS
RCS for
for 24.04.2019:
24.04.2019: 12:20–14:20
12:20–14:20 UTC,
UTC, Cluj‐Napoca,
Cluj-Napoca, 407
407 m
m ASL,
ASL, at
at 1064
1064 nm (a)
nm (a)
and 532
532 nm
nm cross
cross (b);
(b); volume
volume depolarization
depolarization ratio
ratio at
at 532
532 nm
nm(c)
(c).
3.3. MODIS Data
3.3. MODIS Data Analysis
Analysis
In
In Figure 4, AOD
Figure 4, AOD values
valuesatat550
550nm
nmresulting
resultingfrom the3 ×3 3×km
fromthe 3 km MODIS
MODIS level
level 2 AOD
2 AOD products
products are
are
represented. Terra MODIS retrieved AOD values between 0.19 and 0.27 over Transylvania, while
represented. Terra MODIS retrieved AOD values between 0.19 and 0.27 over Transylvania, while
Aqua
Aqua MODIS showed AOD
MODIS showed AODvalues
valuesbetween
between0.190.19and
and0.33.
0.33.Within
Withinthethe 3 h gap
3 hour gapseparating
separating the
the two
two
measurements, an increase of AOD, followed by a decrease of Ångström Exponent
measurements, an increase of AOD, followed by a decrease of Ångström Exponent values, seemed values, seemed
to
to indicate
indicate higher
higher dust
dust concentrations
concentrations over
over the
the study
study area. This trend
area. This trend was
was observed
observed in
in true
true color
color
images
images asas air
air masses
masses traveled
traveled East-North
East‐North East.
East. Collocated
Collocated lidar
lidar measurements
measurements (Figure
(Figure 2)
2) showed
showed
thinner
thinner layers
layers of
of dust
dust over
over Cluj-Napoca
Cluj‐Napoca at at 10:13
10:13 UTC,
UTC, while
while thicker
thicker layers
layers were
were observed
observed two
two hours
hours
later
later (Figure
(Figure 3). Both AOD
3). Both AOD andand Ångström
Ångström Exponent
Exponent satellite
satellite data
data showed
showed strong
strong correlation
correlation with
with the
the
equivalent
equivalent AERONET
AERONET parameters
parameters [58].
[58].
The particle size can be estimated using the Ångström Exponent, as this parameter is inversely
related to the particle size. Regarding the range of observed values, because of the relatively low
values of Ångström Exponent (less than 1), it is inferred that the majority of particles are coarse.
Furthermore, the range of AOD values indicates that the thickness/density of particles in the air does
not reach a critical threshold (which leads to an intense decrease in visibility) yet.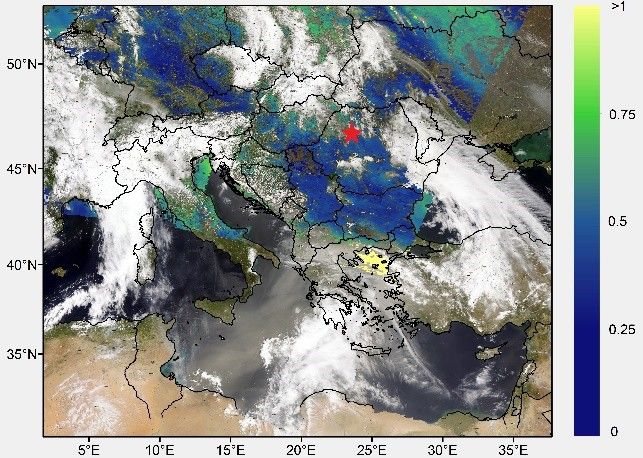
Atmosphere 2020, 11, 364 8 of 14
Atmosphere 2019, 10, x FOR PEER REVIEW 8 of 14
Atmosphere 2019, 10, x FOR PEER REVIEW 8 of 14
(a) (b)
Figure 4.
Figure 4. AOD MODIS Terra
Terra (a)
(a) and
and Aqua
Aqua (b)
(b) for
for April
Aprilthe 24th2019.
the24th 2019
The particle
In Figure sizeÅngström
5 the can be estimated
Exponent using the Ångström
values derived from Exponent,
the 10 ×as10this kmparameter
MODIS level is inversely
2 AOD
related
products to the
are particle size. Regarding
superimposed over a truethecolor
rangeimage
of observed values,
of Eastern because
Europe. A(b) of themass
large relatively
of dust low values
aerosols
of
canÅngström
be observed Exponent
over the (a)Mediterranean
(less than 1), it is inferred
Sea andthat Thethe majority
Balkans. Theofsatellite
particlessensor
are coarse.
onboard Furthermore,
Terra and
the
Aquarange of AODaerosol
retrieved values4.parameters
Figure indicates
AOD MODIS thatatTerra
the thickness/density
10:00 UTCAqua
(a) and forofApril
and(b)11:45 particles
UTC, in
th the
2019air does
respectively.
the 24 Terranot MODIS
reach a
critical
retrievalsthreshold
exhibit (which
Ångström leadsExponent
to an intensevaluesdecrease
betweenin visibility)
0 and 1.5 yet. over Romania, with lower values
In Figure
In Figure
ranging 5
from 05 to the
the1.2Ångström
Ångström Exponent
Exponent Aqua
over Transylvania. values
valuesMODISderived from
derivedretrievals the
from theexhibit10 ××10
10 10 km MODIS
km
Ångström MODIS level 22values
level
Exponent AOD
AOD
products
products
between are are
0 andsuperimposed
superimposed
1.2 over Romania, over a true
over a with color
true color image
lowerimage of Eastern
valuesofranging
Easternfrom Europe.
Europe.0 to AA large
large
0.95 mass
mass
over of dust aerosols
of dust aerosols
Transylvania. These
can
can beobserved
be
values observed overthe
over
are consistent the
with Mediterranean
Mediterranean
ones reportedSea Sea andliterature
in and
the TheBalkans.
The Balkans. Thesatellite
The
for mineral satellite sensor
dustsensor
[59]. onboardTerra
onboard
Considering Terra and
thatandthe
Aqua
Aqua retrieved
retrieved
dust particle aerosol
sizeaerosol parameters
is usuallyparameters at
much bigger 10:00
at 10:00UTC and 11:45
UTC andwith
in comparison UTC,
11:45 respectively.
UTC, respectively.
urban‐industrial Terra MODIS retrievals
Terra MODIS
and biomass burning
exhibit
aerosol,Ångström
retrievals itexhibit Exponent values
can be Ångström
concluded that thebetween
Exponent values0 and
analyzed dust1.5
between over
plume Romania,
0 and
is with
1.5severely
not over lower values
Romania,
polluted with ranging
lower
nor heavily from
values
mixed
0with
to 1.2
ranging over 0Transylvania.
from
smoke. Aqua MODIS
to 1.2 over Transylvania. Aquaretrievals
MODISexhibit Ångström
retrievals exhibit Exponent
Ångström valuesExponent between
values0
and 1.2 over
between 0 andRomania,
1.2 over with lowerwith
Romania, valueslowerranging
valuesfrom 0 to 0.95
ranging fromover0 toTransylvania. These values
0.95 over Transylvania. Theseare
consistent
values with ones reported
are consistent with onesinreported
the literature
in thefor mineral for
literature dustmineral
[59]. Considering that the dustthat
dust [59]. Considering particle
the
size is usually much bigger in comparison with urban-industrial and
dust particle size is usually much bigger in comparison with urban‐industrial and biomass burning biomass burning aerosol, it can
be concluded that the analyzed dust plume is not severely polluted nor
aerosol, it can be concluded that the analyzed dust plume is not severely polluted nor heavily mixed heavily mixed with smoke.
with smoke.
(a) (b)
Figure 5. Ångström Exponent MODIS Terra (a) and Aqua (b) for April the 24th 2019
3.4. Modelling Data Analysis
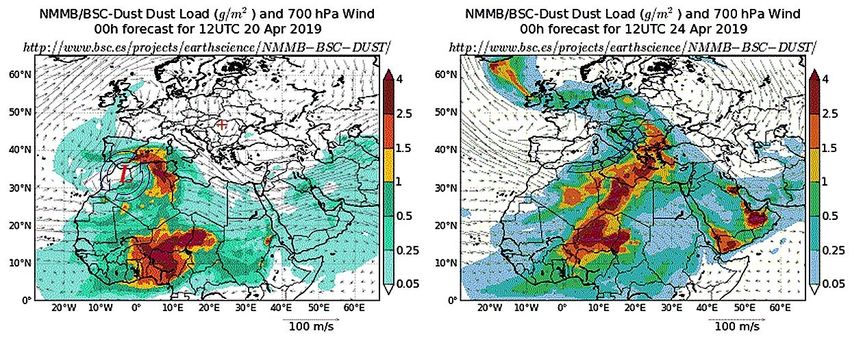
The NMMB/BSC dust (a) model [53] predicted the Saharan dust event, (b)as seen in Figure 6. The
cyclonic nucleus developed over north‐western Africa on April the 20th 2019 (marked with blue
Figure 5.5.Ångström
Figure6a),
arrows in Figure Ångström Exponent
and liftedExponent MODIS
MODISTerra
up a significant Terra (a)
(a) and
amount andofAqua
dust(b)
Aqua (b) for
that April
forwas
April the
the 24
carried th
24th 2019
2019.
out by upper level
southern and
3.4.Modelling south‐western
ModellingData
DataAnalysis
Analysis circulation (emphasized by blue arrow in Figure 6b). The dust intrusion
3.4.
covered many parts of Europe, including Transylvania. The model predicted a dust load value
The NMMB/BSC
The
between NMMB/BSC
1 and 1.5 g/m dust
dust model
2 overmodel [53] predicted
[53]
Cluj‐Napocapredictedthethe
at 12:00 Saharan
UTC fordust
Saharan event,
dust
April as seen
theevent,
24th asinseen
2019. Figure 6.
Thein700 The
hPacyclonic
Figure 6. Theis
wind
nucleus
cyclonic developed
the levelnucleus over north-western
developed
that corresponds toover
the layer Africa on
north‐western
centered April
Africa
on 3000on the 20th 2019
m,April
where the (marked
the20th
CLOP 2019 with bluewith
(marked
lidar detectedarrows
thebluein
first
Figure
arrows 6a),
dust layer and
in Figure lifted up
6a),3.and
in Figure a significant
Thelifted amount
up a significant
south‐western of dust
amount
circulation that
over was
ofthe carried
dust out
thatarea
same by
waswas upper
carried level
out by
revealed southern
upper
also at 400 and
level
hPa
southern and south‐western
level, corresponding circulation
with the (emphasized
altitude of 7000 m (notby blue here).
shown arrow in Figure 6b). The dust intrusion
covered many parts of Europe, including Transylvania. The model predicted a dust load value
between 1 and 1.5 g/m2 over Cluj‐Napoca at 12:00 UTC for April the 24th 2019. The 700 hPa wind is
the level that corresponds to the layer centered on 3000 m, where the CLOP lidar detected the first
dust layer in Figure 3. The south‐western circulation over the same area was revealed also at 400 hPa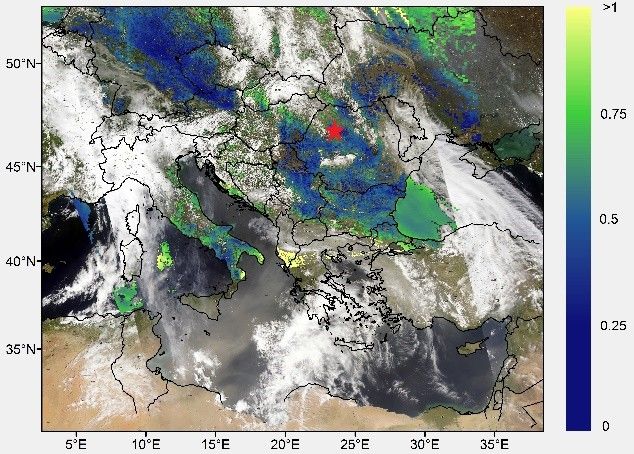
Atmosphere 2020, 11, 364                                                                                          9 of 14

south-western circulation (emphasized by blue arrow in Figure 6b). The dust intrusion covered many
parts of Europe, including Transylvania. The model predicted a dust load value between 1 and 1.5 g/m2
over Cluj-Napoca at 12:00 UTC for April the 24th 2019. The 700 hPa wind is the level that corresponds
to the layer centered on 3000 m, where the CLOP lidar detected the first dust layer in Figure 3. The
Atmosphere 2019, 10, x FOR PEER REVIEW
south-western     circulation
    Atmosphere 2019,                 the same area was revealed also at 400 hPa level, corresponding 9with
                                overREVIEW
                     10, x FOR PEER
                                                                                                      of 14
                                                                                                        9 of 14
the altitude of 7000 m (not shown here).

                              (a)                                                         (b)
                                    (a)                                                         (b)
      Figure 6. NMMB/BSC model dust load (pallete) and 700 hPa circulation (black arrows) for 20.04.2019,
         FigureNMMB/BSC
                 6. NMMB/BSC       model  dust  load (pallete) and 700 hPa circulation (black arrows) for 20.04.2019,
      Figure
      12 UTC6.(a),  and (b) formodel   dust
                                24.04.2019, load
                                            12:00(pallete)
                                                   UTC. and 700 hPa circulation (black arrows) for 20.04.2019,
         12 UTC
      12 UTC  (a), (a),
                   andand   (b) 24.04.2019,
                        (b) for for 24.04.2019, 12:00
                                            12:00 UTC.UTC.

      In order to determine the origin of the mineral dust layers detected over Cluj‐Napoca, we used
         In order
      In order      to determine
                to determine     thethe  origin
                                      origin     of the
                                             of the      mineral
                                                     mineral  dustdust  layers
                                                                    layers      detected
                                                                            detected   overover  Cluj‐Napoca,
                                                                                             Cluj-Napoca,      we we
                                                                                                                   usedused
the NOAA HYSPLIT back‐trajectories model. The back‐trajectories (Figure 7) show that the air
thethe
     NOAANOAA      HYSPLIT
              HYSPLIT           back‐trajectories
                         back-trajectories   model.model.     The back‐trajectories
                                                       The back-trajectories   (Figure (Figure    7) show
                                                                                        7) show that          that
                                                                                                        the air     the air
                                                                                                                masses
masses present over Transylvania–Cluj‐Napoca station on April the 24th 2019 during the lidar
    masses
present  overpresent   over Transylvania–Cluj‐Napoca
               Transylvania–Cluj-Napoca         station on Aprilstation  on 2019
                                                                   the 24th  Aprilduring
                                                                                     the 24th    2019 measurements
                                                                                            the lidar   during the lidar
measurements originated from the Saharan desert. Similar to the [60] study, we can analyze the air
    measurements
originated   from theoriginated     from the
                        Saharan desert.        Saharan
                                           Similar        desert.
                                                     to the       Similar
                                                            [60] study, wetocan
                                                                              theanalyze
                                                                                   [60] study,  wemasses
                                                                                           the air   can analyze
                                                                                                             dynamicsthe air
masses dynamics using Figure 7. For the trajectories that were obtained for a period of 72 hours
    masses
using        dynamics
        Figure  7. For theusing   Figure 7.that
                              trajectories    Forwere
                                                   the trajectories
                                                         obtained forthat  were obtained
                                                                        a period              for a period
                                                                                    of 72 h backward          of 72 the
                                                                                                          in time,    hours
backward in time, the traveling time from the African continent to the detection station (after leaving
    backward
traveling  timein  time,
                 from  thethe  traveling
                            African       time from
                                      continent  to thethe Africanstation
                                                         detection  continent   to leaving
                                                                           (after  the detection   station
                                                                                            the African     (after leaving
                                                                                                          continent)   is
the African continent) is less than 48 hours, which comes in support of the previous assumption that
lessthe African
     than         continent)
          48 h, which   comesisin less than 48
                                    support  of hours,   whichassumption
                                                the previous    comes in support
                                                                             that theofdust
                                                                                        theplume
                                                                                             previous    assumption
                                                                                                    is relatively  pure.that
the dust plume is relatively pure.
    the dust plume is relatively pure.

                     Figure 7.
                            7. HYSPLIT back‐trajectories  obtained for
                                                                   for 24.04.2019
                                                                       24.04.2019 at
                                                                                  at 12:00 UTC.
                                                                                           UTC.
                        FigureHYSPLIT
                     Figure             back-trajectories
                                7. HYSPLIT                obtained
                                           back‐trajectories obtained for 24.04.201912:00
                                                                                      at 12:00 UTC.

3.5. In-situ Ground Measurements Analysis
   3.5. In-situ Ground Measurements Analysis
      Regarding the in‐situ ground level particulate matter values, during the dust intrusion on April
         Regarding the in‐situ ground level particulate matter values, during the dust intrusion on April
the 24th 2019 we measured low values of PM10 and PM2.5 with an hourly average of 21 µg/m3 for     both
   the 24th 2019 we measured low values of PM    10 and PM2.5 with an hourly average of 21 µg/m3 for both
PM10 and PM2.5 and a maximum of 28 µg/m for    3      PM10 and 27 µg/m for PM2.5. These values are
                                                                        3
   PM10 and PM2.5 and a maximum of 28 µg/m3 for PM10 and 27 µg/m3 for PM2.5. These values are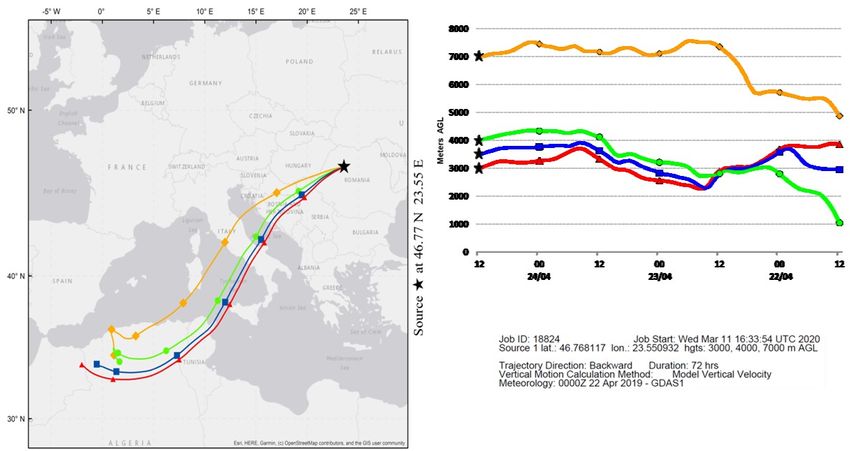
Atmosphere 2020, 11, 364                                                                              10 of 14

3.5. In-Situ Ground Measurements Analysis
     Regarding the in-situ ground level particulate matter values, during the dust intrusion on April
the 24th 2019 we measured low values of PM10 and PM2.5 with an hourly average of 21 µg/m3 for
both PM10 and PM2.5 and a maximum of 28 µg/m3 for PM10 and 27 µg/m3 for PM2.5 . These values
are consistent with other measurements reported for Cluj-Napoca city during the period for which
data was available from the National Air Quality Network [61]. We can therefore conclude that there
was a very limited dry deposition of Saharan dust particles in Cluj-Napoca during this event, and the
high-altitude transport continued further north.

4. Conclusions
     In this paper, we analyzed a severe dust outbreak over Transylvania, Romania, during April 2019,
using multiple remote sensing and in-situ instrumentation supported by modelling tools. These results
can also be considered representative for the Pannonian basin.
     Results show the presence of dust aerosol layers identified by the multi-wavelength Raman and
depolarization lidar at altitudes of 2500–4000 m, and 7000 m, respectively.
     An analysis of the optical and microphysical columnar properties from AERONET reveals an
increase in the aerosol optical depth (AOD), but the AOD range indicates that the density of lofted dust
particles has not reached a critical threshold that would affect visibility. Sun-photometer measurements
exhibit low values of the Ångström Exponent (1 µm) in the
AERONET particle size distribution.
     For the dust layers observed, the volume linear depolarization ratio obtained from the lidar’s 532
nm channel is 0.1–0.12, which is characteristic for mineral dust. The 532 nm particle depolarization
ratio is 0.24–0.27, and remains relatively constant within the dust layers, indicating that the mineral
dust particles are evenly spread.
     The variations in the spectral derivative of the SSA, along with lidar information about the
presence and depolarization characteristics of non-dust layers below 2500 m indicate the presence of
biomass burning and/or urban-industrial aerosols below 2500 m. Therefore, it can be concluded that
the dust layers above 2500 m are neither severely polluted nor heavily mixed with smoke.
     The analysis of the MODIS retrievals provides added value information on the spatial distribution
of the aerosol optical properties (AOD and Ångström Exponent) over Transylvania, and is in agreement
with the AERONET ground-based measurements from Cluj-Napoca.
     Based on these results, and on the HYSPLIT back-trajectory, NMMB/BSC forecast, and synoptic
analysis, we can confirm the presence of lofted Saharan dust layers over Cluj-Napoca, Romania during
the April 2019 outbreak.
     Collocated in-situ PM monitoring carried out with an optical particle counter showed that
dry deposition was low, with PM10 and PM2.5 concentrations similar to the seasonal averages
for Cluj-Napoca.
     The case analysis carried out in this paper can be an example of a comprehensive monitoring
and characterization of the Saharan dust plume in the north-western part of Romania. The results
of this article provide a variety of geo-spatial, temporal and qualitative information on the Saharan
dust intrusion in the Transylvania and Pannonian basins. This source of information, obtained from
various multi-modal datasets, can help in the forecast and management of this natural hazard in a
more efficient way.

Author Contributions: Conceptualization, N.A. and C.B.; Methodology, N.A. and H.S, .; Visualization, A.R. and
A.M., Writing—Review and Editing, N.A., C.B. and H.S, . All authors have read and agreed to the published
version of the manuscript.
Funding: This research was conducted using the research infrastructure purchased within the POSCCE Project
entitled “Development of Research Infrastructure for HPC-Based Disaster Management” – MADECIP, SMIS CODE
48801/1862, co-financed by the European Union through the European Regional Development Fund. This work
Atmosphere 2020, 11, 364 11 of 14
was partially supported by a grant of the Romanian Ministry of Research and Innovation, CCCDI - UEFISCDI,
project number 87 PCCDI/2018, project registration code PN-III-P1-1.2-PCCDI-2017-0868, within PNCDI III.
Acknowledgments: The authors gratefully acknowledge the NOAA Air Resources Laboratory (ARL) for the
provision of the HYSPLIT transport and dispersion model and READY website (http://www.ready.noaa.gov)
used in this publication. Images from the NMMB/BSC-Dust model, operated by the Barcelona Supercomputing
Center (http://www.bsc.es/ess/bsc-dust-daily-forecast/) were used in this study. AERONET-Europe/ACTRIS for
calibration and maintenance services. The research leading to these results has received funding from European
Union’s Horizon 2020 research and innovation programme under grant agreement No 654109. The authors would
like to acknowledge Simona Andrei, from the National Institute for R&D in Optoelectronics–INOE2000, Magurele,
RO for her help in the synoptic analysis.
Conflicts of Interest: The authors declare no conflict of interest.
References
1. Intergovernmental Panel on Climate Change. Climate Change 2013–The Physical Science Basis: Working Group
I Contribution to the Fifth Assessment Report of the Intergovernmental Panel on Climate Change; Cambridge
University Press: Cambridge, UK; New York, NY, USA, 2014. [CrossRef]
2. Díaz, J.; Linares, C.; Carmona, R.; Russo, A.; Ortiz, C.; Salvador, P.; Trigo, R.M. Saharan dust intrusions in
Spain: Health impacts and associated synoptic conditions. Environ. Res. 2017, 156, 455–467. [CrossRef]
[PubMed]
3. Stafoggia, M.; Zauli-Sajani, S.; Pey, J.; Samoli, E.; Alessandrini, E.; Basagaña, X.; Cernigliaro, A.; Chiusolo, M.;
Demaria, M.; Díaz, J.; et al. MED-PARTICLES Study Group. Desert dust outbreaks in Southern Europe:
Contribution to daily PM10 concentrations and short-term associations with mortality and hospital admissions.
Environ. Health Perspect. 2016, 124, 413–419. [CrossRef] [PubMed]
4. Ai, N.; Polenske, K.R. Socioeconomic impact analysis of yellow-dust storms: An approach and case study for
Beijing. Econ. Syst. Res. 2008, 20, 187–203. [CrossRef]
5. Al-Hemoud, A.; Al-Sudairawi, M.; Neelamanai, S.; Naseeb, A.; Behbehani, W. Socioeconomic effect of dust
storms in Kuwait. Arab. J. Geosci. 2017, 10, 18. [CrossRef]
6. Andreae, M. Climate effects of changing atmospheric aerosol levels. In World Survey of Climatology, Future
Climate of the World; Henderson Sellers, A.H., Ed.; Elsevier: New York, NY, USA, 1995; Volume 16, pp. 341–392.
7. Nicolae, V.; Talianu, C.; Andrei, S.; Antonescu, B.; Ene, D.; Nicolae, D.; Dandocsi, A.; Toader, V.-E.; S, tefan, S.;
Savu, T.; et al. Multiyear Typology of Long-Range Transported Aerosols over Europe. Atmosphere 2019, 10, 482.
[CrossRef]
8. Papayannis, A.; Amiridis, V.; Mona, L.; Tsaknakis, G.; Balis, D.; Bösenberg, J.; Chaikovski, A.; De Tomasi, F.;
Grigorov, I.; Mattis, I.; et al. Systematic lidar observations of Saharan dust over Europe in the frame of
EARLINET (2000–2002). J. Geophys. Res. 2008, 113. [CrossRef]
9. Salvador, P.; Almeida, S.M.; Cardoso, J.; Almeida-Silva, M.; Nunes, T.; Cerqueira, M.; Alves, C.; Reis, M.A.;
Chaves, P.C.; Artinano, B.; et al. Composition and origin of PM10 in Cape Verde: Characterization of
long-range transport episodes. Atmos. Environ. 2016, 127, 326–339. [CrossRef]
10. Ravi, S.; D’Odorico, P.; Breshears, D.D.; Field, J.P.; Goudie, A.S.; Huxman, T.E.; Li, J.; Okin, G.S.; Swap, R.J.;
Thomas, A.D.; et al. Aeolian processes and the biosphere. Rev. Geophys. 2011, 49, RG3001. [CrossRef]
11. Shao, Y.; Wyrwoll, K.-H.; Chappell, A.; Huang, J.; Lin, Z.; Mctainsh, G.H.; Mikami, M.; Tanaka, T.Y.; Wang, X.;
Yoon, S. Dust cycle: An emerging core theme in Earth system science. Aeolian Res. 2011, 2, 181–204. [CrossRef]
12. Querol, X.; Pey, J.; Pandolfi, M.; Alastuey, A.; Cusack, M.; Pérez, N.; Moreno, T.; Viana, M.; Mihalopoulos, N.;
Kallos, G.; et al. African dust contributions to mean ambient PM10 mass-levels across the Mediterranean
Basin. Atmos. Environ. 2009, 43, 4266–4277. [CrossRef]
13. Kallos, G.; Astitha, M.; Katsafados, P.; Spyrou, C. Long-Range Transport of Anthropogenically and Naturally
Produced Particulate Matter in the Mediterranean and North Atlantic: Current State of Knowledge. J. Appl.
Meteorol. Clim. 2007, 46, 1230–1251. [CrossRef]
14. Lamancusa, C.; Wagstrom, K. Global transport of dust emitted from different regions of the Sahara. Atmos.
Environ. 2019, 214, 1–10. [CrossRef]
15. Sicard, M.; Barragan, R.; Dulac, F.; Alados-Arboledas, L.; Mallet, M. Aerosol optical, microphysical and
radiative properties at regional background insular sites in the western Mediterranean. Atmos. Chem. Phys.
2016, 16, 12177–12203. [CrossRef]Atmosphere 2020, 11, 364 12 of 14
16. Cuevas, E.; Gómez-Peláez, A.J.; Rodríguez, S.; Terradellas, E.; Basart, S.; Garcia, R.D.; Garcia, O.E.;
Alonso-Perez, S. The pulsating nature of large-scale Saharan dust transport as a result of interplays between
mid-latitude Rossby waves and the North African Dipole Intensity. Atmos. Environ. 2017, 167, 586–602.
[CrossRef]
17. Mona, L.; Amodeo, A.; Pandolfi, M.; Pappalardo, G. Saharan dust intrusions in the Mediterranean area:
Three years of Raman lidar measurements. J. Geophys. Res. 2006, 111, D16. [CrossRef]
18. Marinou, E.; Amiridis, V.; Binietoglou, I.; Tsikerdekis, A.; Solomos, S.; Proestakis, E.; Konsta, D.;
Papagiannopoulos, N.; Tsekeri, A.; Vlastou, G.; et al. Three-dimensional evolution of Saharan dust
transport towards Europe based on a 9-year EARLINET-optimized CALIPSO dataset. Atmos. Chem. Phys.
2017, 17, 5893–5919. [CrossRef]
19. Israelevich, P.; Ganor, E.; Alpert, P.; Kishcha, P.; Stupp, A. Predominant transport paths of Saharan dust over
the Mediterranean Sea to Europe. J. Geophys. Res. 2012, 117, 2205. [CrossRef]
20. Janicka, L.; Stachlewska, I.S.; Veselovskii, I.; Baars, H. Temporal variations in optical and microphysical
properties of mineral dust and biomass burning aerosol derived from daytime Raman lidar observations
over Warsaw, Poland. Atmos. Environ. 2017, 169, 162–174. [CrossRef]
21. Osborne, M.; Malavelle, F.F.; Adam, M.; Buxmann, J.; Sugier, J.; Marenco, F.; Haywood, J. Saharan dust
and biomass burning aerosols during ex-hurricane Ophelia: Observations from the new UK lidar and
sun-photometer network. Atmos. Chem. Phys. 2019, 19, 3557–3578. [CrossRef]
22. Bègue, N.; Tulet, P.; Chaboureau, J.-P.; Roberts, G.; Gomes, L.; Mallet, M. Long-range transport of Saharan
dust over northwestern Europe during EUCAARI 2008 campaign: Evolution of dust optical properties by
scavenging. J. Geophys. Res. 2012, 117, D17201. [CrossRef]
23. Abdelkader, M.; Metzger, S.; Mamouri, R.E.; Astitha, M.; Barrie, L.; Levin, Z.; Lelieveld, J. Dust–air pollution
dynamics over the eastern Mediterranean. Atmos. Chem. Phys. 2015, 15, 9173–9189. [CrossRef]
24. S, tefănie, H.; Ajtai, N.; Botezan, C.; T, oancă, F.; Török, Z.; Ozunu, A. Detection of a desert dust intrusion over
ClujNapoca, Romania using an elastic backscatter LIDAR system. Ecoterra-J. Environ. Res. Prot. 2015, 12,
50–55.
25. Tudose, O.G. Contributions to the Study of Atmospheric Aerosols Optical Properties Using Remote Sensing
Techniques. Ph.D. Thesis, Alexandru Ioan Cuza University of Iasi, Iasi, Romania, 2013.
26. Rogora, M.; Mosello, R.; Marchetto, A. Long-term trends in the chemistry of atmospheric deposition in
Northwestern Italy: The role of increasing Saharan dust deposition. Tellus B Chem. Phys. Meteorol. 2004, 56,
426–434. [CrossRef]
27. Papagiannopoulos, N.; D’Amico, G.; Gialitaki, A.; Ajtai, N.; Alados-Arboledas, L.; Amodeo, A.; Amiridis, V.;
Baars, H.; Balis, D.; Binietoglou, I.; et al. An EARLINET Early Warning System for atmospheric aerosol
aviation hazards. Atmos. Chem. Phys. Discuss. 2020. in review. [CrossRef]
28. Cazacu, M.M.; Tudose, O.G.; Timofte, A.; Rusu, O.; Apostol, L.; Leontie, L.; Gurlui, S. A case study of the
behavior of aerosol optical properties under the incidence of a saharan dust intrusion event. Appl. Ecol.
Environ. Res. 2016, 14, 183–194. [CrossRef]
29. Labzovskii, L.; Toanca, F.; Nicolae, D. Determination of saharan dust properties over bucharest, Romania
part 2: Study cases analysis. Rom. J. Phys. 2014, 59, 1097–1108.
30. Gothard, M.; Nemuc, A.; Radu, C.; Dascalu, S. An intensive case of saharan dust intrusion over south east
Romania. Rom. Rep. Phys. 2014, 66, 509–519.
31. Rosu, I.A.; Cazacu, M.M.; Prelipceanu, O.S.; Agop, M. A Turbulence-Oriented Approach to Retrieve Various
Atmospheric Parameters Using Advanced Lidar Data Processing Techniques. Atmosphere 2019, 10, 38.
[CrossRef]
32. Ajtai, N.; Stefanie, H.; Arghius, V.; Meltzer, M.; Costin, D. Characterization of Aerosol Optical and
Microphysical Properties Over North-Western Romania In Correlation with Predominant Atmospheric
Circulation Patterns. In Proceedings of the 17th International Multidisciplinary Scientific Geoconference
(SGEM 2017), Albena, Bulgaria, 29 June–5 July 2017. [CrossRef]
33. Ajtai, N.; S, tefănie, H.; Ozunu, A. Description of aerosol properties over Cluj-Napoca derived from AERONET
sun photometric data. Environ. Eng. Manag. J. 2013, 12, 227–232. [CrossRef]
34. Talianu, C.; Nemuc, A.; Nicolae, D.; Cristescu, C.P. Dust Event Detection from Lidar Measurements. Sci. Bull.
Politeh. Univ. Buchar. Ser. A Appl. Math. Phys. 2007, 69, 53–62.Atmosphere 2020, 11, 364 13 of 14
35. Cazacu, M.M.; Tudose, O.; Boscornea, A.; Buzdugan, L.; Timofte, A.; Nicolae, D. Vertical and temporal
variation of aerosol mass concentration at Magurele–Romania during EMEP/PEGASOS campaign.
Rom. Rep. Phys. 2017, 69, 1–15.
36. Mărmureanu, L.; Marin, C.A.; Andrei, S.; Antonescu, B.; Ene, D.; Boldeanu, M.; Vasilescu, J.; Vit, elaru, C.;
Cadar, O.; Levei, E. Orange Snow—A Saharan Dust Intrusion over Romania During Winter Conditions.
Remote Sens. 2019, 11, 2466. [CrossRef]
37. Severe Weather Europe. Available online: http://www.severe-weather.eu/mcd/extent-of-airborne-saharan-
dust-over-europe-on-wednesday-and-thursday/ (accessed on 3 October 2019).
38. Pappalardo, G.; Amodeo, A.; Apituley, A.; Comeron, A.; Freudenthaler, V.; Linné, H.; Ansmann, A.;
Bösenberg, J.; D’Amico, G.; Mattis, I.; et al. EARLINET: Towards an advanced sustainable 20 European
aerosol lidar network. Atmos. Meas. Tech. 2014, 7, 2389–2409. [CrossRef]
39. Holben, B.N.; Eck, T.F.; Slutsker, I.; Tanre, D.; Buis, J.P.; Setzer, A.; Vermote, E.; Reagan, J.A.; Kaufman, Y.;
Nakajima, T.; et al. AERONET-A federated instrument network and data archive for aerosol characterization.
Remote Sens. Environ. 1998, 66, 1–16. [CrossRef]
40. ACTRIS. Available online: https://www.actris.eu/ (accessed on 6 September 2019).
41. AERONET. Available online: https://aeronet.gsfc.nasa.gov/ (accessed on 12 September 2019).
42. Dubovik, O.; King, M. A flexible inversion algorithm for retrieval of aerosol optical properties from Sun and
sky radiance measurements. J. Geophys. Res. 2000, 105, 20673–20696. [CrossRef]
43. Ångström, A. The parameters of atmospheric turbidity. Tellus 1964, 16, 64–75. [CrossRef]
44. European Aerosol Research Lidar Network. Available online: https://www.earlinet.org (accessed on 18
September 2019).
45. Freudenthaler, V. About the efects of polarising optics on lidar signals and the D90 calibration. Atmos. Meas.
Tech. 2016, 9, 4181–4255. [CrossRef]
46. Belegante, L.; Bravo-Aranda, J.A.; Freudenthaler, V.; Nicolae, D.; Nemuc, A.; Ene, D.; Alados-Arboledas, L.;
Amodeo, A.; Pappalardo, G.; D’Amico, G.; et al. Experimental techniques for the calibration of lidar
depolarization channels in EARLINET. Atmos. Meas. Tech. 2018, 11, 1119–1141. [CrossRef]
47. Sayer, A.M.; Munchak, L.A.; Hsu, N.C.; Levy, R.C.; Bettenhausen, C.; Jeong, M.-J. MODIS Collection 6
aerosol products: Comparison between Aqua’s e-Deep Blue, Dark Target, and merged data sets, and usage
recommendations. J. Geophys. Res. 2014, 119, 13965–13989. [CrossRef]
48. Levy, R.C.; Remer, L.A.; Tanré, D.; Mattoo, S.; Kaufman, Y.J. Algorithm for Remote Sensing of Tropospheric
Aerosol over Dark Targets from MODIS: Collections 005 and 051: Revision 2; MODIS Algorithm Theoretical
Basis Document. 2009. Available online: https://atmosphere-imager.gsfc.nasa.gov/sites/default/files/
ModAtmo/ATBD_MOD04_C005_rev2_0.pdf (accessed on 3 October 2019).
49. Levy, R.C.; Mattoo, S.; Munchak, L.A.; Remer, L.A.; Sayer, A.M.; Patadia, F.; Hsu, N.C. The Collection 6
MODIS aerosol products over land and ocean. Atmos. Meas. Tech. 2013, 6, 2989–3034. [CrossRef]
50. Hsu, N.C.; Jeong, M.-J.; Bettenhausen, C.; Sayer, A.M.; Hansell, R.; Seftor, C.S.; Huang, J.; Tsay, S.-C. Enhanced
Deep Blue aerosol retrieval algorithm: The second generation. J. Geophys. Res. Atmos. 2013, 118, 9296–9315.
[CrossRef]
51. Remer, L.A.; Mattoo, S.; Levy, R.C.; Munchak, L.A. MODIS 3 km aerosol product: Algorithm and global
perspective. Atmos. Meas. Tech. 2013, 6, 1829–1844. [CrossRef]
52. Draxler, R.R.; Rolph, G.D. HYSPLIT (HYbrid Single-Particle Lagrangian Integrated Trajectory) Model Access
via NOAA ARL READY Website. NOAA Air Resources Laboratory. 2015; College Park. Available online:
http://www.arl.noaa.gov/HYSPLIT.php (accessed on 11 March 2020).
53. Pérez, C.; Haustein, K.; Janjic, Z.; Jorba, O.; Huneeus, N.; Baldasano, J.M.; Black, T.; Basart, S.; Nickovic, S.;
Miller, R.L.; et al. An online mineral dust aerosol model for meso to global scales: Model description, annual
simulations and evaluation. Atmos. Chem. Phys. 2011, 11, 13001–13027. [CrossRef]
54. Dubovik, O.; Holben, B.; Eck, T.; Smirnov, A.; Kaufman, Y.; King, M.; Tanré, D.; Slutsker, I. Variability of
Absorption and Optical Properties of Key Aerosol Types Observed in Worldwide Locations. J. Atmos. Sci.
2002, 59, 590–608. [CrossRef]
55. Li, J.; Carlson, B.E.; Lacis, A.A. Using single-scattering albedo spectral curvature to characterize East Asian
aerosol mixtures. J. Geophys. Res. Atmos. 2015, 120, 2037–2052. [CrossRef]Atmosphere 2020, 11, 364 14 of 14
56. Groß, S.; Gasteiger, J.; Freudenthaler, V.; Wiegner, M.; Geiß, A.; Schladitz, A.; Toledano, C.; Kandler, K.;
Tesche, M.; Ansmann, A.; et al. Characterization of the planetary boundary layer during SAMUM-2 by
means of lidar measurements. Tellus B 2011, 63, 695–705. [CrossRef]
57. Tesche, M.; Gross, S.; Ansmann, A.; Müller, D.; Althausen, D.; Freudenthaler, V.; Esselborn, M. Profiling of
Saharan dust and biomass-burning smoke with multiwavelength polarization Raman lidar at Cape Verde.
Tellus B Chem. Phys. Meteorol. 2011, 63, 649–676. [CrossRef]
58. Li, L.; Sokolik, I. Analysis of Dust Aerosol Retrievals Using Satellite Data in Central Asia. Atmosphere 2018, 9,
288. [CrossRef]
59. Kalashnikova, O.V.; Kahn, R.A. Mineral dust plume evolution over the Atlantic from MISR and MODIS
aerosol retrievals. J. Geophys. Res. 2008, 113, D24. [CrossRef]
60. Soupiona, O.; Samaras, S.; Ortiz-Amezcua, P.; Böckmann, C.; Papayannis, A.; Moreira, G.A.;
Benavent-Oltra, J.A.; Guerrero-Rascado, J.L.; Bedoya-Velasquez, A.E.; Olmo, F.J.; et al. Retrieval of optical and
microphysical properties of transported Saharan dust over Athens and Granada based on multi-wavelength
Raman lidar measurements: Study of the mixing processes. Atmos. Environ. 2019, 214, 116824. [CrossRef]
61. Calitate Aer. Available online: www.calitateaer.ro (accessed on 25 September 2019).
© 2020 by the authors. Licensee MDPI, Basel, Switzerland. This article is an open access
article distributed under the terms and conditions of the Creative Commons Attribution
(CC BY) license (http://creativecommons.org/licenses/by/4.0/).You can also read