MULTIPLEX NEW ZEALAND PROPERTY FUND - YEAR IN REVIEW 2011 ARSN 110 281 055 - RESPONSIBLE ENTITY BROOKFIELD CAPITAL MANAGEMENT LIMITED
←
→
Page content transcription
If your browser does not render page correctly, please read the page content below

Multiplex NEW ZEALAND
PROPERTY FUND
ARSN 110 281 055

Year In Review 2011

Responsible Entity
Brookfield Capital
Management Limited
ACN 094 936 866
AFSL 223809

Multiplex New Zealand Property Fund
                                                     consists of nine office assets, one retail
                                                     asset and one industrial asset located
                                                     predominantly in Auckland and
                                                     Wellington. The total portfolio is valued
                                                     at NZ$454.15 million.

   1  Message from the Chairman
   2  Year in Review
   4	Performance at a Glance
   6	Property Analysis
 IBC	Investor Relations
  BC  Corporate Directory

		    Cover image: Conservation House, Wellington.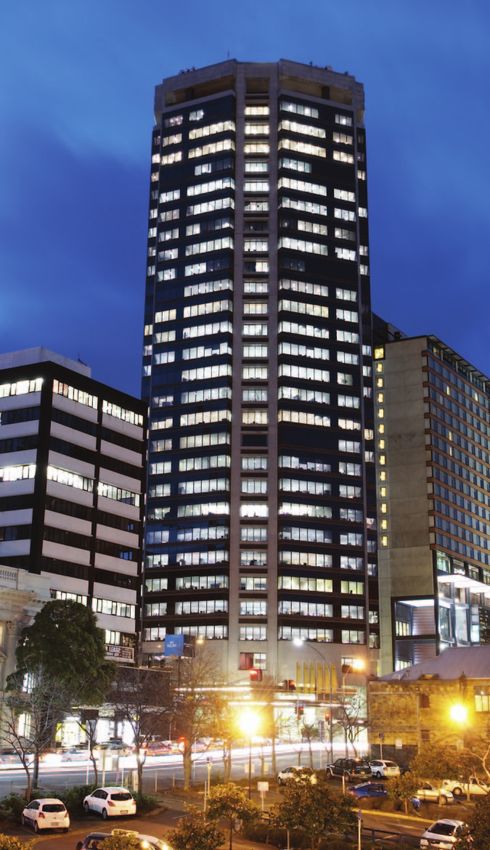
1                                                                             Multiplex NEW ZEALAND Property Fund Year In Review 2011

Message from
the Chairman

On behalf of the Board of Brookfield Capital Management             BOARD AND MANAGEMENT
Limited, enclosed is the Multiplex New Zealand Property Fund        Tim Harris resigned from the Board and was replaced by
(the Fund) year in review for the year ended 30 June 2011.          Shane Ross, Brookfield Australia Investments Group General
                                                                    Manager, Treasury. The Board is otherwise unchanged with a
FINANCIAL RESULTS (A$ unless otherwise specified)                   majority of independent directors. Details of the directors of
The Fund reported a net loss of $10.4 million which reflects        BCML are included in the Fund’s financial report.
a declining property market in New Zealand.
                                                                    OUTLOOK
Net assets of the Fund as at 30 June 2011 were $128.5 million       Together with managing the Fund’s debt position, the Board
and the Net Tangible Assets (NTA) were $0. 59 per unit.             is committed to securing the value of the Fund’s properties
                                                                    through active management of major lease expiries and
DEBT REDUCTION                                                      maximising unitholder value as we approach the Fund
During the year the strategy was to continue to reduce              review in May 2012.
gearing of the Fund. This was achieved by reducing
the size of the property portfolio where an appropriate             The Fund’s debt facility currently restricts payment
price could be obtained.                                            of distributions. Any excess cashflow from the Fund’s
                                                                    operations is used to secure new leases in Fund properties
The Fund settled the sale of 180 Molesworth Street, ANZ             where there are vacancies and to meet ongoing capital
Business Centre, Valley Mega Centre Stages 1 and 2 and              expenditure requirements.
70 Symonds Street, Auckland. The combined net proceeds
from settlement of these properties was approximately               Please visit www.au.brookfield.com for the Fund’s annual
NZ$115.4 million, which was applied to further reduce debt.         financial report. On behalf of the Board, thank you for your
                                                                    ongoing support.
Refinancing the debt facility with a 12 month extension
to 30 August 2012 was an important outcome for the
Fund. It allowed the Board to consider the optimal way
for investors to exit the Fund and permits the Fund to
maximise proceeds from the sale of any other properties.

As at 30 June 2011 the Fund was in compliance with all
covenants under its debt facility.

EXIT STRATEGY FOR INVESTORS
In May 2011, investors were advised that the Board resolved to
extend the Fund by 12 months. Investors will be provided with
a notice before 30 May 2012 asking them to advise whether
or not they want to continue to own units in the Fund for a
further specified period (which will be no more than seven
years) or whether they want to sell or withdraw from the Fund.

Subsequent to investors advising of their decision, the Board
will determine the appropriate strategy to meet investor
requirements. Properties may be required to be sold in order
to facilitate investors exiting the Fund. Therefore, the amount                                      F. Allan McDonald,
to be received by investors and timing of receipt will be subject                                    Independent Chairman
to market conditions at the time.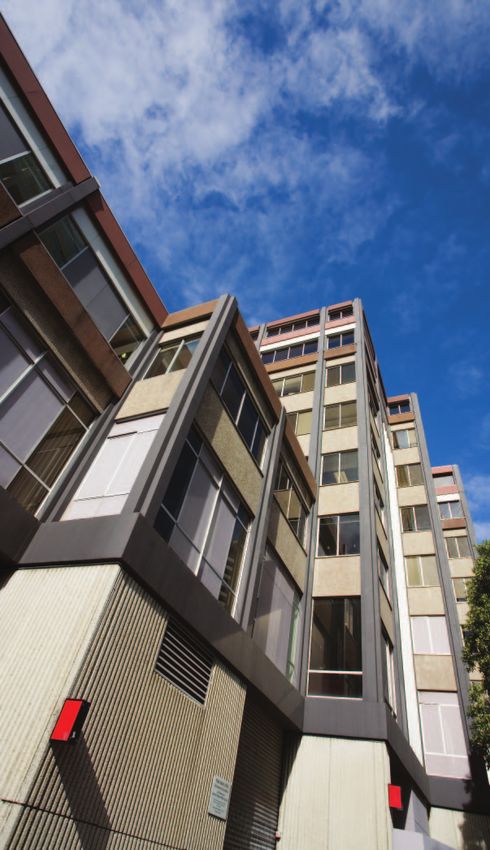
2

Year in Review

Brookfield Capital Management Limited (BCML) the                   After signing the Hereford Street lease the portfolio occupancy
responsible entity of Multiplex New Zealand Property               was 95%. The portfolio weighted average lease term was
Fund (the Fund) provides a review of the financial year            4.84 years and weighted average market capitalisation rate
ended 30 June 2011.                                                was 8.81%.

FINANCIAL RESULTS (A$ unless otherwise specified)                  Five asset sales were settled during the financial year for total
The Fund reported a net loss of $10.4 million, which includes      gross sale proceeds of NZ$117 million. In addition, 1-11 Short
$25.3 million of unrealised losses on revaluations of the          Street in Auckland was sold in July 2011 for net proceeds of
Fund’s property portfolio. This is a reflection of the declining   NZ$8.3 million.
New Zealand property market.
                                                                   The entire portfolio was externally valued as at 30 June 2011 at
Key financial results for the financial year ended 30 June 2011    NZ$454.15 million ($350.6 million). This equates to a reduction
include:                                                           of 4.4% compared to 30 June 2010. The reduction in value was
–– total revenue and other income of $49.1 million                 primarily a result of an increase in the portfolio’s weighted
   (2010: $66.6 million);                                          average market capitalisation rate by 0.8% and a reduction in
–– Net assets attributable to unitholders of $128.5 million        net effective market rents. The greatest reduction in portfolio
   (2010: $148.3 million);                                         value on a sector basis was for the office assets, with a
–– Net tangible asset (NTA) per unit of $0.59 (2010: $0.68);       decrease in value of 5% compared to 30 June 2010.
   and
–– weighted average lease term of 4.84 years (2010: 4.92           An important milestone for the Fund, and one of the largest
   years) and portfolio occupancy rate is 95% (2010: 99%).         leasing transactions in 2011, was leasing 72% (11,232 sqm)
                                                                   of previously vacant 8 Hereford Street (Telecom House)
ASSET MANAGEMENT                                                   to Auckland Council for an initial three year term. The
As at 30 June 2011, the Fund’s portfolio consisted of:             deal reflects the quality of the property and Brookfield’s
–– 9 commercial assets valued at NZ$348.65 million;                commitment to deliver on the requirements of tenants.
–– 1 retail asset valued at NZ$36.0 million; and
–– 1 industrial asset valued at NZ$69.5 million.                   The Fund leased approximately 34,000 square metres,
                                                                   predominantly in its Auckland office portfolio during 2011,
                                                                   with significant transactions including Hereford Street,
                                                                   the Plaza Building, 70 Symonds Street and 1-11 Short Street.

                                                                       77% Commercial
                                                                        8% Retail
                                                                       15% Industrial

Portfolio                                                          sector allocation (by value)

Analysis                                                               77% Commercial
                                                                        8% Retail
                                                                       15% Industrial

                                                                   GEOGRAPHIC allocation (by value)

                                                                       76% Auckland
                                                                       16% Wellington
                                                                        8% Provincial

                                                                       76% Auckland
                                                                       16% Wellington
                                                                        8% Provincial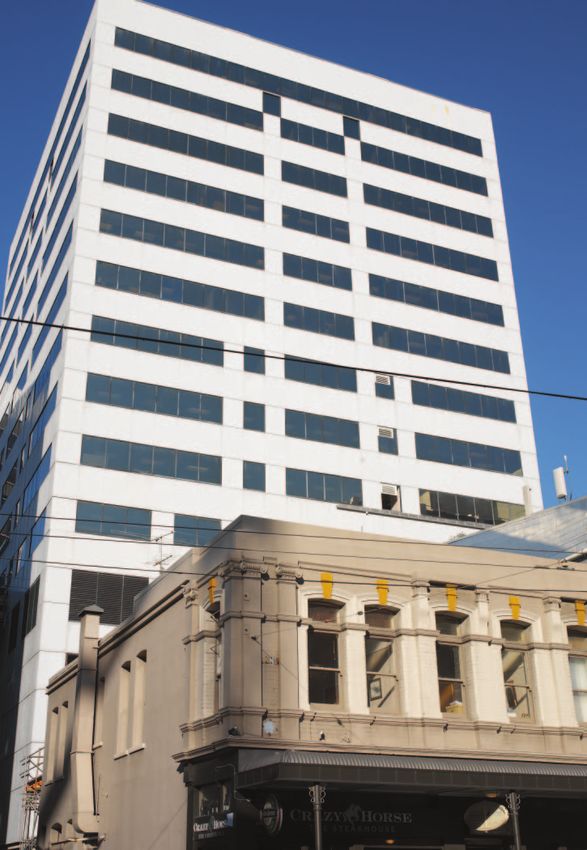
3                                                                              Multiplex NEW ZEALAND Property Fund Year In Review 2011

NEW ZEALAND PROPERTY MARKET                                          The Fund leased approximately 34,000
The Auckland Office market to 30 June 2011 generally exhibited
the same trends as 2010. This is seen through a firming level
                                                                     square metres, predominantly in its
of leasing enquiry, stabilised capitalisation rates, transactional   Auckland office portfolio during 2011,
activity dominated by private investors/syndicates and               with significant transactions including
competitive incentives subduing net effective rentals. The
Wellington office market shows indications of lagging behind
                                                                     Hereford Street, the Plaza Building,
Auckland, with an expanding forecast vacancy, capitalisation         70 Symonds Street and 1-11 Short Street
rates and increasing incentives against a backdrop of limited
tenant enquiry.

Overall, the Auckland CBD vacancy rate has expanded to               As at 30 June 2011 the LVR of the Fund was 59.5% and the
13.3% from 12.7% in June 2010. Forecasts show continual              Fund was in compliance will all covenants in the facility.
improvement over the next five years on historically low net
supply and regional economic growth. Wellington’s overall            The Fund is restricted from paying any management fees
CBD vacancy is 9.8%, forecast to expand to 13.8% by the end          until the LVR is below 60%. Management fees have not
of 2011 on confirmed new supply, where it is forecast to remain      been paid since March 2008, although they continue to
on the expectation of limited Government and Institutional           be accrued in the Fund’s accounts. The amount to-date
demand for the next three years before gradually improving.          is approximately $14.6 million.

DEBT UPDATE                                                          DISTRIBUTIONS
During the year the Fund entered into a new facility with its        No distributions were paid during the period and the
financiers for a total of NZ$288.5 million. A key term of this       terms of the Fund’s debt facility restrict payment of
facility includes repayment of debt by 30 August 2012.               distributions until the LVR reduces below 55% (assuming
                                                                     all other covenants are satisfied).
Also included in the new facility was a revision of covenants
to reflect loan to value ratio (LVR) requirements, as follows:
–– 65% on commencement;
–– 60% by 30 June 2011; and
–– 55% by 30 June 2012.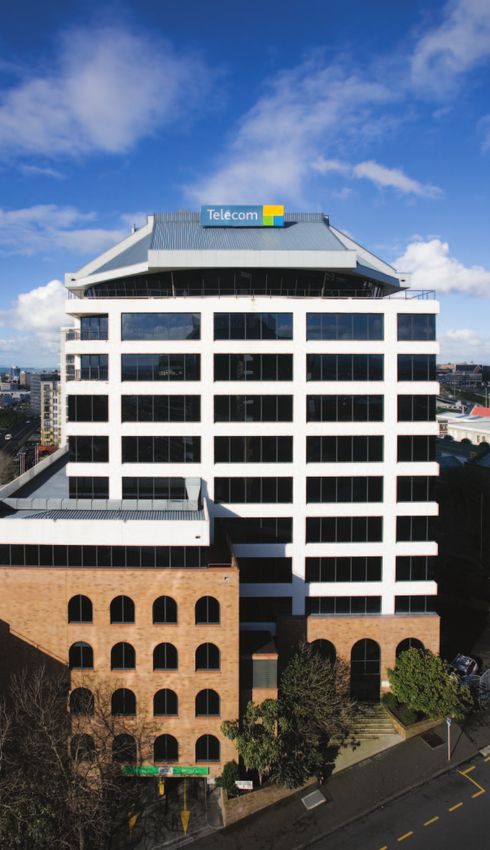
4

Performance
at a Glance

Fund statistics
                                                                                                                                              FY2011                                          FY2010
Total assets (including cash) (A$)                                                                                                370.6 million                                   503.74 million
Value of property assets (A$)                                                                                                     350.6 million                                   486.12 million
Value of property assets in (NZ$)                                                                                               454.15 million                                        597 million
Net Tangible Assets (NTA) per unit (A$)                                                                                                       0.59                                             0.68
Foreign exchange rate                                                                                                                       1.2953                                            1.2321

Cash distribution paid (for the year ended 30 June) CPU                                                                                          nil                                                 nil
Portfolio occupancy (%)                                                                                                                          95                                                  99
Portfolio weighted average lease term (years)                                                                                                 4.84                                               4.9
Portfolio weighted average capitalisation rate (%)                                                                                              8.8                                                  8.7

Fund snapshot (as at 30 June 2010)
Fund inception date                                                                                                                                                        7 September 2004
Fund loan to value ratio (%)                                                                                                                                                                    59.5
Management fee (%)                                                                                                                          0.7 (excluding GST) of gross asset value
Performance fee (%) 1                                                                                                                                               2.0 of gross asset value
Number of office assets                                                                                                                                                                               9
Number of retail assets                                                                                                                                                                                1
Number of industrial assets                                                                                                                                                                            1
Total number of assets                                                                                                                                                                                11
1.         his is only applicable if net asset value exceeds the capital subscribed. An additional 2% of gross asset value is payable provided unitholders have achieved a 50% premium on capital
          T
          subscribed (less any capital returns).

Lease expiry profile (by area)

     %

     35

     30

     25

     20

     15

     10

     5

               Vacant        2011       2012        2013        2014        2015        2016        2017        2018       2019        2020        2021        2022        2023        2024
5                                                                                        Multiplex NEW ZEALAND Property Fund Year In Review 2011

Investment Portfolio (as at 30 June 2011)
                                                                                                                                             Current
                                                                             Capitalisation               % of          Purchase           valuation
office                                                         Location              rate %          portfolio         price NZ$m              NZ$m
1-11 Short Street*                                            Auckland               10.00                2.0                 9.6                 8.30
8 Hereford Street                                             Auckland                9.50                9.2                55.5                41.90
143 Willis Street                                        Wellington                   9.75                2.9                19.0                13.30
ASB Bank Centre                                               Auckland               8.625               24.6                113.9                112.0
Conservation House                                       Wellington                   8.35                 7.5                37.7               34.30
EDS House                                                Wellington                   9.00                 5.4               26.1                24.40
Gen-i Tower                                                   Auckland                8.50                17.1               63.7                78.00
The AIA Building                                              Auckland                9.25                 5.8               24.6                26.20
The Plaza                                                     Auckland                9.50                 2.3               10.5                10.25
                                                                                                         76.8               360.6               348.65
Industrial
Mangere Distribution Centre                                   Auckland                8.50                15.3               55.5                69.50
                                                                                                          15.3               55.5                69.50
Retail
The Hub                                                 Whakatane                    9.00                  7.9               42.8                36.00
                                                                                                           7.9               42.8                36.00
Total Portfolio                                                                       8.81                100               458.9               454.15
* 1-11 Short Street was sold 19 July 2011.

Value of investment portfolio

    NZ$m                       Number of Assets                                                                                          Asset Number

    1,000                                                                                                                                           50

    900                                                                                                                                             45

    800                                                                                                                                             40

    700                                                                                                                                             35

    600                                                                                                                                             30

    500                                                                                                                                             25

    400                                                                                                                                             20

    300                                                                                                                                             15

    200                                                                                                                                             10

    100                                                                                                                                              5

            Jun 2005                    Jun 2006   Jun 2007               Jun 2008            Jun 2009           Jun 2010            Jun 2011
6

Property
Analysis

Location
The property is located in the suburb of Takapuna,
approximately eight kilometres from the Auckland CBD.
Takapuna is a commercial and retail centre located on
Auckland’s North Shore.

Property description
The property comprises a 17 level office tower completed in
1989, with 13 office floors and four levels of parking providing
190 car spaces. Two of the parking levels also comprise retail
accommodation. The building’s service core is centrally
positioned to the western elevation, providing good natural
light and exceptional views across urban areas to the ocean.

Property details
Property type                                                                        Commercial Office
Building completion date                                                                                         1989
Net lettable area (sqm)                                                                                      9,484
Purchase date                                                                                         May 2005
Purchase price (NZ$m)                                                                                            24.6
Current valuation (NZ$m)                                                                                         26.2
Market capitalisation rate (%)                                                                                   9.25
Current valuation date                                                                             30 June 2011
Valuer                                              Colliers International New Zealand

Tenancy profile
Occupancy (%)                                                                                                    100
Weighted average lease expiry (years)                                                                            1.28
Major tenants                                                                                                     IRD
Net lettable area (%)                                                                                              81

LEASE EXPIRY (by area)

%

100
                                                                                                                        The AIA Building,
80
                                                                                                                        Auckland

60

40

20
               2011
                      2012
                             2013
                                    2014
                                           2015
                                                  2016
                                                         2017
                                                                2018
                                                                       2019
                                                                              2020
                                                                                     2021
                                                                                            2022
                                                                                                   2023
                                                                                                          2024
      Vacant

                                            calendar year end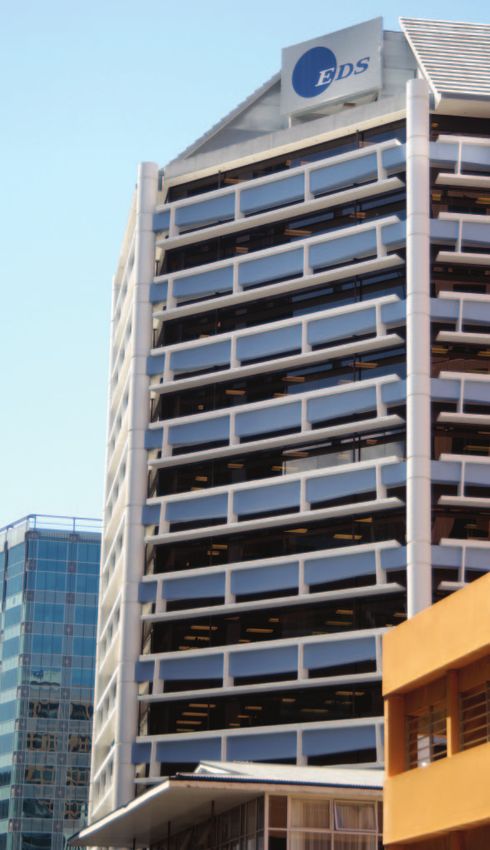
7                                                                                                                           Multiplex NEW ZEALAND Property Fund Year In Review 2011

Location
The landmark ASB Bank Centre occupies a prominent position
in the Auckland CBD. The building is located on the upper end
of Albert Street, and with visual dominance of the city and
harbour, it makes an imposing contribution to Auckland’s
skyline. The site has frontages to Albert, Wellesley and Federal
Streets and is close to key city services.

Property description
ASB Bank Centre is a premium quality landmark property.
The building features four levels of basement parking,
a prestige quality entry foyer and 30 levels of column-free
office accommodation. The building has a central core
allowing for tenant flexibility. Services are premium grade,
including a full back-up emergency generator.

Property details
Property type                                                           Prime Commercial Office
Building completion date                                                                                          1991
Net lettable area (sqm)                                                                                     33,446
Purchase date                                                                           September 2004
Purchase price (NZ$m)                                                                                            113.9
Current valuation (NZ$m)                                                                                         112.0
Market capitalisation rate (%)                                                                                   8.625
Current valuation date                                                                             30 June 2011
Valuer                                              Colliers International New Zealand

Tenancy profile
Occupancy (%)                                                                                                      96
Weighted average lease expiry (years)                                                                             2.18
Major tenants                                                                                                     ASB
Net lettable area (%)                                                                                               61

LEASE EXPIRY (by area)

%                                                                                                                        ASB Bank Centre,
100
                                                                                                                         Auckland
80

60

40

20
               2011
                      2012
                             2013
                                    2014
                                           2015
                                                  2016
                                                         2017
                                                                2018
                                                                       2019
                                                                              2020
                                                                                     2021
                                                                                            2022
                                                                                                   2023
                                                                                                          2024
      Vacant

                                            calendar year end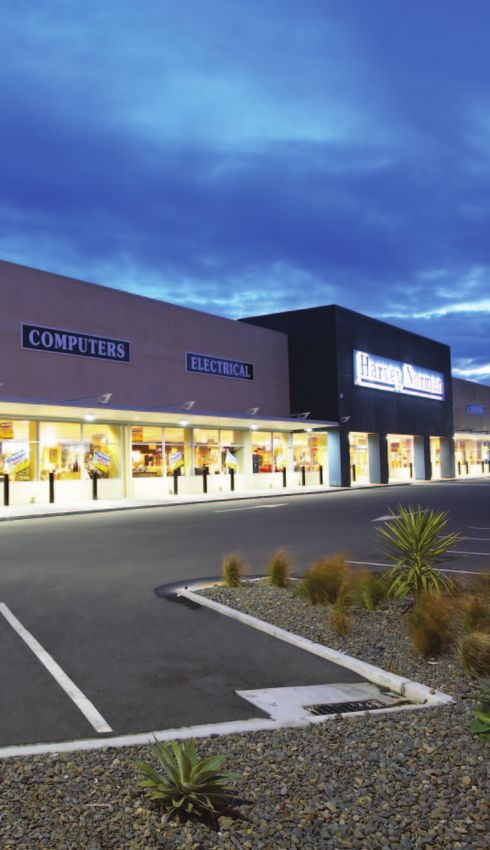
8

Property
Analysis

Location
The property is located in a prominent CBD location close to
the Queen Street retail centre which is widely recognised as
the core of the Auckland CBD. The property is also close to the
Viaduct Harbour precinct and Princess Wharf which provides
entertainment areas, office accommodation, apartment
dwellings and marina.

Property description
Completed in 1990, the building has 19 levels of A grade office
accommodation, ground floor retail and three basement levels
of parking. The building has a large canopy and colonnade area
surrounding the ground floor and water feature on the corner
of Wyndham and Hobson Streets. The upper floors enjoy
excellent views of the harbour.

Property details
Property type                                                      A Grade Commercial Office
Building completion date                                                                                         1990
Net lettable area (sqm)                                                                                      22,614
Purchase date                                                                                         May 2005
Purchase price (NZ$m)                                                                                            63.7
Current valuation (NZ$m)                                                                                         78.0
Market capitalisation rate (%)                                                                                   8.50
Current valuation date                                                                             30 June 2011
Valuer                                              Colliers International New Zealand

Tenancy profile
Occupancy (%)                                                                                                      95
Weighted average lease expiry (years)                                                                            3.27
Major tenants                                                                 Gen-i                 Ministry of
                                                                                                        Justice
Net lettable area (%)                                                                14                            17

                                                                                                                        Gen-i Tower, Auckland
LEASE EXPIRY (by area)

%

100

80

60

40

20
               2011
                      2012
                             2013
                                    2014
                                           2015
                                                  2016
                                                         2017
                                                                2018
                                                                       2019
                                                                              2020
                                                                                     2021
                                                                                            2022
                                                                                                   2023
                                                                                                          2024
      Vacant

                                            calendar year end
9 Multiplex NEW ZEALAND Property Fund Year In Review 2011
Location
The property is situated to the northern side of Karangahape
Road on the southern fringe of the Auckland CBD. The property
has considerable street frontage that enjoys significant
exposure to pedestrian and vehicle traffic.
Property description
The property comprises a historic building completed in the
early 1900s that underwent a major refurbishment in the
1980s. It contains 22 street level retail and restaurant tenancies
and two levels of high specification office space. The building
also provides basement level parking.
Property details
Property type Commercial Office/Retail
Building completion date Early 1900s
Refurbished 1980s
Net lettable area (sqm) 4,693
Purchase date May 2005
Purchase price (NZ$m) 10.5
Current valuation (NZ$m) 10.25
Market capitalisation rate (%) 9.50
Current valuation date 30 June 2011
Valuer Colliers International New Zealand
Tenancy profile
Occupancy (%) 85
Weighted average lease expiry (years) 4.15
Major tenants Fairfax Media
Net lettable area (%) 60
LEASE EXPIRY (by area)
%
100
The Plaza, Auckland
80
60
40
20
2011
2012
2013
2014
2015
2016
2017
2018
2019
2020
2021
2022
2023
2024
Vacant
calendar year end10
Property
Analysis
Location
The property is situated on the eastern side of Hereford Street
and the south side of Hopetown Street approximately one
kilometre from the Auckland CBD. The building has extensive
street frontage and enjoys significant exposure to both
pedestrian and vehicle traffic.
Property description
Completed in 1989, the 15 level office building has
extensive panoramic views. The interior has been
extensively refurbished according to high specifications.
Property details
Property type Commercial Office
Building completion date 1989
Net lettable area (sqm) 15,665
Purchase date May 2005
Purchase price (NZ$m) 55.5
Current valuation (NZ$m) 41.9
Market capitalisation rate (%) 9.50
Current valuation date 30 June 2011
Valuer Colliers International New Zealand
Tenancy profile
Occupancy (%) 72
Weighted average lease expiry (years) 3.17
Major tenants Auckland Council
Net lettable area (%) 72
LEASE EXPIRY (by area)
%
100
8 Hereford Street,
Auckland
80
60
40
20
2011
2012
2013
2014
2015
2016
2017
2018
2019
2020
2021
2022
2023
2024
Vacant
calendar year end11 Multiplex NEW ZEALAND Property Fund Year In Review 2011
Location
The property is situated on the eastern fringe of the
Auckland CBD and northern extent of the main campus of
the University of Auckland. The property has good access to
main arterial roads providing links to the motorway systems
and is close to public transport. It is also well located to
take advantage of the Britomart commercial development
and central transport precinct.
Property description
The property comprises a nine level office tower originally
completed in 1971, with seven office floors and two levels of
parking for 46 cars. The building was refurbished in circa 1995
for educational use. The upper office floors enjoy views over
the Auckland port area.
Property details
Property type Commercial Office
Building completion date 1971
Net lettable area (sqm) 5,088
Purchase date May 2005
Purchase price (NZ$m) 9.6
Current valuation (NZ$m) 8.3
Market capitalisation rate (%) 10.0
Current valuation date 30 June 2011
Valuer Colliers International New Zealand
Tenancy profile
Occupancy (%) 100
Weighted average lease expiry (years) 6.51
Major tenants University of Auckland
Net lettable area (%) 100
LEASE EXPIRY (by area)
% 1-11 Short Street,
100
Auckland
80
60
40
20
2011
2012
2013
2014
2015
2016
2017
2018
2019
2020
2021
2022
2023
2024
Vacant
calendar year end
*Property has been sold since publication of this Annual Report.12
Property
Analysis
Location
The property is situated on the eastern side of Willis Street and
is located in the southern sector of the Wellington CBD.
Property description
The property is a 14 level office building located above a
podium that is Conservation House.
Property details
Property type Commercial Office
Building completion date 1985
Net lettable area (sqm) 7,595
Purchase date June 2007
Purchase price (NZ$m) 19.0
Current valuation (NZ$m) 13.3
Market capitalisation rate (%) 9.75
Current valuation date 30 June 2011
Valuer Colliers International New Zealand
Tenancy profile
Occupancy (%) 100
Weighted average lease expiry (years) 2.57
Major tenants Telecom Medical Council
Net lettable area (%) 72 18
LEASE EXPIRY (by area)
%
100
80
60 143 Willis Street,
Wellington
40
20
2011
2012
2013
2014
2015
2016
2017
2018
2019
2020
2021
2022
2023
2024
Vacant
calendar year end13 Multiplex NEW ZEALAND Property Fund Year In Review 2011
Location
The property is situated on the western side of Manners
Street. The property is located in the southern sector of
the Wellington CBD.
Property description
The building is a 5 Star equivalent Green Building, having
undergone extensive refurbishment in 2007. The property’s
design is focused on environmental sustainability and in 2008
won a NZ Institute of Architecture Supreme Award Citation.
Property details
Property type Commercial Office
Building completion date Refurbished 2007
Net lettable area (sqm) 8,616
Purchase date June 2007
Purchase price (NZ$m) 37.7
Current valuation (NZ$m) 34.3
Market capitalisation rate (%) 8.35
Current valuation date 30 June 2011
Valuer Colliers International New Zealand
Tenancy profile
Occupancy (%) 98
Weighted average lease expiry (years) 6.72
Major tenants Department of Conservation
Net lettable area (%) 87
LEASE EXPIRY (by area)
%
100
80 Conservation House,
60
Wellington
40
20
2011
2012
2013
2014
2015
2016
2017
2018
2019
2020
2021
2022
2023
2024
Vacant
calendar year end14
Property
Analysis
Location
The property is situated on the eastern side of Gilmer Terrace,
Wellington.
Property description
The property comprises 14 office levels and a basement car
park, providing a good standard of accommodation after
being extensively refurbished in 2008.
Property details
Property type Commercial Office
Building completion date 1988
Net lettable area (sqm) 9,940
Purchase date April 2006
Purchase price (NZ$m) 26.1
Current valuation (NZ$m) 24.4
Market capitalisation rate (%) 9
Current valuation date 30 June 2011
Valuer Colliers International New Zealand
Tenancy profile
Occupancy (%) 79
Weighted average lease expiry (years) 3.77
Major tenants EDS
Net lettable area (%) 78
LEASE EXPIRY (by area)
%
100
80
60
EDS House, Wellington
40
20
2011
2012
2013
2014
2015
2016
2017
2018
2019
2020
2021
2022
2023
2024
Vacant
calendar year end15 Multiplex NEW ZEALAND Property Fund Year In Review 2011
Location
The property is located on the northern side of Favona Road,
approximately five minutes travel from Auckland International
Airport. The property will benefit from increased accessibility
to Manukau and Wiri with the proposed extensions and
redirections of State Highway 20. The area immediately
surrounding Favona Road comprises residential development
and established industrial and commercial premises.
Property description
The property comprises a large integrated distribution centre
and head office complex. It includes a new office building,
completed to a high standard and extensive car parking.
The total building area of 65,274 sqm provides a site coverage
of approximately 49%.
Property details
Property type Office/Distribution Centre
Building completion date Refurbished 1995
Net lettable area (sqm) 65,274
Purchase date September 2004
Purchase price (NZ$m) 55.5
Current valuation (NZ$m) 69.5
Market capitalisation rate (%) 8.50
Current valuation date 30 June 2011
Valuer Colliers International New Zealand
Tenancy profile
Occupancy (%) 100
Weighted average lease expiry (years) 13.18
Major tenants General Distributors
Net lettable area (%) 100
LEASE EXPIRY (by area)
% Mangere Distribution
100
Centre, Auckland
80
60
40
20
2011
2012
2013
2014
2015
2016
2017
2018
2019
2020
2021
2022
2023
2024
Vacant
calendar year end16
Property
Analysis
Location
The property is located in the provincial town of Whakatane,
located in the Bay of Plenty District. Whakatane is in the North
Island, approximately 310 kilometres from the Auckland CBD,
85 kilometres from Rotorua and 160 kilometres from Taupo.
Property description
The Hub retail complex is a large Bulky Goods complex that
is anchored by significant tenants such as Bunnings, Farmers,
Harvey Norman, Briscoes and Rebel Sports
Property details
Property type Bulky Goods Retail Centre
Building completion date 2006
Net lettable area (sqm) 26,674
Purchase date September 2006
Purchase price (NZ$m) 42.8
Current valuation (NZ$m) 36
Market capitalisation rate (%) 9
Current valuation date 30 June 2011
Valuer Colliers International New Zealand
Tenancy profile
Occupancy (%) 100
Weighted average lease expiry (years) 6.44
Major tenants Bunnings Farmers
Net lettable area (%) 30 22
LEASE EXPIRY (by area)
%
100
80 The Hub, Whakatane
60
40
20
2011
2012
2013
2014
2015
2016
2017
2018
2019
2020
2021
2022
2023
2024
Vacant
calendar year end Multiplex NEW ZEALAND Property Fund YEAR IN REVIEW 2011
Investor
Relations
Online services Investor services
Accessing investments online is one of the many ways Investors wishing to register a complaint should direct it to:
that Brookfield is ensuring convenience and accessibility
to unitholder investment holdings. Links to the registry The Manager
providers are available via the Brookfield website. Unitholders Brookfield
can access their account balance, transaction history GPO Box 172
and distribution details. Sydney NSW 2001
E-communications Contact us
The default for Brookfield annual and interim reports is now Brookfield has personnel to assist with all investor and
electronic. Online versions of the annual and interim reports financial adviser enquiries.
are available at www.au.brookfield.com.
There are several ways of accessing information about the
Investors who have elected to receive hard copy reports will fund and providing feedback to Customer Service:
continue to receive them. Should you wish to change your
preference, please contact the share registry on 1800 766 011. By post
GPO Box 172
Contact the Registry Sydney NSW 2001
Queries relating to individual unit holdings or requests to
change investment record details such as: By phone
–– change of address (issuer sponsored holdings only) 1800 570 000 (within Australia)
–– update method of payment for receiving distributions +61 2 9322 2000 (outside Australia)
–– tax file number notification
–– annual report election By fax
+61 2 9322 2001
should be addressed to:
By email
Boardroom (Victoria) Pty Ltd clientenquiries@au.brookfield.com
GPO Box 3993
Sydney NSW 2000 By internet
Freecall: 1800 766 011 The Brookfield website provides investors with up-to-date
Email: brookfield@boardroomlimited.com.au information on all funds as well as reports, media releases,
fund performance, unit price information and corporate
governance guidelines.
www.au.brookfield.com
precinct.com.au
This document is printed on Monza Recycled. Monza Recycled is Certified Carbon Neutral by The Carbon Reduction Institute (CRI)
in accordance with the global Greenhouse Gas Protocol and ISO 14040 framework. Monza Recycled contains 55% recycled fibre
(25% post consumer and 30% pre consumer) and 45% elemental chlorine free pulp. All virgin pulp is derived from well-managed
forests and controlled sources. It is manufactured by an ISO 14001 certified mill.Corporate
Directory
Responsible Entity Custodian
Brookfield Capital Management Limited Brookfield Funds Management Limited
Level 22 Level 22
135 King Street 135 King Street
Sydney NSW 2000 Sydney NSW 2000
Telephone: (02) 9322 2000 Telephone: (02) 9322 2000
Facsimile: (02) 9322 2001 Facsimile: (02) 9322 2001
Directors Share Registry
F. Allan McDonald Boardroom
Barbara Ward Boardroom (Victoria) Pty Limited
Brian Motteram GPO Box 3993
Russell Proutt Sydney NSW 2001
Shane Ross Telephone: 1800 766 011
Company Secretary Auditor
Neil Olofsson Deloitte Touche Tohmatsu
The Barrington
Registered Office Level 10
Level 22 10 Smith Street
135 King Street Parramatta NSW 2150
Sydney NSW 2000 Telephone: (02) 9840 7000
Telephone: (02) 9322 2000 Facsimile: (02) 9840 7001
Facsimile: (02) 9322 2001
www.au.brookfield.comYou can also read