Multivariate Statistical Approach to Study Spatiotemporal Variations in Water Quality of aHimalayan Urban Fresh Water Lake - MDPI
←
→
Page content transcription
If your browser does not render page correctly, please read the page content below
water
Article
Multivariate Statistical Approach to Study
Spatiotemporal Variations in Water Quality of
aHimalayan Urban Fresh Water Lake
Tawseef Ahmad 1 , Gaganjot Gupta 1 , Anshula Sharma 1 , Baljinder Kaur 1, *,
Abdulaziz Abdullah Alsahli 2 and Parvaiz Ahmad 2,3, *
 1   Department of Biotechnology, Punjabi University Patiala, Patiala 147002, India;
     tawseef.672@gmail.com (T.A.); gaganbt01@gmail.com (G.G.); anshula2sharma@gmail.com (A.S.)
 2   Botany and Microbiology Department, Faculty of Science, King Saud University, Riyadh 11451, Saudi Arabia;
     aalshenaifi@ksu.edu.sa
 3   Department of Botany, Sri Pratap College, Srinagar 190001, Jammu and Kashmir, India
 *   Correspondence: baljinderkaur@pbi.ac.in (B.K.); parvaizbot@yahoo.com (P.A.)

 Received: 18 July 2020; Accepted: 18 August 2020; Published: 24 August 2020

 Abstract: Physicochemical parameters determining Dal Lake water quality were evaluated at four
 different sites during 2016–2017 in four different seasons Spring (April), Summer (July), Autumn
 (October), and Winter (January). The observed physicochemical values were analyzed by statistical
 (discriminant analysis) and arithmetic (WQI) methods to ascertain sources and levels of pollution.
 Discriminant analysis helped to access the contribution of each physicochemical parameter in
 water quality in the context of sampling sites (spatial) and seasons (temporal) to discriminate
 pollution loading between sites and as well as seasons. Factors such as temperature, alkalinity,
 ammoniacal nitrogen, total phosphorous, and orthophosphorous exhibited a strong contribution in the
 discrimination of sampling sites, while factors such as temperature, alkalinity, hardness, BOD, nitrate
 nitrogen, and total phosphorous exhibited a strong contribution in the discrimination of sampling
 seasons. The WQI values for four sampling sites were calculated and indicated that the water at Site
 I was the most contaminated followed by Site IV, while Site III was the least contaminated. Thus,
 highlighting that the pressure of anthropogenic activities is subjecting Dal Lake to an unnatural death.

 Keywords: physicochemical parameters; Dal Lake; discriminant analysis; water quality index;
 seasons; sites

1. Introduction
     Dal Lake—known as the ‘Jewel of Kashmir’ is one of the most attractive tourist destinations in
the world. The lake is surrounded by mountains on its three sides, Zabarwan in the east, Kohimaraan
in the west, and Shankacharya in the south and is adjoined by beautiful Mughal gardens [1]. It is well
known for its tourism and economic potential, as a multi-basin lake, covering an area of 16.6 km2
and with a water holding capacity of 15.45 × 10⁶ m3 [2]. Dal Lake has evolved as eutrophic in nature
because of the discharge of organic rich effluents, sewage, sediments, and other nutrients from the
surroundings and the floating gardens established within it. Several anthropogenic activities and
ecological stress have forced the lake to shrink like other cases of the world, such as the Aral Sea [3]
and the Dead Sea [4], in terms of its surface area, water quality as well as the nature of biodiversity [5].
The beauty of Dal Lake (Figure S1 in the Supplementary Materials) has been described and appreciated
for centuries. Walter Roper Lawrence, as Resettlement Commissioner of Srinagar in 1887, wrote about
the Dal Lake: “Perhaps in the whole world there is no corner as pleasant as Dal Lake”. Praising the

Water 2020, 12, 2365; doi:10.3390/w12092365                                        www.mdpi.com/journal/water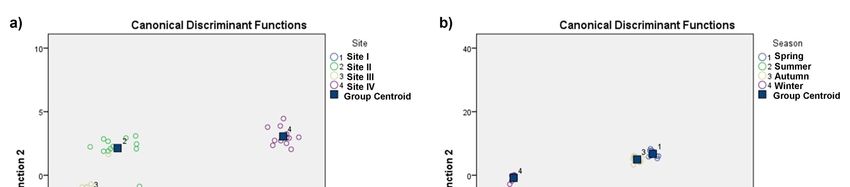
Water 2020, 12, 2365 2 of 15
water of Dal Lake, he mentioned “The water of the Dal is clear and soft as silk, and the people say that
the shawls of Kashmir owe much of their excellence to being washed in the soft waters of the lake” [6].
Lake waters hold a well-defined part of freshwater sources, which are essential for the survival
and well-being of different forms of life in an ecosystem. These serve in multidimensional activities,
such as sources of drinking water, irrigation, fishery, landscape entertainment, trade, and energy
production. However, these functions depend on the water quality, which needs to be kept at a
certain level to maintain a well-balanced environment in terms of its physical, chemical, and biological
variables. Moreover, a few elements are necessary when their concentrations are under sure cutoff
points: trace metals become toxic when they exceed certain concentration limits, organic matter makes
water eutrophic, and excess minerals may make water of awful quality [7]. Lamentably, in the most
recent couple of decades, these characteristic freshwater assets are being contaminated because of
unpredictable human intercession for the sake of advancement and urbanization [8]. The serious issue
in lake wellbeing is the nutrient advancement, which invigorates the development of plants and at last
prompts the decrease in water quality and the whole ecosystem [7]. Globally, the greater part of the
lakes have been overwhelmed by this progression of eutrophication and as an outcome, the attributes
displayed are non-consumable water, reduced fish production, undermined biodiversity, and poor
flood retention limit [9]. Surface water quality in a water body is subjective to both natural and
anthropogenic processes. Dumping of sewage, household squanders, use of fertilizers, and pesticides
and over abuse of lake services and products in and around water bodies engenders stress on these
biological systems, which changes the physical and chemical factors [10]. It has been reported that such
activities have imparted huge pressure on aquatic ecosystems, resulting in a decrease in water quality
and biodiversity, loss of critical habitats, and an overall decrease in quality of life for people living in
the vicinity [11–13]. Hence, periodical monitoring of physicochemical parameters is imperative for the
assessment of water quality.
The lake has tremendous ecological, cultural, and socio-economic importance in the region as it
is a major tourist attraction in the Kashmir valley, which attracts tourists from whole world and is
an important source of vegetables, fisheries, and recreation to the people of Srinagar city. Therefore,
the present study was designed to assess the pollution sources, levels, and causes of spatiotemporal
variations in lake water quality by determination of both similarity and differences in physicochemical
attributes of water during the four seasons at four sites of Dal Lake using a multivariate technique
(discriminant analysis) and arithmetic approach (water quality index).
2. Material and Methods
2.1. Study Area
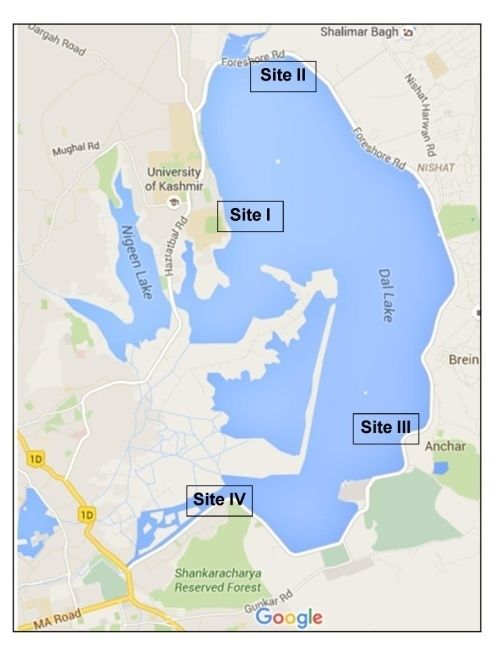
This study was aimed at the assessment of physicochemical parameters of the surface waters of
Dal Lake (Figure 1), which is situated in Srinagar, India, and lies between the geographical coordinates
of 34◦ 50 –34◦ 90 N and 74◦ 490 –74◦ 530 E at an altitude of 1585above sea level. The criteria for selection of
sampling sites were based on the population density and lake catchment areas. Therefore, a total of
four different sites were selected; Site I (Hazratbal Dhobi Ghat), Site II (near Tailbal Nallah), Site III
(near Sher-i-Kashmir International Conference Centre (SKICC)), and Site IV (near the Dal Lock-Gate).
Based on the designed criteria Site I is heavily populated area, Site II is near major inlet, Site III is least
populated, and Site IV is near the outlet and populated as well.Water 2020, 12, 2365 3 of 15
Water 2020, 12, x FOR PEER REVIEW 3 of 15
Figure 1. Map of Dal Lake showing layout of study area(Google maps).
Figure 1. Map of Dal Lake showing layout of study area(Google maps).
2.2. Methodology
2.2. Methodology
Surface water samples were drawn thrice from the selected sites of Dal Lake in each season
Surface
for the water samples
year 2016–2017 and were
were drawn
analyzedthrice
for from thephysicochemical
several selected sites of Dal Lake in each
parameters, which season for
include
the year 2016–2017
temperature, and were
pH, alkalinity, analyzedchlorides,
conductivity, for several physicochemical
total parameters,
hardness, dissolved whichbiological
oxygen (DO), include
oxygen demand (BOD), chemical oxygen demand (COD), nitrate nitrogen, ammoniacal nitrogen,(DO),
temperature, pH, alkalinity, conductivity, chlorides, total hardness, dissolved oxygen total
biological oxygen
phosphorous, and demand (BOD), chemical
orthophosphorous. oxygen
However, demand (COD),
temperature, pH andnitrate nitrogen,for
the samples ammoniacal
dissolved
nitrogen,
oxygen total phosphorous,
estimation were fixed and
at theorthophosphorous.
sampling sites at the However, temperature,
time of sampling. The pH and the
analysis wassamples
performedfor
dissolved oxygen estimation were fixed at the sampling sites at the time of sampling.
as per the standard methods [14–16]. In this spatiotemporal study, four different sampling sites The analysis
was performed
(spatial) and four asseasons
per the(temporal)
standard methods
were taken [14–16]. In this for
into account spatiotemporal
comparative study, four different
assessment of water
sampling sites
quality parameters. (spatial) and four seasons (temporal) were taken into account for comparative
assessment of water quality parameters.
2.3. Statistical Analysis
2.3. Statistical Analysis
Discriminant analysis (DA), a multivariate statistical technique, was used to evaluate obtained
Discriminant
datasets analysis
and illustrate (DA), a multivariate
conclusions regarding the statistical technique,
similarities was used to evaluate
and dissimilarities existing obtained
amongst
datasets and
sampling sitesillustrate conclusions
and monitoring regarding
periods, as well asthetosimilarities and dissimilarities
identify variables existing
specific to spatial amongst
and temporal
sampling sites and monitoring periods,
water quality variations in Dal Lake [17]. as well as to identify variables specific to spatial and temporal
water quality variations in Dal Lake [17].
2.4. Water Quality Index (WQI)
2.4. Water
In thisQuality
study, Index
water(WQI)
quality was estimated using Brown’s Water Quality Equation [18]. The water
quality index
In this (WQI)
study, waterdemonstrates the water
quality was estimated quality
using in terms
Brown’s Water of indexEquation
Quality number[18].
andThe
offers
watera
valuable introduction
quality index of general water
(WQI) demonstrates quality
the water for in
quality open
termsor of
any expected
index number use,
andinoffers
addition to the
a valuable
pollution remediation
introduction programs
of general and in-water
water quality quality
for open or anymanagement [19].inWQI
expected use, was calculated
addition by the
to the pollution
following
remediationequation:
programs and in-water quality management [19]. WQI was calculated by the following
equation: WQI = ΣqnWn/ΣWn (1)
qn=100(Vn − Vi)/(Vs − Vi)
WQI = ΣqnWn/ΣWn (2)
(1)
qn=100(Vn − Vi)/(Vs − Vi) (2)
where, qn = quality rating; Vn = observed value; Vi = ideal value; Vs = standard permissibility limit;Water 2020, 12, 2365 4 of 15
where, qn = quality rating; Vn = observed value; Vi = ideal value; Vs = standard permissibility limit;
Wn = k/Sn (3)
k = [1/(Σ1/Sn = 1,2, . . . n)] (4)
where, Wn = unit weight for nth parameter; Sn = standard permissible value for nth parameter;
k = proportionality constant;
In this study, a total of 8 physicochemical parameters (as given in Table 1) were used as indicators
for calculation of WQI. The suitability of WQI values for human consumption is rated from “excellent
water” to “water unfit for use”. These WQI values are prescribed in such a way that 0–25(Excellent);
26–50(Good); 51–75(Bad); 76–100(Very Bad), and above 100(Unfit). The Equations (2)–(4) were applied
to various indicators and annotated values were further incorporated into Equation (1) to obtain the
results [20].
Table 1. Relative weight of parameters used for WQI calculation.
Parameter BIS/ICMR Standard (Vs) Unit Weight (Wn)
pH 8.5 0.210471
Alkalinity 120 0.014908
Conductivity 300 0.005963
Chlorides 250 0.007156
Hardness 300 0.005963
DO 5 0.3578
BOD 5 0.3578
Nitrate-N 45 0.039756
ΣWn 0.999817
3. Results and Discussion
3.1. Physicochemical Analysis
Evaluation of physicochemical factors is basic to the understanding of the trophic status of the
concerned water body. These deduced characteristics of the lake water analyzed in different seasons at
different sites 2016–2017 are presented as whisker and mean plots with standard deviations in Figure 2.
In present study, most of the physicochemical parameters showed a high standard deviation, which is
an indication of spatiotemporal variations expectedly caused due to anthropogenic activities and
climatic aspects. Water temperature, a characteristic seasonal feature, ranged from a minimum of 3 ◦ C
in winter at Site I to a maximum of 25.5 ◦ C in summer at Site IV. pH recorded during the course of
study was in alkaline range and ranged from 7.0 at Site III during autumn to 8.5 in summer at Site
IV, suggesting the lake as well buffered and productive in nature [21]. Total alkalinity ranged from
110 mg/L at Site III during spring to 190 mg/L at Site IV during winter. The alkaline nature of the
lake may be attributed to photosynthetic activity of primary producers [5,21]. Electrical conductivity
was found to be maximum in autumn at Site IV and minimum during summer at Site II. The higher
conductivity during autumn may be attributed to a higher rate of decomposition and decreasing
water levels in the lake. The low values in summer may be due to higher rates of assimilation by
lake biota [22]. The catchment areas of lake are rich in limestone and dolomites, the wealthy sources
of calcium and magnesium ions [23]. Total hardness was maximum 378.6 mg/L at Site IV during
summer and minimum 60 mg/L at Site III during autumn. Maximum water flow, precipitation of
calcium carbonate, and photosynthetic activity of primary producers may be the other reasons for
higher hardness during summer. Chloride concentration was minimum 18.3 mg/L at Site III during
winter and maximum 43 mg/L at Site IV during summer. Higher chloride values at Sites I and IV
are indicating higher anthropogenic pressures in these areas [24]. DO and water temperature are
negatively related because warm water can hold less DO than cold water as the solubility of oxygenWater 2020, 12, 2365 5 of 15
decreases with increase in temperature [25]. DO was minimum 5.1 mg/L at Site I during summer and
Water 2020, 12, x FOR PEER REVIEW 5 of 15
maximum 8.5 mg/L at Site III during winter. Maximum BOD and COD were recorded at Site I and IV
during autumn
recorded andIminimum
at Site at Site
and IV during II in winter.
autumn Sites I at
and minimum and IVIIhave
Site higher
in winter. BOD
Sites and
I and IVCOD, which is in
have higher
accordance
BOD and withCOD,previous
which studies and is attributed
is in accordance with previousto higher
studiesloads
andof
is agricultural
attributed to runoff
higher and
loadsdomestic
of
agricultural
wastewater [26].runoff andproportions
Higher domestic wastewater [26]. Higher
of ammoniacal proportions
nitrogen, of ammoniacal
nitrate nitrogen, nitrogen,
total phosphorous,
nitrate nitrogen, totalwere
and orthophosphorous phosphorous,
observed and orthophosphorous
during summer and low were observed
during during
winter, summer
which may and low
be attributed
during winter, which may be attributed to the increased pollution
to the increased pollution loads and agricultural runoff during summer [26,27]. loads and agricultural runoff
during summer [26,27].
Figure 2. Cont.Water 2020, 12, 2365 6 of 15
Water 2020, 12, x FOR PEER REVIEW 6 of 15
Figure
Figure 2. 2.Whisker
Whiskerand
and mean
mean plots
plotsshowing
showingspatiotemporal dynamics
spatiotemporal of physicochemical
dynamics parameters.
of physicochemical parameters.
Water quality monitoring and assessment is not only obliging to assess the impact of different
sources of pollution but also to protect aquatic life and to establish efficient management of waterWater 2020, 12, 2365 7 of 15
sources [28]. Temperature, pH, DO, and orthophosphate are among some physicochemical parameters
that need to be monitored continuously for water quality management. The safety ranges of pH,
alkalinity, DO, and ammonia nitrogen leads to health growth and avoids mortalities. Higher values of
alkalinity (>100 mg/L) helps the assimilation of nitrogen by heterotrophic bacteria and nitrification
process by chemoautotrophic bacteria [29]. Higher levels of total nitrogen, ammonia nitrogen, and total
phosphorous are of common concern because of their ability to cause nuisance algal growth [30].
Chlorides are harmful to freshwater vegetation, and its presence in water is responsible for increased
rate of corrosion [31]. The presence of enormous biodegradable organic matter in water leads to
consumption of DO by bacteria and consequently drops the DO levels below the threshold point.
This exhibits negative impact on aquatic life including fish as they are unable to grow and reproduce [32].
DO above 4.0 mg/L is considered good for fish, shrimp, microbiota respiration, and growth. DO
concentrations exhibit an inverse relationship with BOD/COD levels. Low BOD/COD indicate good
water quality, whereas high levels of BOD/COD indicate polluted water and cause harm to aquatic
life [33].
This study was aimed at analysis of physicochemical parameters to evaluate the drift in physical
and chemical properties of lake water in the context of anthropogenic pressure and different climatic
conditions of a year as a function of water quality. However, more advanced techniques, such as
geographic information system (GIS) and remote sensing technology, can be used for real-time
monitoring and assessment of this resource to track the encroachments for settlement and infrastructural
development as the natural population growth increases the amount of land cover by urban and
agricultural development over this time period as well as the groundwater demand due to an increase
in drinking water demand, urban water usage, and irrigation [34–36].
3.2. Discriminant Analysis
Stepwise DA was used to assess the spatial and temporal variations in physicochemical parameters
of Dal Lake waters. On analysis, three discriminant functions (DFs) were found for each sampling
site and season to discriminate between the quality of these sites and seasons. All the functions were
found statistically significant (p < 0.05) by Wilks’ Lambda test.
For spatial variations, the first two DFs accounted for 96.2% total variance between the four
sampling sites, where the first and second DF accounted for 82.5% and 13.7% of total spatial
variance, respectively. The factors temperature, alkalinity, ammoniacal nitrogen, total phosphorous,
and orthophosphorous exhibited a strong contribution in first group (DF1) followed by BOD and
nitrate in second group (DF2) and putative for the majority of expected temporal variations in lake,
while the remaining parameters exhibited a relatively weak contribution in discrimination of four
sampling sites. The relative contribution of each parameter in each DF is given in Table 2. Canonical
discriminant plot for spatial variations (Figure 3a) elucidated that DF1 best discriminates Sites III and
IV than Sites I and II, while the y-axis shows that DF2 best discriminates Sites I from IV than Sites
II and III. Site IV followed by Site I exhibited positive loadings for DF1 factors, which implies that
these sites were characterized by elevated levels of temperature, alkalinity, ammoniacal nitrogen, total
phosphorous, and orthophosphorous, however Sites II and III exhibited a negative association with
these factors. For DF2 factors, Site IV exhibited positive loadings followed by Site II, which implies
that these sites were characterized by elevated levels of BOD and nitrate nitrogen whereas, Sites I and
III exhibited negative association with these factors. The high loading values for these parameters may
be directly attributed to higher anthropogenic pressures and agricultural runoff, sewage, and waste
disposal because of a high human population living in these hamlets (Sites I and IV).
For temporal variations, the first two DFs accounted for 97% total variance between the four
sampling seasons, where the first and second DF accounted for 85.8% and 11.3% of total variance,
respectively. Temperature, alkalinity, hardness, BOD, nitrate nitrogen, and total phosphorous exhibited
a strong contribution in first group (DF1) followed by DO in second group (DF2) and putative for
majority of expected temporal variations in lake, while remaining parameters exhibited a relativelyWater 2020, 12, 2365 8 of 15
weak contribution in discrimination of four sampling seasons. The relative contribution of each
parameter in each DF is given in Table 3. A canonical discriminant plot for temporal variations
(Figure 3b) elucidated that DF1 best discriminated summer and winter than spring and autumn,
which lie close to each other. Summer exhibited positive loadings for DF1 factors, which indicate that
summer was characterized by elevated levels of temperature, alkalinity, hardness, BOD, and nitrate
nitrogen, whereas winter exhibited strong negative association with these factors. For DF2 factors,
spring and autumn exhibited positive loadings with less difference, which implies that these sites
were characterized by elevated levels of DO, whereas summer exhibited a negative association with
DO. These temporal variations may be attributed to increasing volumes of inlet waters from spring to
summer and higher anthropogenic pressures during summer.
Table 2. Summary of canonical discriminant functions for spatial variations in lake water.
Standardized Canonical Discriminant Function Coefficients
Functions
1 2 3
Water Temperature −3.031 1.188 5.123
pH 1.725 2.490 0.832
Alkalinity 2.421 0.947 1.737
Hardness −0.696 0.891 −1.135
Chlorides −1.813 0.241 −0.512
BOD −0.267 −1.107 −0.052
Nitrate −0.977 1.179 −3.231
Ammonia 2.162 −0.046 −0.834
Total Phosphorous 2.478 1.214 −0.196
Orthophosphorous 3.615 −4.431 0.433
Eigenvalues
Eigenvalue 50.181 8.360 2.282
% of Variance 82.5 13.7 3.8
Cumulative% 82.5 96.2 100.0
Canonical Correlation 0.990 0.945 0.834
Wilks’ Lambda
Wilks’ Lambda 0.001 0.033 0.305
Chi-square 294.411 136.997 47.539
Df 30 18 8
Sig. 0.000 0.000 0.000Water 2020, 12, 2365 9 of 15
Water 2020, 12, x FOR PEER REVIEW 9 of 15
FigureFigure
3. Canonical discriminant
3. Canonical plot showing
discriminant (a) spatial
plot showing (a)variation and (b) temporal
spatial variation and (b) variation
temporalof physicochemical
variation parameters parameters
of physicochemical of Dal Lake water.
of Dal Lake water.Water 2020, 12, 2365 10 of 15
Table 3. Summary of canonical discriminant functions for temporal variations in lake water.
Standardized Canonical Discriminant Function Coefficients
Functions
1 2 3
Water Temperature 2.406 0.526 0.544
Alkalinity −2.589 0.537 0.553
Conductivity 0.319 0.844 0.126
Hardness −2.135 −1.385 0.728
DO −0.172 1.374 1.028
BOD 1.643 0.467 0.132
Nitrate 3.164 0.328 0.089
Total Phosphorous −0.916 0.857 −1.077
Eigenvalues
Eigenvalue 391.282 51.633 13.136
% of Variance 85.8 11.3 2.9
Cumulative% 85.8 97.1 100.0
Canonical Correlation 0.999 0.990 0.964
Wilks’ Lambda
Wilks’ Lambda 0.000 0.001 0.071
Chi-square 515.946 271.095 108.598
Df 24 14 6
Sig. 0.000 0.000 0.000
3.3. Water Quality Index
Calculation of WQI by weighted arithmetic index method initiates with the estimation of unit
weight (Wn) for each physicochemical parameter used in the calculation of WQI. Water quality
standards and the assigned unit weights for each physicochemical parameter used for WQI calculation
are given in Table 1. On the basis of Wn, DO and BOD were of highest significance, as these were
assigned a maximum weight of 0.3578 each. WQI was calculated for each season at each site and is
given in Tables 4–7.Water 2020, 12, 2365 11 of 15
Table 4. Calculation of WQI at Site I.
Spring Summer Autumn Winter
Parameter
Vn Qn QnWn Vn Qn QnWn Vn Qn QnWn Vn Qn QnWn
pH 7.77 51.33333 10.80416 7.73 48.66667 10.2429 7.36 24 5.051294 7.23 15.33333 3.227216
Alkalinity 122.3 101.9167 1.519408 132 110 1.639917 130.3 108.5833 1.618797 151.67 126.3917 1.884289
Conductivity 204 27.2 0.064881 176.3 58.76667 0.350445 284.3 94.76667 0.565125 238.67 79.55667 0.474423
Chlorides 30.7 12.28 0.087876 36.7 14.68 0.10505 31 12.4 0.088734 22.67 9.068 0.064891
Hardness 130.7 43.56667 0.259803 326.6 108.8667 0.649208 86.3 28.76667 0.171545 201 67 0.399543
DO 8.6 62.5 22.3625 5.13 98.64583 35.29548 5.96 90 32.202 8.13 67.39583 24.11423
BOD 12.5 250 89.45 21.5 430 153.854 24.3 486 173.8908 10.16 203.2 72.70496
Nitrate-N 1.38 3.066667 0.121917 1.43 3.177778 0.126334 1.23 2.733333 0.108665 0.919 2.042222 0.08119
ΣWnQn 124.6705 ΣWnQn 202.2633 ΣWnQn 213.697 ΣWnQn 102.9507
WQI 125.1412 WQI 202.3003 WQI 213.736 WQI 102.9696
Average WQI = 161
Table 5. Calculation of WQI at Site II.
Spring Summer Autumn Winter
Parameter
Vn Qn QnWn Vn Qn QnWn Vn Qn QnWn Vn Qn QnWn
pH 7.57 38 7.997882 7.63 42 8.839765 7.2 13.33333 2.806275 7.43 28.66667 6.03349
Alkalinity 130.3 108.5833 1.618797 125.67 104.725 1.561275 141.67 118.0583 1.760053 120.3 100.25 1.49456
Conductivity 264.3 35.24 0.084059 140.3 46.76667 0.278885 289.67 96.55667 0.5758 281.3 93.76667 0.559162
Chlorides 28.3 11.32 0.081006 31 12.4 0.088734 29 11.6 0.08301 20 8 0.057248
Hardness 143.3 47.76667 0.284849 255 85 0.506883 63 21 0.12523 162.3 54.1 0.322616
DO 8.07 68.02083 24.33785 11 37.5 13.4175 6.6 83.33333 29.81667 8.27 65.9375 23.59244
BOD 8 160 57.248 21.6 432 154.5696 14.5 290 103.762 6.5 130 46.514
Nitrate-N 1.57 3.488889 0.138703 1.63 3.622222 0.144003 1.43 3.177778 0.126334 0.737 1.637778 0.065111
ΣWnQn 91.79115 ΣWnQn 179.4066 ΣWnQn 139.0554 ΣWnQn 78.63863
WQI 92.13767 WQI 179.4395 WQI 139.0808 WQI 78.65301
Average WQI =122Water 2020, 12, 2365 12 of 15
Table 6. Calculation of WQI at Site III.
Spring Summer Autumn Winter
Parameter
Vn Qn QnWn Vn Qn QnWn Vn Qn QnWn Vn Qn QnWn
pH 7.83 55.33333 11.64604 8.07 71.33333 15.01357 7.06 4 0.841882 7.03 2 0.420941
Alkalinity 110 91.66667 1.366597 101.3 84.41667 1.258512 125 104.1667 1.552951 161.3 134.4167 2.003928
Conductivity 236 31.46667 0.075058 166.3 55.43333 0.330567 297.67 99.22333 0.591702 248.3 82.76667 0.493565
Chlorides 23.67 9.468 0.067753 28.3 11.32 0.081006 24.67 9.868 0.070615 18.3 7.32 0.052382
Hardness 119.67 39.89 0.237877 239.67 79.89 0.476411 60.66 20.22 0.120579 119.3 39.76667 0.237142
DO 8.5 63.54167 22.73521 5.4 95.83333 34.28917 6.4 85.41667 30.56208 8 68.75 24.59875
BOD 8 160 57.248 11.27 225.4 80.64812 13.3 266 95.1748 7.6 152 54.3856
Nitrate-N 1.318 2.928889 0.11644 1.35 3 0.119267 1.27 2.822222 0.112199 0.79 1.755556 0.069793
ΣWnQn 93.49297 ΣWnQn 132.2166 ΣWnQn 129.0268 ΣWnQn 82.2621
WQI 93.84591 WQI 132.2408 WQI 129.0504 WQI 82.27715
Average WQI =109
Table 7. Calculation of WQI at Site IV.
Spring Summer Autumn Winter
Parameter
Vn Qn QnWn Vn Qn QnWn Vn Qn QnWn Vn Qn QnWn
pH 8.1 73.33333 15.43451 8.53 102 21.468 7.47 31.33333 6.594745 7.47 31.33333 6.594745
Alkalinity 140.3 116.9167 1.743033 130.3 108.5833 1.618797 169 140.8333 2.09959 190.67 158.8917 2.36881
Conductivity 221.67 29.556 0.070501 121.3 40.43333 0.241117 318 106 0.632113 233.3 77.76667 0.463749
Chlorides 27.3 10.92 0.078144 43 17.2 0.123083 35.3 14.12 0.101043 28.3 11.32 0.081006
Hardness 167.83 55.94333 0.333609 378.67 126.2233 0.752712 80.3 26.76667 0.159619 191.3 63.76667 0.380262
DO 7.77 71.14583 25.45598 5.6 93.75 33.54375 5.47 95.10417 34.02827 7.53 73.64583 26.35048
BOD 13 260 93.028 14 280 100.184 18.5 370 132.386 13 260 93.028
Nitrate-N 1.54 3.422222 0.136052 1.62 3.6 0.14312 1.35 3 0.119267 0.97 2.155556 0.085695
ΣWnQn 136.2798 ΣWnQn 158.0746 ΣWnQn 176.1206 ΣWnQn 129.3527
WQI 136.7943 WQI 158.1035 WQI 176.1529 WQI 129.3764
Average WQI =150Water 2020, 12, 2365 13 of 15
The WQI values elucidated that the water of Dal Lake is excessively polluted and unfit for
human consumption. The average WQI for Site I, Site II, Site III, and Site IV are 161, 122, 109,
and 150 respectively, demonstrating that the maximum deteriorated water quality was observed at
Site I—a highly populated area—and least at Site III—the least populated area—thus suggesting that
anthropogenic pressures are the main reason behind the deterioration of water quality of Dal Lake.
Spatiotemporally, Site I was observed as the most contaminated during autumn followed by summer.
4. Conclusions
The main focus of this study was to evaluate spatiotemporal variations in the surface water quality
of Dal Lake using statistical and arithmetic exploratory techniques to ascertain pollution sources.
The results of these methods exhibited that the variation in water quality of the lake is more subjected
to anthropogenic pressures than change in the climatic conditions. The discriminant analysis separated
sampling sites and seasons in a simpler, illustrative manner and highlighted the contribution of each
physicochemical parameter. The water quality index is helpful in assessment and management of water
quality. Based on obtained WQI values, this study provides necessary understanding into the status of
overall suitability of the Dal Lake water. The WQI helped in the transformation of complex datasets into
a numeric expression and presented the status of water quality as a single number, which elucidates
that indiscriminate anthropogenic pressures by (population loads) are pushing the lake ecosystem
towards an unnatural death. Thus, as a result of this study, it can be concluded that the lake is moving
towards its definite end. For restoration of this aesthetic asset and biologically diverse natural habitat,
effective treatment measures are urgently required; encroachments for settlement and infrastructural
development must be banned and existing ones should be removed, in addition to regulation of sewage
and waste disposal into the lake to conserve this ecosystem of high socio-economic importance.
The overall water quality was evaluated using WQI, which has some limitations, so it may not
convey enough information about the actual situation of the Lake, but in the future, this study can be
used as a case study to strengthen the research findings related to Dal Lake water quality management.
Our results can be helpful to decision makers to elucidate priorities in pollution prevention efforts
and management of the lake. Besides this, geographic information system (GIS) and remote sensing
technology can be further employed for real-time monitoring and assessment of this resource as
urbanization is forcing the lake to shrink.
Supplementary Materials: The following are available online at http://www.mdpi.com/2073-4441/12/9/2365/s1,
Figure S1: Dal Lake.
Author Contributions: Conceptualization, T.A., G.G., B.K. and P.A.; methodology, T.A., G.G. and A.S.; software,
A.A.A.; validation, G.G., A.S. and B.K.; formal analysis, P.A.; investigation, T.A.; resources, B.K.; data curation,
B.K. and P.A.; writing—original draft preparation, T.A., G.G., A.S. and B.K.; writing—review and editing, B.K.,
A.A.A. and P.A.; visualization, G.G.; supervision, B.K.; project administration, B.K.; funding acquisition, A.A.A.
and P.A. All authors have read and agreed to the published version of the manuscript.
Acknowledgments: The authors would like to extend their sincere appreciation to the Researchers Supporting
Project Number (RSP-2020/236), King Saud University, Riyadh, Saudi Arabia.
Conflicts of Interest: The authors declare no conflict of interest.
References
1. Zutshi, D.; Vass, K. Limnological Studies on Dal Lake, Srinagar. III. Biological Features. Proc. Indian Natl. Sci.
Sect. B 1982, 48, 234–241.
2. Ul Solim, S.; Wanganeo, A. Excessive phosphorus loading to Dal Lake, India: Implications for managing
shallow eutrophic lakes in urbanized watersheds. Int. Rev. Hydrobiol. 2008, 93, 148–166. [CrossRef]
3. Micklin, P. The Aral sea disaster. Annu. Rev. Earth Planet. Sci. 2007, 35, 47–72. [CrossRef]
4. Hussein, H. Politics of the Dead Sea Canal: A historical review of the evolving discourses, interests, and plans.
Water Int. 2017, 42, 527–542. [CrossRef]Water 2020, 12, 2365 14 of 15
5. Qadri, H.; Yousuf, A. Dal Lake ecosystem: Conservation strategies and problems. In Proceedings of the
TAAL 2007: The 12th World Lake Conference, Jaipur, India, 28 October–2 November 2007; pp. 1453–1457.
6. Lawrence, W.R. The Valley of Kashmir; H. Frowde: London, UK, 1895.
7. Yu, F.C.; Fang, G.H.; Ru, X.W. Eutrophication, health risk assessment and spatial analysis of water quality in
Gucheng Lake, China. Environ. Earth Sci. 2010, 59, 1741–1748. [CrossRef]
8. Bora, M.; Goswami, D.C. Water quality assessment in terms of water quality index (WQI): Case study of the
Kolong River, Assam, India. Appl. Water Sci. 2016, 7, 3125–3135. [CrossRef]
9. Fink, G.; Alcamo, J.; Flörke, M.; Reder, K. Phosphorus loadings to the world’s largest lakes: Sources and
trends. Glob. Biogeochem. Cycles 2018, 32, 617–634. [CrossRef]
10. Zhao, Y.; Xia, X.H.; Yang, Z.F.; Wang, F. Assessment of water quality in Baiyangdian Lake using multivariate
statistical techniques. Procedia Environ. Sci. 2012, 13, 1213–1226. [CrossRef]
11. Niemi, G.J.; DeVore, P.; Detenbeck, N.; Taylor, D.; Lima, A.; Pastor, J.; Yount, J.D.; Naiman, R.J. Overview of
case studies on recovery of aquatic systems from disturbance. Environ. Manag. 1990, 14, 571–587. [CrossRef]
12. Kazi, T.; Arain, M.; Jamali, M.K.; Jalbani, N.; Afridi, H.; Sarfraz, R.; Baig, J.; Shah, A.Q. Assessment of water
quality of polluted lake using multivariate statistical techniques: A case study. Ecotoxicol. Environ. Saf. 2009,
72, 301–309. [CrossRef]
13. Herrera-Silveira, J.A.; Morales-Ojeda, S.M. Evaluation of the health status of a coastal ecosystem in southeast
Mexico: Assessment of water quality, phytoplankton and submerged aquatic vegetation. Mar. Pollut. Bull.
2009, 59, 72–86. [CrossRef] [PubMed]
14. Eaton, A.D.; Clesceri, L.S.; Rice, E.W.; Greenberg, A.E.; Franson, M. Standard Methods for the Examination of
Water and Wastewater, 21st ed.; American Public Health Association, American Waterworks Association,
Water Environmental Federation: Washington, DC, USA, 2005; pp. 1–88.
15. Trivedy, R.; Goel, P. Chemical and Biological Methods for Water Pollution Studies; Environmental Publications:
Portland, OR, USA, 1984.
16. US-EPA. Methods for Chemical Analysis of Water and Wastes; Environmental Protection Agency: Washington,
DC, USA, 1991.
17. Singh, K.P.; Malik, A.; Mohan, D.; Sinha, S. Multivariate statistical techniques for the evaluation of spatial and
temporal variations in water quality of Gomti River (India)—A case study. Water Res. 2004, 38, 3980–3992.
[CrossRef] [PubMed]
18. Brown, R.M.; McClelland, N.I.; Deininger, R.; Tozer, R.G. A water quality index-do we dare? water sewage
works. Ojahio Mcred 1970, 117, 339–343.
19. Bhat, S.A.; Pandit, A.K. Surface Water Quality Assessment of Wular Lake, A Ramsar Site in Kashmir
Himalaya, Using Discriminant Analysis and WQI. J. Ecosyst. 2014, 2014, 1–18. [CrossRef]
20. Brown, R.M.; McClelland, N.I.; Deininger, R.A.; O’Connor, M.F. A Water Quality Index—Crashing the
Psychological Barrier. In Indicators of Environmental Quality; Springer: New York, NY, USA, 1972; pp. 173–182.
[CrossRef]
21. Garg, R.; Rao, R.; Uchchariya, D.; Shukla, G.; Saksena, D. Seasonal variations in water quality and major
threats to Ramsagar reservoir, India. Afr. J. Environ. Sci. Technol. 2010, 4, 61–76.
22. Lu, Q.; He, Z.L.; Graetz, D.A.; Stoffella, P.J.; Yang, X. Phytoremediation to remove nutrients and improve
eutrophic stormwaters using water lettuce (Pistia stratiotes L.). Environ. Sci. Pollut. Res. 2010, 17, 84–96.
[CrossRef]
23. Jeelani, G.; Shah, A.Q. Geochemical characteristics of water and sediment from the Dal Lake, Kashmir
Himalaya: Constraints on weathering and anthropogenic activity. Environ. Geol. 2006, 50, 12–23. [CrossRef]
24. Rashid, I.; Romshoo, S.A.; Amin, M.; Khanday, S.A.; Chauhan, P. Linking human-biophysical interactions
with the trophic status of Dal Lake, Kashmir Himalaya, India. Limnologica 2017, 62, 84–96. [CrossRef]
25. Solanki, V.R.; Hussain, M.M.; Raja, S.S. Water quality assessment of Lake Pandu Bodhan, Andhra Pradesh
State, India. Environ. Monit. Assess. 2010, 163, 411–419. [CrossRef]
26. Najar, I.A.; Khan, A.B. Assessment of seasonal variation in water quality of Dal Lake (Kashmir, India) using
multivariate statistical techniques. In Proceedings of the Water Pollution XI, Southampton, UK, 10 July 2012.
27. Khan, M.Y.A.; Hu, H.; Tian, F.; Wen, J. Monitoring the spatio-temporal impact of small tributaries on the
hydrochemical characteristics of Ramganga River, Ganges Basin, India. Int. J. River Basin Manag. 2020, 18,
231–241. [CrossRef]Water 2020, 12, 2365 15 of 15
28. Varol, M.; Gökot, B.; Bekleyen, A.; Şen, B. Spatial and temporal variations in surface water quality of the dam
reservoirs in the Tigris River basin, Turkey. Catena 2012, 92, 11–21. [CrossRef]
29. Emerenciano, M.G.C.; Martínez-Córdova, L.R.; Martínez-Porchas, M.; Miranda-Baeza, A. Biofloc technology
(BFT): A tool for water quality management in aquaculture. In Water Quality; Tutu, H., Ed.; IntechOpen:
Rijeka, Croatia, 2017; pp. 92–109.
30. Sharip, Z.; Suratman, S. Formulating specific water quality criteria for lakes: A Malaysian perspective.
In Water Quality; Tutu, H., Ed.; IntechOpen: Rijeka, Croatia, 2017; pp. 293–313.
31. Ruman, M.; Polkowska, Ż.; Zygmunt, B. Processes and the Resulting Water Quality in the Medium-Size
Turawa Storage Reservoir after 60-Year Usage. In Water Quality; Tutu, H., Ed.; IntechOpen: Rijeka, Croatia,
2017; pp. 377–400.
32. Igbinosa, E.; Okoh, A. Impact of discharge wastewater effluents on the physico-chemical qualities of a
receiving watershed in a typical rural community. Int. J. Environ. Sci. Technol. 2009, 6, 175–182. [CrossRef]
33. Edokpayi, J.N.; Odiyo, J.O.; Durowoju, O.S. Impact of wastewater on surface water quality in developing
countries: A case study of South Africa. In Water Quality; Tutu, H., Ed.; IntechOpen: Rijeka, Croatia, 2017;
pp. 401–416.
34. Mohammad, A.H.; Jung, H.C.; Odeh, T.; Bhuiyan, C.; Hussein, H. Understanding the impact of droughts in
the Yarmouk Basin, Jordan: Monitoring droughts through meteorological and hydrological drought indices.
Arab. J. Geosci. 2018, 11, 103. [CrossRef]
35. Odeh, T.; Mohammad, A.H.; Hussein, H.; Ismail, M.; Almomani, T. Over-pumping of groundwater in Irbid
governorate, northern Jordan: A conceptual model to analyze the effects of urbanization and agricultural
activities on groundwater levels and salinity. Environ. Earth Sci. 2019, 78, 40. [CrossRef]
36. Riad, P.; Graefe, S.; Hussein, H.; Buerkert, A. Landscape transformation processes in two large and two small
cities in Egypt and Jordan over the last five decades using remote sensing data. Landsc. Urban.Plan. 2020,
197, 103766. [CrossRef]
© 2020 by the authors. Licensee MDPI, Basel, Switzerland. This article is an open access
article distributed under the terms and conditions of the Creative Commons Attribution
(CC BY) license (http://creativecommons.org/licenses/by/4.0/).You can also read