MYC regulates ribosome biogenesis and mitochondrial gene expression programs through its interaction with host cell factor-1
←
→
Page content transcription
If your browser does not render page correctly, please read the page content below
RESEARCH ARTICLE

                                   MYC regulates ribosome biogenesis and
                                   mitochondrial gene expression programs
                                   through its interaction with host cell
                                   factor–1
                                   Tessa M Popay1, Jing Wang2,3, Clare M Adams4, Gregory Caleb Howard1,
                                   Simona G Codreanu5,6, Stacy D Sherrod5,6, John A McLean5,6, Lance R Thomas1†,
                                   Shelly L Lorey1, Yuichi J Machida7, April M Weissmiller1‡, Christine M Eischen4,
                                   Qi Liu2,3, William P Tansey1,8*
                                   1
                                     Department of Cell and Developmental Biology, Vanderbilt University School of
                                   Medicine, Nashville, United States; 2Department of Biostatistics, Vanderbilt
                                   University Medical Center, Nashville, United States; 3Center for Quantitative
                                   Sciences, Vanderbilt University Medical Center, Nashville, United States;
                                   4
                                     Department of Cancer Biology, Thomas Jefferson University, Philadelphia, United
                                   States; 5Center for Innovative Technology (CIT), Vanderbilt University, Nashville,
                                   United States; 6Department of Chemistry, Vanderbilt University, Nashville, United
                                   States; 7Department of Oncology, Mayo Clinic, Rochester, United States;
                                   8
                                     Department of Biochemistry, Vanderbilt University School of Medicine, Nashville,
                                   United States
*For correspondence:
william.p.tansey@vanderbilt.edu

Present address: †Oncocyte         Abstract The oncoprotein transcription factor MYC is a major driver of malignancy and a highly
Corporation, Nashville, United     validated but challenging target for the development of anticancer therapies. Novel strategies to
States; ‡Department of Biology,    inhibit MYC may come from understanding the co-factors it uses to drive pro-tumorigenic gene
Middle Tennessee State             expression programs, providing their role in MYC activity is understood. Here we interrogate how
University, Murfreesboro, United   one MYC co-factor, host cell factor (HCF)–1, contributes to MYC activity in a human Burkitt
States
                                   lymphoma setting. We identify genes connected to mitochondrial function and ribosome
Competing interests: The           biogenesis as direct MYC/HCF-1 targets and demonstrate how modulation of the MYC–HCF-1
authors declare that no            interaction influences cell growth, metabolite profiles, global gene expression patterns, and tumor
competing interests exist.         growth in vivo. This work defines HCF-1 as a critical MYC co-factor, places the MYC–HCF-1
Funding: See page 33               interaction in biological context, and highlights HCF-1 as a focal point for development of novel
                                   anti-MYC therapies.
Received: 19 June 2020
Accepted: 05 December 2020
Published: 08 January 2021

Reviewing editor: Maureen E
Murphy, The Wistar Institute,
                                   Introduction
United States                      MYC oncogenes (c-, L-, and N-) encode a family of related transcription factors that are overex-
                                   pressed in a majority of cancers and responsible for ~100,000 cancer-related deaths in the United
   Copyright Popay et al. This
                                   States each year (Schaub et al., 2018). Capable of acting as both transcriptional activators and
article is distributed under the
                                   repressors, MYC proteins (hereafter ’MYC’) dimerize with their obligate partner MAX
terms of the Creative Commons
Attribution License, which         (Blackwood and Eisenman, 1991) to bind and regulate the expression of thousands of genes con-
permits unrestricted use and       nected to the cell cycle, protein synthesis, metabolism, genome stability, apoptosis, and angiogene-
redistribution provided that the   sis (Tansey, 2014). Fueled by reports that experimental inactivation of MYC promotes tumor
original author and source are     regression in mice (Alimova et al., 2019; Beaulieu et al., 2019; Giuriato et al., 2006; Jain, 2002;
credited.                          Soucek et al., 2013), there is considerable interest in the idea that MYC inhibitors could form the

Popay et al. eLife 2021;10:e60191. DOI: https://doi.org/10.7554/eLife.60191                                                      1 of 39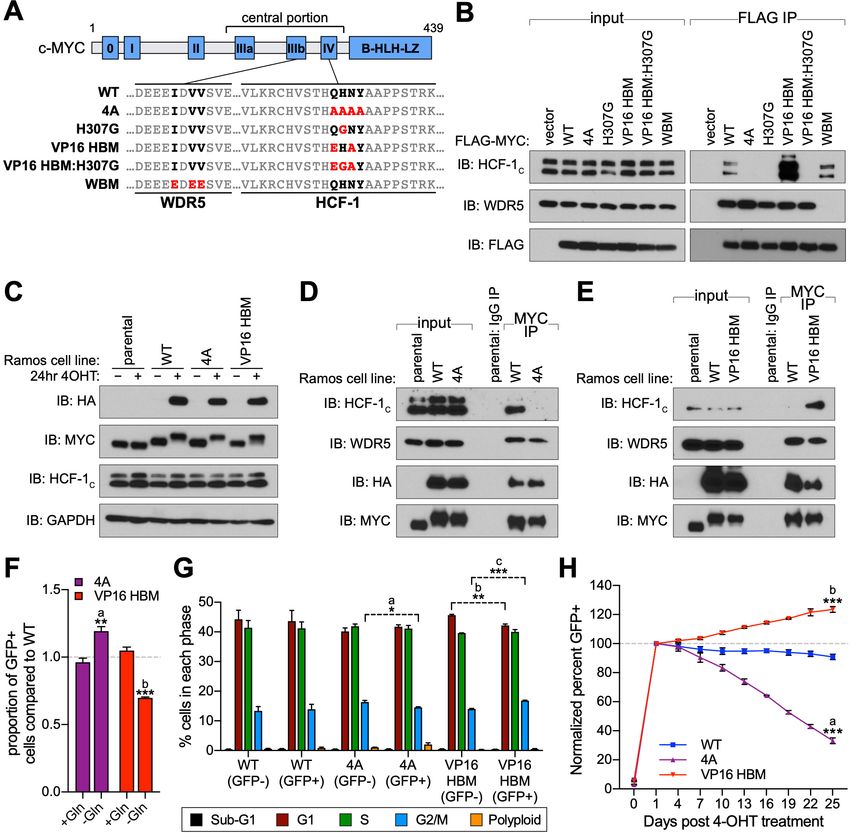
Research article                                                                                                 Cancer Biology

                                   eLife digest Tumours form when cells lose control of their growth. Usually, cells produce signals
                                   that control how much and how often they divide. But if these signals become faulty, cells may grow
                                   too quickly or multiply too often. For example, a group of proteins known as MYC proteins activate
                                   growth genes in a cell, but too much of these proteins causes cells to grow uncontrollably.
                                      With one third of all cancer deaths linked to excess MYC proteins, these molecules could be key
                                   targets for anti-cancer drugs. However, current treatments fail to target these proteins. One option
                                   for treating cancers linked to MYC proteins could be to target proteins that work alongside MYC
                                   proteins, such as the protein HCF-1, which can attach to MYC proteins.
                                      To test if HCF-1 could be a potential drug target, Popay et al. first studied how HCF-1 and MYC
                                   proteins interacted using specific cancer cells grown in the laboratory. This revealed that when the
                                   two proteins connected, they activated genes that trigger rapid cell growth. When these cancer cells
                                   were then injected into mice, tumours quickly grew. However, when the MYC and HCF-1
                                   attachments in the cancer cells were disrupted, the tumours shrunk. This suggests that if anti-cancer
                                   drugs were able to target HCF-1 proteins, they could potentially reduce or even reverse the growth
                                   of tumours.
                                      While further research is needed to identify drug candidates, these findings reveal a promising
                                   target for treating tumours that stem from over-abundant MYC proteins.

                                   basis of broadly effective anticancer therapies. MYC itself, however, is widely viewed as undruggable
                                   (Dang et al., 2017), meaning that effective strategies to pharmacologically inhibit MYC will most
                                   likely come from targeting the co-factors with which it interacts to drive and sustain the malignant
                                   state (Brockmann et al., 2013; Bryan et al., 2020).
                                       The interactome of MYC has been extensively interrogated (reviewed by Baluapuri et al., 2020).
                                   One effective strategy for prioritizing which of these interaction partners to study has been to focus
                                   on those that interact with conserved segments of the MYC protein, which are referred to as ‘MYC
                                   boxes’ (Mb) (Meyer and Penn, 2008). In addition to the highly conserved basic helix-loop-helix
                                   domain that interacts with MAX, six evolutionarily conserved MYC boxes have been described
                                   (Baluapuri et al., 2020). On average, MYC boxes are around 15 amino acid residues in length, and
                                   although it is clear that they each mediate multiple protein–protein interactions (Kalkat et al.,
                                   2018), a number of predominant interactors have been described for most of these segments: Mb0,
                                   for example, interacts with the general transcription factor TFIIF to stimulate transcription
                                   (Kalkat et al., 2018), MbI interacts with the ubiquitin ligase SCFFBW7 to control MYC protein stability
                                   (Welcker et al., 2004), MbII interacts with the STAGA component TRRAP (McMahon et al., 1998)
                                   to regulate histone acetylation (Kalkat et al., 2018), and MbIIIb interacts with the chromatin-associ-
                                   ated protein WDR5 (Thomas et al., 2015) to facilitate its recruitment to ribosomal protein genes
                                   (Thomas et al., 2019). The two remaining MYC boxes are less well understood, but MbIIIa is impor-
                                   tant for tumorigenesis (Herbst et al., 2005) and recruitment of HDAC3 to chromatin (Kurland and
                                   Tansey, 2008), and MbIV interacts with the ubiquitous chromatin-associated protein host cell factor
                                   (HCF)–1 (Thomas et al., 2016).
                                       HCF-1 is an essential nuclear protein (Goto et al., 1997) that is synthesized as a 2035 amino acid
                                   precursor and proteolytically cleaved by O-GlcNAc transferase (OGT) (Capotosti et al., 2011) into a
                                   collection of amino- (HCF-1N) and carboxy- (HCF-1C) terminal fragments that remain associated.
                                   HCF-1 was first identified through its ability to assemble into a multiprotein–DNA complex with the
                                   herpes simplex virus transactivator VP16, but was later shown to function in uninfected cells as a co-
                                   factor for cellular transcription factors, and as part of the Sin3 and MLL/SET histone modifying com-
                                   plexes (Wysocka and Herr, 2003). The interaction of HCF-1 with VP16 is likely direct and is medi-
                                   ated by a tetrapeptide ‘EHAY’ motif in VP16 that binds to a region within the HCF-1N fragment
                                   known as the VP16-induced complex (VIC) domain (Freiman and Herr, 1997). This four residue
                                   HCF-1-binding motif (HBM)—consensus (D/E)-H-x-Y—is present in other viral and cellular transcrip-
                                   tion factors that interact directly with the HCF-1 VIC domain, including key cell cycle regulators such
                                   as the E2F family of proteins (Tyagi et al., 2007).

Popay et al. eLife 2021;10:e60191. DOI: https://doi.org/10.7554/eLife.60191                                                        2 of 39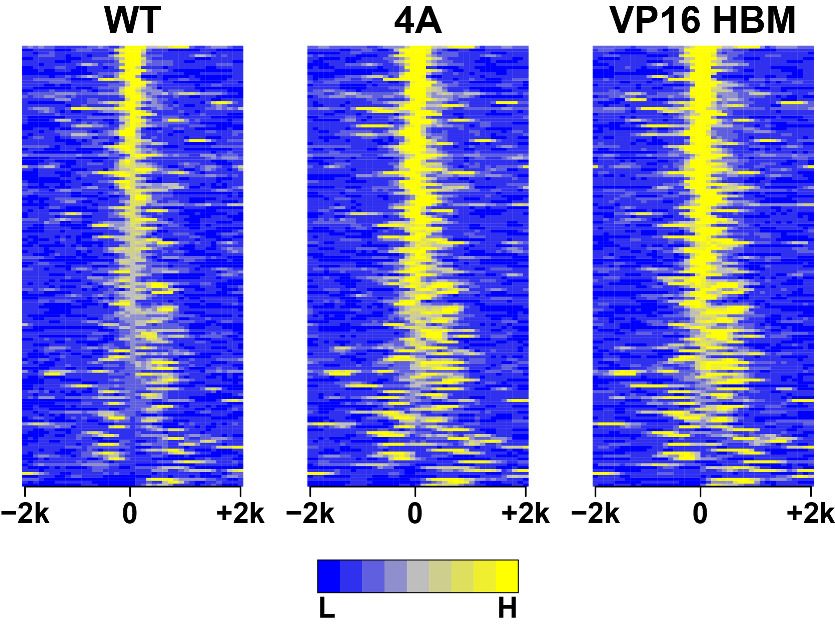
Research article Cancer Biology
We identified HCF-1 as a MYC-associated protein through proteomic approaches, and demon-
strated that the interaction occurs through the VIC domain of HCF-1 and an atypical HBM within
MbIV that carries the sequence ’QHNY’ (Thomas et al., 2016). Mutation of these four HBM residues
to alanine disrupts the interaction of MYC with HCF-1 in vitro and reduces the ability of MYC to pro-
mote murine fibroblast tumor growth in nude mice (Thomas et al., 2016).
The small and well-defined interaction point between MYC and HCF-1, and the importance of
this interaction to tumorigenesis, raise the possibility that the MYC–HCF-1 nexus could be a viable
venue for discovery of novel anti-MYC therapies. If that venue is to be pursued, however, we need
to place this interaction in biological context, identify the gene networks that are under its control,
and determine whether the MYC–HCF-1 interaction is required for tumor initiation, maintenance, or
both. Here we use a combination of loss- and gain-of function approaches to interrogate the role of
the MYC–HCF-1 interaction in the context of a canonically MYC-driven cancer—Burkitt lymphoma.
We demonstrate that the interaction between MYC and HCF-1 is directly involved in controlling the
expression of genes linked to ribosome biogenesis, translation, and mitochondrial function. We
define the impact of modulation of this interaction on cell growth, metabolism, and global gene
expression patterns. And we show that disrupting the MYC–HCF-1 interaction promotes rapid and
persistent tumor regression in vivo. This work reveals how MYC executes a core arm of its pro-
tumorigenic gene expression changes, defines HCF-1 as a tumor-critical MYC co-factor, and pro-
vides proof-of-concept for a new way to inhibit MYC in the clinic.
Results
Bidirectional modulation of the MYC HCF-1 interaction
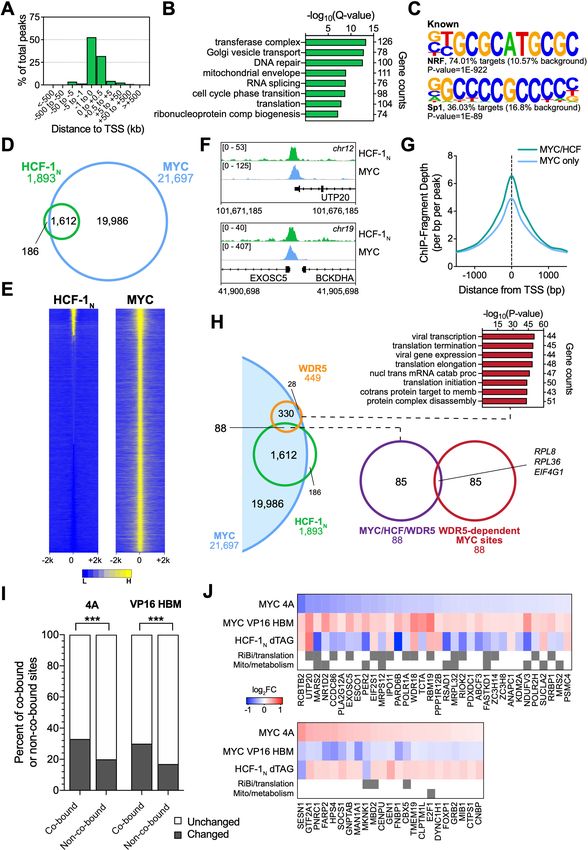
To understand the role of HCF-1 in MYC function, we sought to use separation-of-function mutations
in MYC that modulate interaction with HCF-1 in a predictable way. We therefore introduced a num-
ber of mutations in the atypical HBM of MYC (QHNY) that we expected to decrease—or increase—
interaction with HCF-1, based on properties of prototypical HBM sequences (Freiman and Herr,
1997; Figure 1A). We substituted the MYC HBM for the canonical HBM from VP16 (VP16 HBM); we
also mutated the invariant histidine of the HBM to glycine in the MYC (H307G) and VP16 (VP16
HBM:H307G) contexts, or we changed all four HBM residues to alanine (4A). A mutation in the sepa-
rate WDR5-binding motif (WBM; Thomas et al., 2015) was our specificity control. We
transiently expressed these full-length FLAG-tagged MYC proteins in 293T cells and measured their
ability to interact with endogenous HCF-1 in a co-immunoprecipitation (co-IP) assay (Figure 1B). As
expected, the 4A mutation disrupts the MYC–HCF-1 interaction, as do both histidine to glycine sub-
stitutions—confirming the essentiality of this core HBM residue to the MYC–HCF-1 association. In
contrast, replacing the MYC HBM with the canonical VP16 sequence increases the amount of HCF-1
recovered in the co-IP. The enhanced binding of the VP16 HBM MYC mutant to HCF-1 is also
observed in vitro using purified recombinant MYC (Figure 1—figure supplement 1A) and in vitro
translated HCF-1VIC (Figure 1—figure supplement 1B). Based on these data, we conclude that the
MYC HBM is an authentic HBM, and that its variation from the canonical HBM sequence leads to a
tempered interaction with HCF-1. We also conclude that we can use the 4A and VP16 HBM muta-
tions to probe the significance of the MYC–HCF-1 interaction through both loss- and gain-of-func-
tion approaches.
The MYC–HCF-1 interaction stimulates proliferation of Burkitt
lymphoma cells
To understand the cellular consequences of modulating the MYC–HCF-1 interaction, we engineered
a system that allows us to express the 4A or VP16 HBM mutant MYC proteins as the sole form of
MYC in a cell. We chose Ramos cells, a Burkitt lymphoma (BL)-derived line in which a t(8;14) translo-
cation places one MYC allele under regulatory control of the immunoglobulin heavy chain enhancer
(Figure 1—figure supplement 1C; Wiman et al., 1984). The untranslocated MYC allele is not
expressed in these cells (Bemark and Neuberger, 2000). Because sequences encoding the MYC
HBM are contained within exon 3, we used CRISPR/Cas9-triggered homologous recombination of
the translocated MYC allele to integrate an exon 3 switchable cassette for wild-type (WT) MYC, 4A,
or VP16 HBM mutants, and confirmed appropriate integration by Southern blotting (Figure 1—
Popay et al. eLife 2021;10:e60191. DOI: https://doi.org/10.7554/eLife.60191 3 of 39Research article Cancer Biology Figure 1. A gain- and loss-of-function system to study the MYC–host cell factor (HCF)–1 interaction. (A) Schematic of MYC, depicting the location of the six MYC boxes (Mb0–MbIV). MbIIIb carries a WDR5-binding motif (WBM). MbIV contains an HCF-1-binding motif (HBM). Residues relevant to the WBM or HBM are in bold, and residues mutated in this study are in red. (B) FLAG-tagged full-length MYC proteins carrying the mutations described in (A) were transiently expressed in 293T cells, recovered by anti-FLAG immunoprecipitation (IP), and the input, or IP eluates, probed for the presence of HCF-1C, WDR5, or FLAG-tagged proteins by western blotting. (C) Western blot of lysates from parental (CRE-ERT2) or switchable Ramos cells (wild- type [WT], 4A, or VP16 HBM) ±20 nM 4-OHT for 24 hr. Blots were probed with antibodies against the HA tag, MYC, HCF-1C, and GAPDH. (D and E) Parental or switchable Ramos cells (WT, 4A, or VP16 HBM) were treated with 20 nM 4-OHT for 24 hr, lysates prepared, and IP performed using anti-IgG or anti-MYC antibodies. Input lysates and IP eluates were probed using antibodies against HCF-1C, WDR5, HA tag, and MYC by western blotting. All lines in these experiments express CRE-ERT2. (F) Switchable Ramos cell lines were pulsed with 20 nM 4-OHT for 2 hr to switch ~50% of cells, propagated for 3 days, and grown for 16 hr in media with or without glutamine. The impact of glutamine deprivation was measured by flow cytometry to determine the proportion of green fluorescent protein (GFP)-positive (switched) cells. For each of the mutants, the proportion of GFP-positive cells was normalized to that for WT cells. Shown are the mean and standard error for three biological replicates. Student’s t-test between +Gln and Gln Figure 1 continued on next page Popay et al. eLife 2021;10:e60191. DOI: https://doi.org/10.7554/eLife.60191 4 of 39
Research article                                                                                                            Cancer Biology

Figure 1 continued
was used to calculate p-values; a = 0.0066, b = 0.0002. (G) Switchable Ramos cells were pulsed with 4-OHT as in (F), grown for 7 days, and cell cycle
distribution determined by propidium iodide (PI) staining and flow cytometry, binning cells according to whether they expressed GFP (GFP+, switched)
or not (GFP , unswitched). Shown are the mean and standard error for three biological replicates. Student’s t-test between GFP and GFP+ cells was
used to calculate p-values; a = 0.033, b = 0.0041, c = 0.0006. (H) Switchable Ramos cells were pulsed with 4-OHT as in (F), and the proportion of GFP-
positive cells measured by flow cytometry 24 hr after treatment and every 3 days following. For each of the replicates, the proportion of GFP-positive
cells is normalized to that on day 1. Shown are the mean and standard error for three biological replicates. Student’s t-test between WT and each of
the mutants at day 25 was used to calculate p-values; a = 0.000028, b = 0.00026.
The online version of this article includes the following source data and figure supplement(s) for figure 1:
Source data 1. Raw data for MYC mutant growth curves.
Figure supplement 1. Validation of MYC mutants and switchable Ramos cell lines.
Figure supplement 2. Localization of MYC mutants and their impact on cell doubling time.

                                    figure supplement 1D and E). In cells expressing an inducible CRE-ERT2 recombinase, treatment
                                    with 4-hydroxytamoxifen (4-OHT) results in the excision of exon 3 of MYC, bringing in place a modi-
                                    fied exon 3 that carries an HA-epitope tag and drives expression of P2A-linked green fluorescent
                                    protein (GFP). Twenty-four hours after 4-OHT treatment, at least 85% of cells in each population are
                                    switched—as monitored by GFP expression (Figure 1—figure supplement 1F), and we observe the
                                    expected appearance of HA-tagged MYC proteins, which migrate more slowly due to the presence
                                    of the epitope tag (Figure 1C). Importantly, the exchanged MYC proteins are expressed at levels
                                    comparable to endogenous MYC (Figure 1C), are predominantly nuclear (Figure 1—figure supple-
                                    ment 2A and B), and behave as expected, with the 4A mutant showing reduced (Figure 1D), and
                                    the VP16 HBM mutant enhanced (Figure 1E), interaction with endogenous HCF-1. Also as expected,
                                    these mutations have minimal impact on the interaction of MYC with WDR5. Thus, we successfully
                                    generated a system for inducible, selective, and bidirectional modulation of the MYC HCF-1 inter-
                                    action in the context of an archetypal MYC-driven cancer cell line.
                                       To monitor the contribution of the MYC–HCF-1 interaction to cell proliferation, we pulsed each of
                                    our engineered Ramos lines with 4-OHT for 2 hr to generate approximately equally mixed popula-
                                    tions of switched and unswitched cells. Based on the ability of MYC to drive glutamine addiction
                                    (Jeong et al., 2014) and cell cycle progression (Pajic et al., 2000), we monitored how the GFP-posi-
                                    tive switched cells in the population compared to their unswitched counterparts in terms of gluta-
                                    mine-dependency (Figure 1F), cell cycle profiles (Figure 1G), and proliferation (Figure 1H and
                                    Figure 1—source data 1). We see that 4A switched cells have a selective advantage over the WT
                                    switch in their ability to grow without exogenous glutamine (Figure 1F). This advantage is likely due
                                    to loss of the MYC–HCF-1 interaction, as the VP16 HBM mutant cells have a corresponding deficit in
                                    growth under glutamine-starvation conditions (Figure 1F). When assayed in media replete with glu-
                                    tamine, cell cycle profiles for the two mutants are modestly altered compared to their
                                    WT counterparts, including small but statistically significant changes in the proportion of cells in G2/
                                    M (Figure 1G), which again trend in opposite directions for the two MYC mutants—decreasing for
                                    the 4A-expressing cells and increasing for those that express the VP16 HBM mutant (Figure 1G).
                                    Finally, in long-term growth assays in complete media, we observe that 4A mutant cells are gradually
                                    lost from the culture over time, whereas there is a significant enrichment of VP16 HBM cells, com-
                                    pared to the WT control (Figure 1H and Figure 1—source data 1). The differences in representation
                                    of the two MYC mutants in these populations is unlikely due to apoptosis—we observe no differen-
                                    ces in the proportion of sub-G1 cells between the different switches (Figure 1G)—but tracks with
                                    changes in cell doubling time (Figure 1—figure supplement 2C and D and Figure 1—source data
                                    1), which are increased for the 4A, and decreased for the VP16 HBM mutant cells. The altered and
                                    opposing impact of the 4A and VP16 HBM mutations in these assays leads us to conclude that the
                                    MYC–HCF-1 interaction promotes the glutamine-dependency—and rapid proliferative status—of
                                    these BL cells in culture.

                                    The MYC–HCF-1 interaction influences intracellular amino acid levels
                                    As part of our survey of the impact of the MYC–HCF-1 interaction on Ramos cell processes, and
                                    because of its influence on glutamine dependency, we determined whether metabolite levels are
                                    altered in response to expression of the 4A or VP16 HBM MYC mutants. We performed global,

Popay et al. eLife 2021;10:e60191. DOI: https://doi.org/10.7554/eLife.60191                                                                    5 of 39
Research article Cancer Biology
untargeted, mass spectrometry-based metabolomics on switched cells using reverse-phase liquid
chromatography (RPLC) and hydrophilic interaction liquid chromatography (HILIC) separation meth-
ods. We detected ~2000 metabolites with each approach (Figure 2A–F), and there is strong consis-
tency among biological replicates (Figure 2—figure supplement 1A and B). In general, more
metabolites are significantly changed, and with a greater magnitude, for the 4A than the VP16 HBM
MYC mutant (Figure 2A–B and D–E and Figure 2—source data 1 and 2). For both mutants, signifi-
cantly changed metabolites group into a variety of categories, with a particular enrichment for those
related to amino acid and lipids (Figure 2C and F). Comparing the direction of individual metabolite
changes for the 4A and VP16 HBM mutants (Figure 2—figure supplement 1C), we note that a sig-
nificant portion of the metabolite changes detected by both the RPLC and HILIC methods are in the
same direction for the two MYC mutants. In general, these shared metabolite changes fail to cluster
strongly into biological pathways; the only significantly enrichment being glycerophospholipid
metabolism (Figure 2—figure supplement 1D). Focusing on metabolite changes that occur in oppo-
site directions for the 4A and VP16 HBM mutants, however, we observe significant enrichment in
pathways linked to nitrogen and amino acid metabolism (Figure 2G). There is a clear anti-correlation
between the impact of the 4A and VP16 HBM mutations on metabolites connected to aspartic acid
(Figure 2H), and we observe that intracellular levels of glutamine (and associated metabolites) are
increased in the 4A and decreased in the VP16 HBM mutant cells (Figure 2—figure supplement 1E
and F). Notably, these changes in intracellular amino acid levels are not confined to aspartic acid
and glutamine, but there is a general tendency for amino acid levels to be increased in 4A and
decreased in VP16 HBM mutant cells, compared to the WT switch (Figure 2—figure supplement
1C and Table 1). Based on these data, we conclude that the MYC–HCF-1 interaction, directly or indi-
rectly, plays a global role in influencing intracellular amino acid levels in this setting.
The MYC–HCF-1 interaction influences expression of genes connected
to ribosome biogenesis and the mitochondrial matrix
Next, we used RNA-sequencing (RNA-Seq) to monitor transcriptomic changes associated with mod-
ulating the MYC–HCF-1 interaction. Twenty-four hours after switching, we observed changes in the
levels of ~4000 transcripts in the 4A, and ~3600 transcripts in the VP16 HBM, cells compared to the
WT switch (Figure 3—figure supplement 1A and Figure 3—source data 1 and 2). These changes
are highly consistent among biological replicates (Figure 3—figure supplement 1B) and modest in
magnitude (Figure 3A), congruous with what is typically reported for MYC (Levens, 2002;
Nie et al., 2012). We confirmed for a representative set of genes that these changes are dependent
on switching (Figure 3—figure supplement 1C). Gene ontology (GO) enrichment analysis revealed
that transcripts decreased by introduction of the 4A mutant are strongly linked to ribosome biogen-
esis, tRNA metabolism, and the mitochondrial matrix (Figure 3B), while those that are induced have
links to transcription, cholesterol biosynthesis, and chromatin. For the VP16 HBM MYC mutant,
decreased transcripts cluster in categories mostly related to the centrosome and the cell cycle
(Figure 3C). What is particularly striking, however, is that transcripts that are induced by the VP16
HBM protein have a pattern of clustering that is almost the exact opposite of those suppressed by
the 4A mutant—including ribosome biogenesis, tRNA metabolism, and the mitochondrial matrix.
If anti-correlations between these gain- and loss-of-function mutants can be used to reveal MYC–
HCF-1 co-regulated processes, the above data highlight protein synthesis and mitochondrial func-
tion as key points of convergence for the interaction of MYC with HCF-1. To explore this on a gene-
by-gene basis, we compared individual gene expression changes that were either the same, or
opposite, in direction for the 4A and VP16 HBM mutants (Figure 3D, Figure 3—figure supplement
1D and Figure 3—source data 3). Transcripts decreased by both mutations show modest enrich-
ment in categories connected to immune signaling and cell adhesion (Figure 3E, left), whereas
increased transcripts are primarily enriched in those encoding histones (Figure 3E, right). Turning to
transcripts that change in opposite directions with each mutant, those that are induced by the 4A
mutant are moderately enriched in categories relating to kinase function and the cell cycle
(Figure 3F, left), while those that are reduced by the 4A mutant are strongly enriched in categories
connected to ribosome biogenesis and the mitochondrial matrix (Figure 3F, right). The genes repre-
sented in each of these categories are shown in Figure 3—figure supplement 2A and B. This analy-
sis confirms that reciprocal changes we observed for the GO categories in Figure 3B and C results
from reciprocal changes in the expression of a common set of genes. From our data, we conclude
Popay et al. eLife 2021;10:e60191. DOI: https://doi.org/10.7554/eLife.60191 6 of 39Research article Cancer Biology
A 4A vs. WT: RPLC B 4A vs. WT: HILIC C 10
8 8 Guanidinosuccinic
Guanidinosuccinic acid 5
acid Harmol Hydroxyzine
log2FC
Tryptophyl-Tryptophan
6 6 0
-log10(Q-value)
-log10(Q-value)
PA(i-20:0/15:0)
G3P
-5
4 G3P 4
NAD
-10
11-amino- WT vs. 4A Down Up
2 undecanoic acid
2
Amines 5 3
S (328) Amino acids, peptides, and analogs 31 61
S (373) Carbohydrates and conjugates 6 15
NS (1780) NS (1519)
0 0 Lipids 132 43
-10 -5 0 5 10 -10 -5 0 5 Nucleosides, nucleotides, and analogs 1 5
log2 FC log2 FC Other 42 73
D VP16 HBM vs. WT: RPLC E VP16 HBM vs. WT: HILIC F 4
5 Guanidinosuccinic S (36)
acid NS (1811) Guanidinosuccinic 2
6 acid
4 0
log2FC
Harmol Hydroxyzine L-Aspartic Acid
-log10(Q-value)
-log10(Q-value)
1-Hexadecylglycerol
-2
3 4 Ureidosuccinic
6-phosphonatooxy- acid
D-gluconate -4
2 NAD
-6
2 WT vs. VP16 HBM Down Up
1 S (107) Amines 1 1
NS (2046) Amino acids, peptides, and analogs 4 18
Carbohydrates and conjugates 7 1
0 0 Lipids 17 8
-10 -5 0 5 10 15 20 -10 -5 0 5 Nucleosides, nucleotides, and analogs 1 3
log2 FC log2 FC Other 6 11
G 4 2
-log10 (FDR)
0 2 4 6
H
Metabolite counts
Aminoacyl-tRNA biosynthesis 2 8
Ala, asp and glu metabolism 4 5 VP16
Nitrogen metabolism 3 4 N-Acetyl-L-aspartic acid
4A HBM fold-change
D-Gln and D-glu metabolism 1 2
Cyanoamino acid metabolism 1 2
Arg and pro metabolism 4 2 -2.88 0 2.88
RPLC HILIC
L-Aspartic acid
L-Alanine Ureidosuccinc acid Argininosuccinic acid Adenylsuccinic acid L-Asparagine
Pyruvic acid Fumaric acid Oxalacetic acid
Figure 2. The MYC–host cell factor (HCF)–1 interaction influences intracellular amino acid levels. (A and B) Volcano plots of metabolites detected by
reverse-phase liquid chromatography (RPLC) (A) or hydrophilic interaction liquid chromatography (HILIC) (B) in wild-type (WT) and 4A switchable Ramos
cells treated for 24 hr with 20 nM 4-OHT. Metabolites that were significantly (S) changed (false discovery rate [FDR] < 0.05 and |FC| > 1.5) with the 4A
MYC mutant compared to WT are colored. Non-significant (NS) changes are in gray. Five biological replicates for WT and four biological replicates for
4A were used to calculate Q-values and fold-changes (FCs). Select metabolites are indicated. (C) Classification of metabolites that were significantly
changed (FDR < 0.05 and |FC| > 1.5) with the 4A mutant compared to WT cells. (D and E) Volcano plots of metabolites detected by RPLC (D) or HILIC
(E) in WT and VP16 HCF-1-binding motif (HBM) switchable Ramos cells treated for 24 hr with 20 nM 4-OHT. Metabolites that were significantly (S)
changed (FDR < 0.05 and |FC| > 1.5) with the VP16 HBM MYC mutant compared to WT are colored. Non-significant (NS) changes are in gray. Five
biological replicates for WT and VP16 HBM were used to calculate Q-values and FCs. Select metabolites are indicated. (F) Classification of metabolites
Figure 2 continued on next page
Popay et al. eLife 2021;10:e60191. DOI: https://doi.org/10.7554/eLife.60191 7 of 39Research article Cancer Biology
Figure 2 continued
that were significantly changed (FDR < 0.05 and |FC| > 1.5) with the VP16 HBM mutant compared to WT cells. (G) Annotated metabolites from
Figure 2—figure supplement 1C that were changed in the opposite direction for the 4A and VP16 HBM mutants were independently subjected to
pathway enrichment analysis. Pathways with FDR < 0.2 for either RPLC and HILIC are shown. (H) Metabolites (FDR < 0.05) in the ‘alanine, aspartate, and
glutamate metabolism’ pathway that were impacted by the 4A (left) and VP16 HBM (right) MYC mutants. Node color represents the FC over WT. The
remainder of the pathway is shown in Figure 2—figure supplement 1E and F.
The online version of this article includes the following source data and figure supplement(s) for figure 2:
Source data 1. Ramos 4A and VP16 host cell factor (HCF)–1-binding motif reverse-phase liquid chromatography significant changes.
Source data 2. Ramos 4A and VP16 host cell factor (HCF)–1-binding motif hydrophilic interaction liquid chromatography significant changes.
Figure supplement 1. Impact of the 4A and VP16 HCF-1-binding motif (HBM) mutants on Ramos cell metabolites.
that the MYC–HCF-1 interaction plays an important role in influencing the expression of genes that
promote ribosome biogenesis and maintain mitochondrial function.
Finally, we interrogated our RNA-Seq data set for transcript changes that correlate with the wide-
spread changes in amino acid levels that occur upon modulation of the MYC–HCF-1 interaction.
Here we discovered that the accumulation of amino acids we observe with the 4A mutant is gener-
ally matched with a decrease in transcripts of cognate aminoacyl-tRNA synthetases (Figure 3—
Table 1. Loss of the MYC–host cell factor (HCF)–1 interaction promotes amino acid accumulation.
Modulating the MYC–HCF-1 interaction alters intracellular amino acid levels. All data are derived
from switchable Ramos cells treated with 20 nM 4-OHT for 24 hr. Amino acid levels were measured
following separations by hydrophilic interaction liquid chromatography (HILIC). Q-values and fold-
changes (FCs) were calculated between the mutants and wild-type (WT). Five biological replicates for
WT and VP16 HCF-1-binding motif (HBM) and four biological replicates for 4A were analyzed.
Q-value < 0.05 are highlighted in green, FC > 0 in red, and FC < 0 in blue. Confidence levels reflect
the confidence in metabolite identification; L1 is validated, L2 is putative, and L3 is tentative.
ND = not detected; NS = not significant.
4A VP16 HBM Confidence level
Q-value FC Q-value FC
Glycine 2.52E-04 1.31 3.11E-05 1.48 L3
L-alanine 9.97E-05 1.62 NS L2
L-arginine 2.31E-02 1.18 NS L1
L-asparagine 6.67E-05 1.5 2.02E-03 1.23 L2
L-aspartic acid 1.24E-03 1.37 1.54E-05 2.01 L2
L-cysteine ND ND
L-glutamic acid 2.53E-03 1.46 NS L2
L-glutamine 2.33E-05 1.46 9.38E-05 1.41 L2
L-histidine 8.70E-05 1.64 NS L2
L-isoleucine 1.10E-03 1.39 2.36E-02 1.21 L2
L-leucine 8.63E-04 1.33 2.55E-02 1.18 L2
L-lysine 1.66E-02 1.19 NS L2
L-methionine 6.51E-05 1.61 4.39E-03 1.27 L2
L-phenylalanine 4.71E-04 1.48 3.46E-02 1.22 L2
L-proline 1.01E-02 1.17 NS L2
L-serine 7.48E-05 1.59 NS L1
L-threonine 9.63E-05 1.54 1.25E-02 1.17 L2
L-tryptophan 1.56E-04 1.64 NS L1
L-tyrosine 1.22E-04 1.59 1.9E-02 1.18 L2
L-valine 4.41E-02 1.14 NS L3
Popay et al. eLife 2021;10:e60191. DOI: https://doi.org/10.7554/eLife.60191 8 of 39Research article Cancer Biology
A 7.5 B -log10(Q-value)
10 20 30 55 65
-log10(Q-value)
5 10 15 20 25
ribosome biogenesis 135 50 nucleosome
46 108
Gene counts
preribosome chromatin binding
5.0 ribosomal large subunit biogenesis 42 32 cholesterol biosynthetic process
translation 150 105 transcription coregulator activity
RNA catabolic process 100 120 kinase binding
2.5 ribonucleoprotein comp subunit org 72 90 regulation of hemopoiesis
mitochondrial matrix 105 48 response to unfolded protein
log2 FC
tRNA metabolic process 59 84 covalent chromatin modification
0.0 4A decreased 4A increased
-2.5
C -log10(Q-value)
5 10 15 20 25
-log10(Q-value)
5 10 15 20 25
centrosome 124 79 ribosome biogenesis
-5.0 137 100
Gene counts
kinase binding mitochondrial matrix
kinase activity 137 132 mitochondrial envelope
microtubule-based process 133 120 translation
-7.5 regulation of cell cycle process 134 38 nucleosome
cell division 108 55 ribonucleoprotein complex assembly
M
4A
cadherin binding 70 112 transferase complex
B
H
protein domain specific binding 116 44 tRNA metabolic process
16
VP16 HBM decreased VP16 HBM increased
VP
D E 4A down/VP16 HBM down 4A up/VP16 HBM up
VP16 focal adhesion nucleosome
4A HBM leukocyte activation involved innate immune
in immune response response in mucosa
cell adhesion molecule binding response to interleukin-7
445 maintenance of location vacuole
actin binding nucleosome positioning
establishment of sterol metabolic process
endothelial barrier
cell leading edge late endosome
kinase activity regulation of adaptive
514 immune response
0 2 4 6 0 10 20 30
Gene count -log (Q-value)
-log(Q-value) 10 -log(Q-value)
20 40 60 1 37
F 4A up/VP16 HBM down 4A down/VP16 HBM up
496 regulation of autophagy ribosome biogenesis
kinase activity preribosome
regulation of T cell activation translation
306 microtubule organizing center RNA modification
kinase binding ribosomal large
subunit biogenesis
cellular response mitochondrial matrix
log2 FC to insulin stimulus
MHC class II protein complex ribonucleoprotein
complex assembly
-3 0 3 regulation of cell cycle process tRNA metabolic process
0 1 2 3 4 5 0 10 20 30 40
-log(Q-value) -log(Q-value)
Figure 3. The MYC–host cell factor (HCF)–1 interaction influences the expression of genes involved in ribosome biogenesis and mitochondrial
pathways. Switchable Ramos cells were treated with 20 nM 4-OHT for 24 hr, RNA isolated, and RNA-Seq performed. (A) Scatterplot showing the
distribution of log2FC of significant (false discovery rate [FDR] < 0.05) RNA-Seq changes with the 4A and VP16 HCF-1-binding motif (HBM) MYC
mutants, compared to the wild-type (WT) switch. Solid lines represent the median log2FC for decreased (4A: 0.2858; VP: 0.2747) and increased (4A:
0.281; VP: 0.2558) transcripts compared to WT. For clarity, some data points were excluded; these data points are highlighted in Figure 3—source
data 1 and 2. (B and C) Categories from the top eight families in gene ontology (GO) enrichment analysis of significant (FDR < 0.05) gene expression
changes under each condition (B: 4A; C: VP16 HBM). (D) Heatmap showing the log2FC of significantly (FDR < 0.05) changed transcripts that are altered
in expression in both the 4A and VP16 HBM mutants. Transcripts are clustered according to the relationship in expression changes between the 4A and
VP16 HBM mutants, and ranked by the log2FC for the 4A mutant. Scale of heatmap is limited to [ 3,3]. (E and F) Gene clusters in (D) were subject to
Figure 3 continued on next page
Popay et al. eLife 2021;10:e60191. DOI: https://doi.org/10.7554/eLife.60191 9 of 39Research article Cancer Biology
Figure 3 continued
GO enrichment analysis, and the top eight categories are shown for the correlative (E) or anti-correlative (F) clusters. The Q-value of categories is
represented by bubble color, and the number of genes present in a category is represented by bubble size. The genes in these categories are
identified in Figure 3—figure supplement 2A and B.
The online version of this article includes the following source data and figure supplement(s) for figure 3:
Source data 1. Ramos 4A 24 hr RNA-Seq significant changes.
Source data 2. Ramos VP16 host cell factor (HCF)–1-binding motif 24 hr RNA-Seq significant changes.
Source data 3. Ramos 4A and VP16 host cell factor (HCF)–1-binding motif 24 hr RNA-Seq shared significant changes.
Figure supplement 1. Gene expression changes induced by the 4A and VP16 host cell factor (HCF)–1-binding motif (HBM) mutants.
Figure supplement 2. Gene ontology (GO) enrichment analysis of correlative and anti-correlative effects on gene expression.
Figure supplement 3. Amino acids and their cognate tRNA-ligases are influenced by the MYC–host cell factor (HCF)–1 interaction.
figure supplement 3A)—and vice versa for the decreased amino acid levels in the gain-of-function
VP16 HBM mutant (Figure 3—figure supplement 3B). The reciprocal relationship of amino acid lev-
els and tRNA ligase expression changes in response to the 4A and VP16 HBM mutants is consistent
with the notion that defects in tRNA charging lead to compensatory changes in amino acid uptake
(Guan et al., 2014; Harding et al., 2000), further reinforcing the concept that a key biological con-
text in which MYC and HCF-1 function together is protein synthesis.
Ribosome biogenesis and mitochondrial matrix genes respond rapidly
to HCF-1 depletion
As a challenge to the concept that ribosome biogenesis and mitochondrial matrix genes are con-
trolled via the MYC–HCF-1 interaction, we asked whether expression of these genes is impacted by
acute depletion of HCF-1, mediated via the dTAG method (Nabet et al., 2018). We used CRISPR/
Cas9-triggered homologous recombination to integrate an mCherry-P2A-FLAG-FKBP12F36V cassette
into the HCFC1 locus in Ramos cells; the effect of which is to amino-terminally tag HCF-1N with the
FLAG epitope and FKBP12F36V tags, and to mark the population of modified cells by mCherry
expression (Figure 4—figure supplement 1A). Because the HCFC1 locus resides on the X-chromo-
some, and because Ramos cells are derived from an XY patient, only a single integration event is
needed. Tagged cells sorted by fluorescence-activated cell sorting display the expected shift in
apparent molecular weight of HCF-1N and the appearance of an appropriately-sized FLAG-tagged
species (Figure 4A). Addition of the dTAG-47 degrader results in the rapid and selective disappear-
ance of the HCF-1N fragment; the HCF-1C fragment is largely unaffected by up to 24 hr of dTAG-47
treatment (Figure 4B). Consistent with the known functions of HCF-1 (Julien and Herr, 2003),
treated cells display altered cell cycle profiles (Figure 4—figure supplement 1B), but appear to be
able to complete at least one round of cell division, as notable deficits in proliferation are only evi-
dent 48 hr after dTAG-47 addition (Figure 4C and Figure 4—source data 1). These data reveal that
the HCF-1N fragment is essential in Ramos cells, and that early time point analyses should be resis-
tant to complicating effects of HCF-1N degradation on cell proliferation.
We performed RNA-Seq analysis 3 hr after addition of dTAG-47—a time point at which the
majority of HFC-1N is degraded (Figure 4B). Despite the early time point, we identified ~4500 signif-
icant transcript changes associated with dTAG-47 treatment of sorted cells (Figure 4—figure sup-
plement 1C and Figure 4—source data 2). These changes are equally divided between increased
and decreased, although decreased transcripts are generally more impacted (larger median fold-
change [FC]) than those that are induced (Figure 4D). Seventy-five of these differentially expressed
genes are also altered in response to dTAG-47 treatment of unmodified Ramos cells (Figure 4—fig-
ure supplement 1D and E and Figure 4—source data 3) and were excluded from further analyses.
GO enrichment analysis showed that transcripts reduced by HCF-1N degradation are similar in kind
to those reduced by the 4A mutation in MYC—including ribosome biogenesis and tRNA metabolic
processes (Figure 4E)—while those induced by HCF-1N degradation tend to be cell cycle-connected
(Figure 4E and Figure 4—figure supplement 1F). We validated representative transcript changes
by reverse transcription and quantitative PCR (RT-qPCR; Figure 4—figure supplement 1G). Impor-
tantly, many of the genes that are differentially expressed upon HCF-1N degradation are also differ-
entially expressed in the presence of either the 4A or VP16 HBM mutants (Figure 4—figure
supplement 1H), and we identified a union set of ~450 genes—oppositely regulated by the 4A and
Popay et al. eLife 2021;10:e60191. DOI: https://doi.org/10.7554/eLife.60191 10 of 39Research article Cancer Biology
A Parent Tagged B C D
+dTAG-47
+dTAG-47
4
+DMSO
+DMSO
+DMSO
+dTAG-47
0.8 3
16hr
24hr
+DMSO
1hr
2hr
3hr
4hr
6hr
8hr
c
2
cells/ml (x106)
0.6 +dTAG-47 ***
IB: HCF-1N IB: HCF-1N 1
log2 FC
0.4 0
IB: HCF-1N b
IB: FLAG *** -1
(long) 0.2 a
IB: HCF-1C
** -2
IB: HCF-1C
0.0 -3
0 1 2 3 4
IB: GAPDH IB: GAPDH -4
Days post dTAG-47 addition dTAG-47
vs. DMSO
E -log10(Q-value)
2 4 6 8 10
F MYC
MYC
VP16 HCF-1N
G
HCF-1N dTAG log2FC vs. DMSO
58
4A HBM dTAG
ribosome biogenesis 1
hydrolase activity, acting on ester bonds 108
cellular protein catabolic process 110
Gene counts
Golgi membrane 106
transferase complex 107 0
methyltransferase activity 42
lysosomal membrane 61
tRNA metabolic process 34
-1
-log10(Q-value)
20 40 60
chromosome segregation 132
regulation of cell cycle process 216 -2
Gene counts
mRNA processing 145
spindle 117
nuclear body 190
up n
do up
BM w
RNA catabolic process 124 log2FC
n
H do
A
w
BM 4
translation 174
1 6 4A
regulation of chromosome organization 112 -3 0 3
H
VP
16
VP
Figure 4. Genes regulated by the MYC host cell factor (HCF)–1 interaction are impacted by loss of HCF-1. (A) Western blot, comparing the effects of
treating untagged parental cells or FKBPFV-HCF-1N Ramos cells with DMSO or 500 nM dTAG-47 for 24 hr. Blots for HCF-1N, FLAG tag, HCF-1C, and
GAPDH are shown. (B) Western blot of lysates from FKBPFV-HCF-1N Ramos cells treated with 500 nM dTAG-47 for varying times, compared to cells
treated with DMSO for 24 hr. Shown are short and long exposures of HCF-1N, and HCF-1C, with a GAPDH loading control. (C) Growth curve of FKBPFV-
HCF-1N Ramos cells treated with DMSO or 500 nM dTAG-47. Cells were counted every 24 hr for 4 days after plating. Shown are the mean and standard
error for three biological replicates. Student’s t-test was used to calculate p-values; a = 0.0029, b = 0.000051, c = 0.000040. (D) Scatterplot showing the
distribution of log2FC in RNA-Seq comparing DMSO to 3 hr of 500 nM dTAG-47 treatment (degradation of HCF-1N). Solid lines represent the median
log2FC for decreased ( 0.425655) and increased (0.270428) transcripts. For clarity, one data point was excluded; this data point is highlighted in
Figure 4—source data 2. (E) Gene ontology enrichment analysis of transcripts significantly (false discovery rate [FDR] < 0.05) decreased (top) and
increased (bottom) in expression following treatment of FKBPFV-HCF-1N Ramos cells with dTAG-47 for 3 hr. Excluded from this analysis are transcripts
that were significantly changed when parental Ramos cells were treated with dTAG-47 for 3 hr. (F) Heatmap showing the log2FC of transcripts with
significantly (FDR < 0.05) changed expression, as measured by RNA-Seq, under the indicated conditions. Transcripts are clustered according to the
relationship in expression changes between the 4A and VP16 HBM mutants, and ranked by the log2FC for the 4A mutant. Scale of heatmap is limited to
[ 3,3]. (G) Box-and-whisker plot showing the relationship between transcripts that are anti-correlated between the 4A and VP16 HBM MYC mutants,
and significantly changed with the degradation of HCF-1N. Box denotes the 25th to 75th percentile, whiskers extend from minimum to maximum point,
and middle line marks the median (4A down/VP16 HBM up: 0.2276; 4A up/VP16 HBM down: 0.2349).
The online version of this article includes the following source data and figure supplement(s) for figure 4:
Source data 1. Raw data for host cell factor (HCF)–1N degradation growth curve.
Source data 2. Ramos host cell factor (HCF)–1N degradation RNA-Seq significant changes.
Source data 3. Ramos untagged RNA-Seq significant changes.
Figure supplement 1. Inducible degradation of host cell factor (HCF)–1N.
Popay et al. eLife 2021;10:e60191. DOI: https://doi.org/10.7554/eLife.60191 11 of 39Research article Cancer Biology
VP16 HBM mutants—the expression of which also changes when HCF-1N is destroyed (Figure 4F).
Within this set, loss of HCF-1N tends to mimic the loss of interaction 4A mutant (Figure 4G). More-
over, within the cohort of transcripts that are reduced by both HCF-1N destruction and the 4A muta-
tion, we see clear representation of genes connected to ribosome biogenesis and the mitochondrial
matrix (Figure 4—figure supplement 1I and J). Although performing RNA-Seq at this early time
likely underestimates the impact of loss of HCF-1N on the transcriptome, the presence of these ribo-
some biogenesis and mitochondrial matrix genes at the point of coalescence of all our RNA-Seq
experiments strongly suggests that they are directly controlled by the MYC–HCF-1 interaction.
Most HCF-1 binding sites on chromatin are bound by MYC
To help identify direct transcriptional targets of the MYC–HCF-1 interaction, we next compared the
genomic locations bound by MYC and HCF-1N in Ramos cells. We performed ChIP-Seq using an
antibody against the amino-terminus of HCF-1 (Machida et al., 2009), and identified ~1900 peaks
for HCF-1N (Figure 5—source data 1), the majority of which are promoter proximal (Figure 5A).
These peaks occur at genes enriched in functions connected to HCF-1 (Minocha et al., 2019),
including the mitochondrial envelope, the cell cycle, as well as ribonucleoprotein complex biogenesis
(Figure 5B). Known (Figure 5C) and de novo (Figure 5—figure supplement 1A) motif analysis
revealed that HCF-1N peaks are enriched in DNA sequences linked to nuclear respiratory factor
(NRF)–1, as well as the Sp1/Sp2 family of transcription factors. Although linked to NRF-1, the
‘CATGCG’ motif is also a non-canonical E-box that MYC binds in vitro and in vivo (Blackwell et al.,
1993; Haggerty et al., 2003; Morrish et al., 2003; Shi et al., 2014). Overlaying these data with our
previous ChIP-Seq analysis of MYC in Ramos cells (Thomas et al., 2019), we see that 85% of these
HCF-1N peaks are also bound by MYC (Figure 5D and Figure 5—source data 2). The relationship
between MYC and HCF-1N at these sites is intimate (Figure 5E and F and and Figure 5—figure sup-
plement 1B), and sites of co-binding tend to have higher signals for MYC (Figure 5G) and HCF-1
(Figure 5—figure supplement 1C) than instances where each protein binds alone. As expected
from the strong coalescence of MYC and HCF-1N binding events, the properties of shared MYC–
HCF-1N peaks are very similar to those of HCF-1N alone, in terms of promoter-proximity (Figure 5—
figure supplement 1D), GO enrichment categories (Figure 5—figure supplement 1E), and motif
representation (Figure 5—figure supplement 1F). We conclude that most HCF-1N binding sites on
chromatin in Ramos cells occur at promoter proximal sites and that the majority of these sites are
also bound by MYC.
We previously reported that WDR5 has an important role in recruiting MYC to chromatin at a
cohort of genes overtly linked to protein synthesis, including more than half of the ribosomal protein
genes (Thomas et al., 2019). To determine whether these genes are also bound by HCF-1, we com-
pared our HCF-1N and MYC ChIP-Seq data to those we generated for WDR5 in this setting. Interest-
ingly, there is little overlap of binding sites for MYC, WDR5, and HCF-1N in Ramos cells, with
just ~5% of MYC– HCF-1N co-bound sites also being bound by WDR5 (Figure 5H). Moreover, of the
88 sites bound by all three proteins, only three of these are sites where WDR5 has a functional role
in MYC recruitment. Thus, despite the fact that both WDR5 and HCF-1 are often members of the
same protein complex (Cai et al., 2010), and despite both of them having links to key aspects of
protein synthesis gene expression, the two proteins associate with MYC at distinct and separate
regions of the genome.
Finally, we overlaid the physical location of MYC and HCF-1N on chromatin with gene expression
changes we had monitored in earlier experiments. Looking at genes displaying promoter proximal
binding of MYC and HCF-1N—where clear gene assignments can be made—we see that approxi-
mately one-third of these genes are differentially regulated in the presence of either the 4A or VP16
HBM MYC mutants, and that this is significantly more than that predicted by chance alone
(Figure 5I and Figure 5—figure supplement 1G). For the 4A mutant, a slightly greater proportion
of co-bound genes are downregulated, while the opposite is true for the VP16 HBM mutant (Fig-
ure 5—figure supplement 1G). A relatively small cohort of MYC–HCF-1N co-bound genes are oppo-
sitely impacted by the 4A and VP16 HBM mutants (Figure 5—figure supplement 1G; ‘4A/VP’), but
comparing these with those deregulated by depletion of HCF-1N (Figure 5J), we again see that a
majority are connected to ribosome biogenesis and mitochondria, and that most are positively regu-
lated by HCF-1 and the MYC–HCF-1 interaction. Together, these data strongly support the notion
Popay et al. eLife 2021;10:e60191. DOI: https://doi.org/10.7554/eLife.60191 12 of 39Research article Cancer Biology Figure 5. MYC is a widespread binding partner of host cell factor (HCF)–1 on chromatin. (A) Distribution of HCF-1N peaks in Ramos cells in relation to the nearest transcription start site (TSS), as determined by ChIP-Seq. (B) Gene ontology (GO) categories strongly represented in genes nearest to HCF- 1N peaks in Ramos cells. (C) Known motif analysis of HCF-1N peaks in Ramos cells. Two of the most highly enriched motifs are shown, as well as the percentage of target and background sequences with the motif, and the p-value. (D) Venn diagram showing HCF-1N and MYC peaks in Ramos cells, Figure 5 continued on next page Popay et al. eLife 2021;10:e60191. DOI: https://doi.org/10.7554/eLife.60191 13 of 39
Research article                                                                                                           Cancer Biology

Figure 5 continued
and the number of regions that overlap between the data sets. ChIP-Seq data for MYC are from GSE126207. (E) Heatmap of all MYC peaks in Ramos
cells (from GSE126207) and the corresponding region in Ramos HCF-1N ChIP-Seq, representing the combined average of normalized peak intensity
in ±2 kb regions surrounding the peak centers with 100 bp bin sizes. Ranking is by peak intensity in HCF-1N. (F) Example Integrative Genomics Viewer
(IGV) screenshots of regions that have overlapping peaks for MYC and HCF-1N in Ramos cells. (G) Normalized MYC ChIP-Seq fragment counts where
peaks overlap with HCF-1N (MYC/HCF), compared to where they do not overlap (MYC) in Ramos cells. Data are smoothed with a cubic spline
transformation. (H) Venn diagram showing relationship between HCF-1N, MYC, and WDR5 peaks in Ramos cells, and the overlap between co-bound
genes and genes for which WDR5 is responsible for MYC recruitment. GO enrichment analysis of genes co-bound by MYC and WDR5—taken from
Thomas et al., 2019—is also shown. (I) The proportion of protein-coding genes that were co-bound by promoter-proximal MYC and HCF-1N by ChIP-
Seq or an equal number of non-co-bound genes were compared to transcripts that were unchanged or significantly changed (false discovery rate [FDR]
< 0.05) with the 4A and VP16 HCF-1-binding motif (HBM) mutants by RNA-seq. p-Value for the 4A mutant is 1.982  10 14 and 6.933  10 14 for the
VP16 HBM mutant. (J) Heatmap showing genes that are co-bound by promoter proximal MYC and HCF-1N in Ramos cells, have anti-correlative gene
expression changes between for the 4A and VP16 MYC mutants, and have significant gene expression changes with HCF-1N degradation. Genes that
fall into GO categories relating to ribosome biogenesis or translation (RiBi/translation), and mitochondrial function or metabolism (Mito/metabolism)
are highlighted.
The online version of this article includes the following source data and figure supplement(s) for figure 5:
Source data 1. Ramos host cell factor (HCF)–1N annotated ChIP-Seq peaks.
Source data 2. Annotated intersect of ChIP-Seq peaks for host cell factor (HCF)–1N and MYC in Ramos cells.
Figure supplement 1. Comparison of MYC and host cell factor (HCF)–1N localization on Ramos cell chromatin.

                                    that ribosome biogenesis and mitochondrially connected genes are direct targets of the MYC–HCF-
                                    1 interaction.

                                    MYC and HCF-1 bind chromatin independent of their ability to interact
                                    It has been reported that deletion of MbIV from N-MYC reduces the ability of MYC:MAX dimers to
                                    bind DNA (Cowling et al., 2006). This phenotype is unrelated to the MYC HBM, however, as we
                                    determined that neither the 4A nor the VP16 HBM mutations have an overt impact on the binding of
                                    recombinant MYC:MAX dimers to DNA in vitro (Figure 6—figure supplement 1A and B).
                                        To further explore whether the MYC–HCF-1 interaction influences the ability of either protein to
                                    engage its chromatin binding sites in cells, we performed ChIP-Seq for HCF-1N and MYC-HA in our
                                    switchable MYC cells that were treated with 4-OHT for 24 hr. Binding of HCF-1N to chromatin is
                                    largely unaffected by the 4A or VP16 HBM mutations (Figure 6A and Figure 6—figure supplement
                                    1C), demonstrating that MYC does not recruit HCF-1 to chromatin. Binding of MYC is subtly altered
                                    by both the 4A and VP16 HBM mutations (Figure 6B and Figure 6—figure supplement 1D), but
                                    these changes are widespread and for the most part shared between the loss-of-function and gain-
                                    of-function MYC mutants (Figure 6—source data 1). Indeed, focusing on the top 140 significant
                                    changes, we see that the 4A and the VP16 HBM mutants both tend to have increased or expanded
                                    chromatin binding, compared to WT MYC (Figure 6C). Visual inspection of the ChIP-Seq data
                                    (Figure 6D and Figure 6—figure supplement 1E) confirms the subtlety of these effects and reinfor-
                                    ces the concept that the binding of MYC (and HCF-1) to chromatin is not impacted in opposite ways
                                    by the 4A and VP16 HBM mutations. We further verified by ChIP-PCR—at genes flagged as direct
                                    targets in Figure 5 —that binding of MYC (Figure 6E) and HCF-1 (Figure 6—figure supplement
                                    1F) is largely insensitive to the 4A and VP16 HBM mutations. Thus, although the HBM may play a
                                    modest role in chromatin targeting by MYC in cells, this is likely to be independent of the MYC–
                                    HCF-1 interaction. We conclude that MYC and HCF-1 interact to control the expression of ribosome
                                    biogenesis and mitochondrially connected genes through a co-recruitment-independent mechanism.

                                    The MYC–HCF-1 interaction is important for tumor engraftment and
                                    maintenance
                                    The ability of MYC to regulate ribosome (van Riggelen et al., 2010) and mitochondrial
                                    (Morrish and Hockenbery, 2014) biogenesis are core aspects of its tumorigenic repertoire. We
                                    would expect, therefore, that disrupting the MYC–HCF-1 interaction would have a significant impact
                                    on the ability of Ramos lymphoma cells to establish and maintain tumors in vivo. To address this
                                    expectation, we tested the impact of the 4A MYC mutant on tumorigenesis in mice. Because this is
                                    such an aggressive tumor model (Thomas et al., 2019), we did not test the gain-of-function VP16

Popay et al. eLife 2021;10:e60191. DOI: https://doi.org/10.7554/eLife.60191                                                                  14 of 39
Research article Cancer Biology
A HCF-1N ChIP-Seq B MYC–HA ChIP-Seq
800 WT 800 WT
4A 4A
VP16 HBM VP16 HBM
600 600
Peak reads
Peak reads
400 400
200 200
0 0
0 500 1000 1500 2000 2500 0 5000 10000 15000 20000 25000
Rank Rank
C D
[0 - 194] chr5 [0 - 48] chr2
WT
MYC-HA
[0 - 194] [0 - 48]
4A * *
[0 - 194] [0 - 48]
VP16 HBM * *
LARP1 TMEM127 CIAO1
154,132,018 154,137,018 96,929,597 96,934,597
[0 - 19] chr19 [0 - 286] chr17
WT
HCF-1N
[0 - 19] [0 - 286]
4A *
[0 - 19] [0 - 286]
VP16 HBM *
ZNF582 ZNF582-AS1 FAM222B
56,902,540 56,907,540 27,167,555 27,172,555
E
0.8 parental: HA
[0 - 118] chr19 [0 - 58] chr5
MYC-HA
WT: HA-MYC WT
0.6 4A: HA-MYC 4A
[0 - 118] [0 - 58]
Percent input
VP16 HBM: HA-MYC [0 - 118] [0 - 58]
VP16 HBM
0.4 WT
[0 - 46] [0 - 93]
HCF-1N
[0 - 46] [0 - 93]
4A
0.2 [0 - 46] [0 - 93]
VP16 HBM
0.0 EXOSC5 BCKDHA MRPL36 NDUFS6
5
0
1A
1
3
BB
41,900,698 41,905,698 1,798,103 1,803,103
SC
2
S
G
TP
LR
F2
F4
H
O
U
EI
PO
EI
EX
Figure 6. MYC and host cell factor (HCF)–1 bind chromatin independent of their ability to interact. (A) Scatterplots of normalized average read counts
for HCF-1N ChIP-seq peaks in wild-type (WT), 4A, or VP16 HCF-1-binding motif (HBM) switched cells. (B) As in (A) but showing normalized average read
counts for MYC–HA ChIP-seq peaks. (C) Heatmap of the combined average normalized peak intensity in 100 bp bins for MYC-HA peaks that were
significantly changed (false discovery rate [FDR] < 0.05 and |log2FC| > 0.7) for both the 4A and VP16 HBM mutants, and were within ±2 kb of a TSS. (D)
Example IGV screenshots of regions that had significant (top) or non-significant (bottom) changes for MYC-HA or HCF-1N by ChIP-seq. Asterisks mark
the peaks that were significantly changed compared to WT. (E) ChIP, using anti-HA antibody, was performed on parental or switchable Ramos cells
treated for 24 hr with 20 nM 4-OHT. Enrichment of genomic DNA was monitored by qPCR using primers that amplify across peaks. HBB is a negative
locus for HA-MYC. ChIP efficiency was measured based on the percent recovery from input DNA. Shown are the mean and standard error for three
biological replicates.
The online version of this article includes the following source data and figure supplement(s) for figure 6:
Source data 1. MYC-HA ChIP-seq peaks significantly (false discovery rate [FDR] < 0.05) affected by 4A and VP16 host cell factor (HCF)–1-binding
motif mutants.
Figure 6 continued on next page
Popay et al. eLife 2021;10:e60191. DOI: https://doi.org/10.7554/eLife.60191 15 of 39You can also read