Napier City Council Summary
←
→
Page content transcription
If your browser does not render page correctly, please read the page content below
Napier
City Council

Summary
Annual Report

For the period 1 July 2012 to 30 June 2013
Napier City Council Annual Report Summary 2012/13

                                        Contents
                         Mayor and Chief Executive Report                                     3
                         Financial Condition Indicators                                       5
                         How Rates Were Spent                                                 5
                         Financial Summary                                                    6
                         Major Budget Variances7
                         Shared Services                                                     10
                         Financial Overview                                                  11

                         Activity Summary                                                    23
                         Democracy and Governance                                            23
                         Roading23
                         Solid Waste                                                         24
                         Stormwater24
                         Sewerage25
                         Water Supply                                                        25
                         Recreation26
                         Social and Cultural                                                 27
                         City Promotion                                                      29
                         Planning and Regulatory                                             30
                         Property Assets                                                     31

                         Napier City Council
                         231 Hastings Street, Napier 4110
                         Private Bag 6010, Napier 4142
                         Phone: 06 835 7579 / Fax: 06 835 7579 / Email: info@napier.govt.nz
                         www.napier.govt.nz

                                                                      Aerial photos courtesy of Peter Scott
                                                                              www.abovehawkesbay.co.nz
Napier City Council Annual Report Summary 2012/13
Mayor and Chief Executive Report
So, what has Napier City achieved in the last year.
Importantly our finances remain in a strong position allowing us to keep our rates at 1.2% and our public debt
reduced to $2 million.
Activity at the Parklands development continues to fund amenity and facilities for residents and visitors and these
add huge value to the city experience and peoples lifestyles.
Projects completed over the last 12 months are:
Moving Marineland Penguins to a new extension of the Aquarium
Junior Cycle Track on Marine Parade
Marine Parade Playground additions for older children and the start of the landscaping to the Aquarium
Greening of Napier programme continued throughout the city
Onekawa Spray Park
Stage One of the Hastings Street upgrade has been completed and the large stormwater project along Tennyson
Street to Marine Parade beach successfully and safely finished. A pier over the outfall will be constructed in 2014.
Taipo Stream Pathway continues the city’s desire to have pathways accessible to all. Roading projects include the
Pandora Road roundabout, Puketapu Road reconstruction, Hill Road and Northe Terrace.
Significantly the Museum & Art Gallery was handed back to Council in April ready to be filled with the treasures of
Hawke’s Bay. The completion of Herschell Street upgrade adds to the ambience of this special area and the MTG
(Museum Theatre Gallery) is now back as the cultural heart of Hawke’s Bay.
2012/13 year ends with a huge amount of work completed for the city – it is thanks to our staff, the Council and
residents that we can be proud of our city.
Barbara Arnott Wayne Jack
MAYOR CHIEF EXECUTIVE
Page 3
Napier City Council Annual Report Summary 2012/13
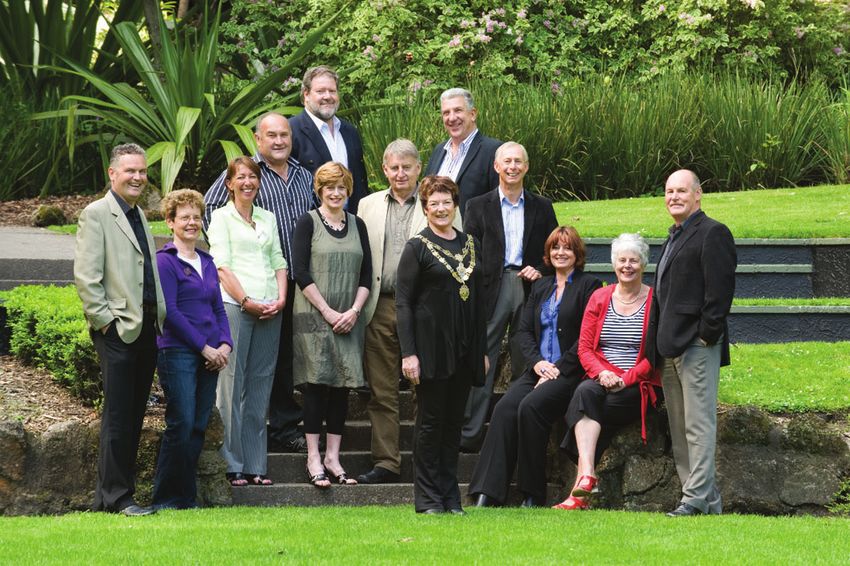
Mayor and Councillors as at 30 June 2013
Back Row (L-R): Cr Keith Price (Onekawa–Tamatea Ward), Cr Bill Dalton JP, Cr Tony Jeffery JP.
Middle Row (L-R): Cr Rob Lutter (Taradale Ward), Cr Maxine Boag (Nelson Park Ward), Cr Michelle Pyke,
Cr Faye White, Cr Mark Herbert (Ahuriri Ward), Cr John Cocking.
Front Row (L-R): Mayor Barbara Arnott, Cr Tania Wright JP (Taradale Ward), Cr Kathie Furlong (Deputy
Mayor), Cr Dave Pipe (Nelson Park Ward).
Mission Statement
To provide the Facilities and Services and the Environment,
Leadership, Encouragement and Economic Opportunity
to make Napier the Best City in New Zealand
in which to live, work, raise a family,
and enjoy a safe and satisfying life.
Page 4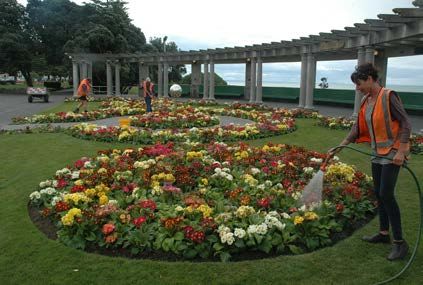
Napier City Council Annual Report Summary 2012/13

Financial Condition Indicators
                                                                                                              Actual    TYP/AP              Actual
                                                                                                               2013       2013               2012
                                                                                                               $000       $000               $000

Rates revenue                                                                                               45,938        45,466        44,840
Net surplus                                                                                                  7,837        16,216        18,744
Working capital                                                                                             80,147        24,642        69,317
Public debt                                                                                                  2,021         2,020         4,028
Total assets                                                                                             1,378,123     1,379,746     1,375,190

Proportion of rates revenue to total revenue (%)                                                              53.48%     46.80%             47.30%
Public debt as a percentage of total assets                                                                    0.15%      0.15%              0.30%
Proportion of rates revenue applied to service debt (%)*                                                       7.50%      9.30%              8.30%
* Gross interest cost is used for this calculation - internal interest income included not
as a reduction of interest cost. Refer Borrowing Programme page 86 of the full Annual
Report..

How Rates Were Spent
The chart below shows the split of rates expenditure between Council’s activities. A negative percentage indicates
a contribution to rates.
                                                    Roading                                                                        26.68%
                                                Stormwater                                                  11.49%
                                              Sportsgrounds                                         9.28%
                                                   Reserves                                      8.02%
                                                    Libraries                                    7.78%
                                Democracy and Governance                                 4.79%
                                      Napier Aquatic Centre                            4.12%
                                HB Museum and Art Gallery                              4.10%
                                                Wastewater                             3.96%
                                       Community Planning                             3.34%
                                               Public Toilets                   2.12%
                                City and Business Promotion                     2.05%
                                              Water Supply                      2.01%
                                       Regulatory Consents                     1.78%
                                   National Aquarium of NZ                    1.52%
                                             Planning Policy                  1.50%
                                                Solid Waste                   1.13%
                                  Napier Municipal Theatre                   1.07%
                                                 Cemeteries                  1.06%
                                      Environmental Health                   1.03%
                                   Emergency Management                      0.97%
                                 Napier i-SITE Visitor Centre                0.80%
                                              Inner Harbour                  0.74%
                                          Building Consents                  0.67%
                           War Memorial Conference Centre                   0.59%
                                             Animal Control                 0.55%
                                       Marine Parade Pools                  0.53%
                                                       Halls                0.43%
                                             City Promotion                 0.24%
                                              Par 2 MiniGolf       -0.19%
                             Retirement and Rental Housing        -0.63%
                                              Kennedy Park      -1.53%
                                          Property Holdings -2.04%

                                                                                                                                        Page 5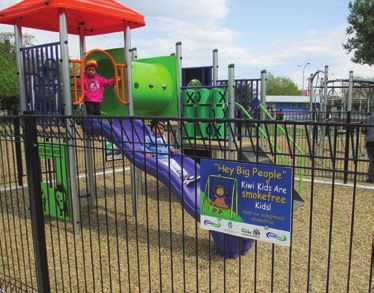
Napier City Council Annual Report Summary 2012/13

Financial Summary
                                                                         Actual                                     Budget          Actual
                                                                          2013                                        2013           2012
                                                                          $000                                        $000           $000
   Summary Statement of Comprehensive Income for the Year Ended 30 June 2013
   Total income                                                          85,899                                      97,144         94,805
   Less operating expenditure                                            78,098                                      80,863         75,984
   Less finance costs                                                       255                                         278            289
   Share of associate surplus/(deficit)                                     291                                         213            212
   Income tax expense                                                         -                                           -              -
   Surplus/(deficit) after tax                                            7,837                                      16,216         18,744

   Valuation gains (loss) taken to equity                                                               (392)                -       8,176
   Fair value gains/(losses) through comprehensive income on investments                                 (20)                -           7

   Total comprehensive income                                                                           7,425        16,216         26,927

   Statement of Changes in Equity for the Year Ended 30 June 2013
   Balance at 1 July                                                                              1,352,959 1,339,461 1,326,032
   Surplus/(deficit) after tax                                                                        7,837    16,216    18,744
   Valuation gain/(loss) taken to equity                                                                (412)                -       8,183

   Total equity                                                                                   1,360,386      1,355,677       1,352,959

   Statement of Financial Position as at 30 June 2013
   Total current assets                                                                              94,029    43,931    85,084
   Total non-current assets                                                                       1,284,094 1,335,815 1,290,106
   Total assets                                                                                   1,378,123 1,379,746 1,375,190
   Total current liabilities                                                                         13,883    19,289    15,767
   Total non-current liabilities                                                                      3,854     4,780     6,464
   Total liabilities                                                                                 17,737    24,069    22,231

   Total public equity                                                                            1,360,386      1,355,677       1,352,959

   Statement of Cash Flows for the Year Ended 30 June 2013
   Net cash from operating activities                                                                 34,623         30,658         37,069
   Net cash from investing activities                                                               (29,224)       (19,056)       (39,666)
   Net cash from financing activities                                                                (2,008)        (2,008)             (8)
   Net (decrease)/increase in cash, cash equivalents and bank overdrafts                               3,391          9,594        (2,605)

   Cash, cash equivalents and bank overdrafts at the beginning of the year                             4,612         (1,520)         7,217

   Cash, cash equivalents and bank overdrafts at the end of the year                                    8,003          8,074         4,612

   1.    Part 6 Section 98 (4) (b) of the Local Government Act 2002 requires Council to make publicly available a summary of information
         contained in its Annual Report.
   2.    The specific disclosures included in the summary financial report have been extracted from the full financial report authorised for
         issue by the Mayor and Chief Executive on 8 October 2013. This summary has been prepared in accordance with FRS-43: Summary
         Financial Statements.
   3.    The summary financial report cannot be expected to provide as complete an understanding as provided by the full financial
         report. The full financial report dated 8 October 2013 has received an unqualified audit report. A copy of the financial report may
         be obtained from Council’s offices and from Councils website napier.govt.nz. Select Plans, Policies, Bylaws tab and then Plans &
         Reports.
   4.    This summary financial report has been examined by the auditor for consistency with the full financial report. An unqualified
         auditor’s report is included with this summary.
   5.    The Summary Financial Statements are for Napier City Council as an individual entity and are presented in New Zealand dollars
         rounded to $000’s.
   6.    The primary objective of Napier City Council is to provide goods and services for the community or social benefit rather than
         making a financial return. Accordingly, Napier City Council has designated itself as a public benefit entity for the purposes of New
         Zealand equivalents to NZ IFRS.
   7.    The full financial report was prepared in accordance with New Zealand Generally Accepted Accounting Practice (NZ GAAP) and
         comply with New Zealand equivalents to International Financial Reporting Standards (IFRS) as appropriate for public benefit
         entities.
   8.    Changes to Accounting Policy - There were no changes this year.

Page 6
Napier City Council Annual Report Summary 2012/13
Major Budget Variances
Explanations for major variations from Council’s 2012/13 Annual Plan are as follows:
2.1. Statement of Financial Performance
2.1.1 Income
Income was $11.2m below 2012/13 budget and $8.9m below 2011/12 year. Significant variances to budget arise
from other revenue and other gains/(losses) classifications as follows:
(a) Finance Income
Interest income of $3.5m for 2012/13 was better than budget by $1.8m. Interest bearing deposits were significantly
higher during the year than anticipated in the budget as cash held by Council was significantly higher than budget.
Cash held is invested in interest bearing deposits in accordance with Councils investment policy. Increased amounts
held on deposit have resulted in higher than planned interest income.
(b) Other Revenue:
Other revenue: This item was $8.1m under budget for the 2012/13 year. The most significant variances were:
Parklands Residential Development section sales were $5.9m below budget for the year, and $3.1m lower
than 2011/12. New section sales slowed significantly during the 2012/13 year, as a result of the current
economic conditions.
Income for the City Promotion group was below budget by $0.9m. The budget variance was due to the later
than anticipated start date of the Art Deco Buses $0.4m (partially offset by lower than planned expenditure
$0.3m), and lower than anticipated demand for tourist accommodation at Kennedy Park $0.3m
Vested assets are recognized through revenue when infrastructure assets are passed to Council. This is
generally the result of a housing development. Vested assets from residential developments were $1.0m
(56%) below budgetand $0.7m below 2011/12. Vested assets from other assets were $0.5m (76%) below
budget for the year. City growth was 73% of that assumed in the 2012/13 Annual Plan.
(c) Other Gains/(losses)
Other gains/(losses) were $5.8m below budget. Other gains/(losses) are detailed in Note 6 of these Financial
Statements. The variance between actual and budget was a combination of losses on disposal of assets, revaluation
of investment property and library book stock valuation variances.
Disposal of assets resulted in a variance to budget of -$0.7m. This loss arose from the disposal of a number
of Council assets during 2012/13. The amount of loss being the difference between the book value of the
asset, and the disposal value. The losses related to disposal of assets which were renewed, upgraded or
surplus to requirements.
Investment property revaluation resulted in a valuation loss of $3.6m. This was a -$5.0m variance to budget.
The lower valuation reflects both lower inflation levels and weak demand in the commercial property market.
The market has also seen the re-emergence of a “tiered market” with different yield rates, impacting valuations.
Lessor interests for investment property, still represents a very safe form of investment.
(d) Subsidies and Grants
Grants and donations received for the Hawke’s Bay Museum & Art Gallery (rebranded as MTG) redevelopment
project were $0.5m above budget. The budget value (government grants and grants & donations) for this item was
$1.5m with the actual amount received $2.0m. This was the result of timing differences between the year in which
the grant was actually received and the year in which it was forecast to be received and not due to a change in the
total amount received. The Hawke’s Bay Museum & Art Gallery project is projected to cost $18.7 million in total.
The total projected cost includes additional earthquake strengthening of $0.5m. This was added to the project
budget and undertaken during the project in anticipation of changes to Building Act requirements following the
Christchurch earthquake, to ensure the building was future proofed regarding building strength requirements due
to concern for public safety.
2.1.2 Expenditure
Total operating expenditure is $2.8m below budget and $2.0m above 2011/12 actual outcome. Significant items
of variance are as follows:
(a) Other expenses
Other expenses are $3.0m below 2012/13 budget and $0.7m above 2011/12 year. The variances comprised:
Development for residential sections sold were $4.0m below 2012/13 budget and $2.1m below 2011/12.
The lower actual cost of sales compared to budget is a direct result of lower than budget sales for the
2012/13 year.
Page 7
Napier City Council Annual Report Summary 2012/13
Operating expenditure for the City Promotion group was $0.8m below budget, and $0.2m higher than
2011/12. This was due to lower than forecast activity, including total visitor arrivals and visitor nights
staying in commercial accommodation. Kennedy Park was below budget $0.2m. This was a result of lower
visitor nights for the year than budget and reflects items such as lower costs of casual staff, restaurant
costs and accommodation supplies. Due to the later than anticipated start date of the Art Deco Bus Service,
costs associated with this activity were 0.3m lower than budget for 2012/13. Revenue was also lower and
consequently did not improve overall surplus.
Roading operating costs were $2.4m higher than budget for 2012/13 and $1.7m above 2011/12. The
budget variance of $1.1m arose from the development of Pandora Roundabout, which has now vested to New
Zealand Transport Authority (NZTA) for ongoing maintenance as this roundabout is on a state highway. Note,
state highways are owned by NZTA. Depreciation was higher than budget $0.7m, refer 2.1.2 (b) Depreciation
below.
(b) Depreciation
Depreciation charges were $0.3m above budget for the year. The most significant variance at $0.7m above
budget, was roading depreciation due to the 2011/12 revaluation which increased asset values. Other budget
variances were immaterial amounts below budget.
2.1.3 Other Comprehensive Income
Valuation gains/losses taken to equity -$.4m reflects the non cash book adjustment that arose from changes in the
fair value of the assets revalued. This reflects the impairment on Memorial Square building which was assessed for
earthquake prone status and will require substantial modification to meet the Standard of building strengthening
that Council has set itself for public buildings -$.4m.
2.2. Statement of Financial Position
2.2.1 Current Assets
Significant variances in current assets are:
a. Debtors and other receivables were below budget by $3.4m. This variance was in part due to the lower than
anticipated Parkland sales and corresponding forecast receivables at year end.
b. The current asset portion of inventories are $0.3m above budget and $1.2 below the 2011/12 value. The
actual at 30 June budget variance reflects the work undertaken to prepare lots for the anticipated sales for
2013/14 year. This is calculated on the basis of more up to date forecast information.
c. The current portion of other financial assets consisted of cash on deposit, where the deposit is held for
greater than 3 months but less than 12 months, and local authority stock, which is due for repayment
within twelve months. Other financial assets under current assets needs to be read in conjunction with
other financial assets under non current assets and cashflow analysis, see note 2.4. The higher level of
current assets, that is above budget, reflects known cash requirements at 30 June. As in other commentary
regarding variances, a number of projects are in progress and cash will be required for these within twelve
months of balance date. Examples are the completion of the Museum project, and the Advanced Water
Treatment project.
2.2.2 Non-Current Assets
Significant variances in non-current assets are:
a. Property, plant and equipment was $40.5m below 2012/13 budget at year end. Significant variances
between property plant and equipment at 30 June 2013 and budget are outlined in the table below.
b. Investment properties – refer note 2.1.1c. Other Gains/Losses. Other variances arose from a lower than
forecast opening balance.
c. The non current portion of other financial assets consisted of unlisted shares and corporate bonds, where
payment is expected to be more than twelve months forward. The decrease of $6.0m between budget for
2012/13 and actual 2012/13 other financial assets arose from a higher value of other financial assets being
held in current rather than non current. Refer also 2.2.1c and 2.4 - cashflow.
Page 8
Napier City Council Annual Report Summary 2012/13

                                     Budget          Actual
 Item                                                          Variance $M                          Comment
                                 2012/13 $M     2012/13 $M

 2011/12 closing balance           1,274.87         1,239.75         35.1    2011/12 actual compared to budget forecast
 actual vs. budget                                                           value due to the timing of projects
 Depreciation (excluding               (20.8)         (21.1)          0.3    Higher depreciation 2012/13 see note 2.1.2a
 intangibles)
 Asset Disposals                            -          (1.5)          1.5    Disposals not budgeted
 Depreciation writeback after               -          (8.0)          8.0    No impact on income. Writeback of depreciation
 valuation                                                                   arising from revaluation

 Asset Addition Variances:

 Vested Assets                           2.4             1.0          1.4    No cash impact from this item – vested assets
                                                                             budgeted each year
 BTF Wastewater Plant                    6.0             1.6          4.4    Project in progress
 Stormwater Projects                     2.0             1.4          0.6    Project in Progress
 Hawkes Bay Museum                       8.8             5.8          3.0    Project in Progress
 CBD Development/Hastings St             1.4             0.9          0.5    Work to be completed in future years
 Development
 Sportsground irrigation and             1.6               -          1.6    Work to be completed in future years
 development
 Marine Parade development/              1.8             1.5          0.3    Project in progress
 landscaping/playground
 Infrastructure Renewals and             9.2             7.6          2.1    Projects in progress
 Minor Capital

2.2.3 Current Liabilities
Significant variances in Current Liabilities are:
a.      Creditors and other payables are $5.3m lower than anticipated in the 2012/13 budget and $1.8m below
        2011/12 actual. The budget variance is due to the timing of project expenditure such as the Waste Water
        treatment plant and Museum projects occurring beyond the financial year end. Timing differences have
        arisen due to budgets being set before detailed timelines were prepared.
2.2.4 Equity
Significant variances in equity are:
a.      Retained earnings are $6.8m below budget for the 2012/13 year due to the lower than anticipated surplus.
        Refer note 2.1.1 and 2.1.2.
b.      Other reserves are $11.5m above budget for the 2012/13 year - the restricted reserve for the Advanced
        Water Treatment Plant expenditure spent was lower than forecast. Budgets were developed in advance of
        the detailed work programme, consequently variances are timing differences only.

2.3.     Statement of Movements in Equity
Major variations in the statement of movements in equity are the below budget after tax surplus of $8.4m, the
transfers from revaluation reserve on disposal of property, plant and equipment of -$1.8m, offset by the higher
than planned revaluation reserves at June 2013 of $4.6m, and lower restricted reserve movements of $6.8m as
per 2.2.4 b.

2.4.     Cashflow
Total cash at year end was in line with budget. However, investments at year end were a lot higher than budget.
Net cash from operating activities was above budget by $4m arising from changes in the year end creditors
position refer 2.2.3 a, and above budget interest revenue. Net cash from investing activities was $10.2m above
budget. This was due to $15.4m lower than budget expenditure on property, plant and equipment.
All excess cash arising from operating and investing activities was invested in interest bearing deposits at year end.
Consequently the net variance between proceeds from withdrawals of investments and acquisition of investments
was $26.8m above 2012/13 forecast.

                                                                                                                    Page 9
Napier City Council Annual Report Summary 2012/13

Shared Services
The establishment of Hawke’s Bay Local Authority Shared Services, a Council Controlled organisation is now
complete. Listed below are the existing shared services within Hawke’s Bay. These shared services have been
achieved through the cooperation of Hawke’s Bay Regional Council (HBRC), Wairoa District Council (WDC), Hastings
District Council (HDC), Central Hawke’s Bay District Council (CHBDC). The shared services company is exploring
other opportunities that may exist for cooperation which may entail sharing of computer systems and staff.

Initiatives                                           HBRC        WDC          NCC         HDC        CHBDC
Community Services
Pettigrew Green Arena                                                           √            √
Sport Hawke's Bay                                       √           √           √            √           √
Shared Library Service                                                          √            √
Pathway Development                                     √                       √            √
Hawke's Bay Museum Trust                                                        √            √
Settlement Support Service                                                      √            √
Youth Transition Service                                                        √            √
Regional Cultural Archives                              √                       √            √
Road Safety Initiatives                                 √           √           √            √           √
Corporate Support
Joint Property Valuation Contract                       √           √           √            √           √
Joint Insurance and Energy Procurement                  √           √           √            √           √
Economic
Hawke's Bay Airport Ltd                                                         √            √
Business Hawke’s Bay                                    √           √           √            √           √
Tourism Hawke's Bay                                     √           √           √            √           √
Essential Infrastructure
Recreational Water Quality Monitoring                   √           √           √            √           √
Joint Recycling and Refuse Collection Contracts                                 √            √
Strategy and Planning
Omarunui Joint Landfill                                                         √            √
Stormwater Drainage                                     √                       √            √
Regional Transportation Strategy                        √           √           √            √           √
Heretaunga Plains Urban Growth                          √                       √            √
Napier / Hastings Joint District Plan                   √                       √            √
Solid Waste Management Plan                                                     √            √
Regional Community Outcomes                             √           √           √            √           √
Community Outcome Monitoring                            √           √           √            √           √
Regional Strategic Coordination Group                   √           √           √            √           √
Civil Defence Group                                     √           √           √            √           √
Policy Sharing                                          √           √           √            √           √
Joint Alcohol Strategy                                                          √            √
Joint Regulatory Training                                           √           √            √           √
Joint Regulatory Purchasing                                                     √            √
Local Alcohol Policy                                                            √            √

Page 10
Napier City Council Annual Report Summary 2012/13
Financial Overview
Rates increases
Napier City Council is a democratic institution and is the primary deliverer of services to the community for the
community and paid for by the community of Napier. Decisions are taken at all levels in the organisation with due
cognisance to this.
Since 2000/01 Napier City has surveyed Councils of similar size for a comparison of average residential rates. The
table of comparison for the last 2 years is shown on page 16 of this report and is compiled from returns direct
from each of the Council’s listed. While Napier has been below the average of this group since 2006/07, Napier’s
average residential rates are the lowest within the survey group for the last 2 years and are $518 per annum lower
than the highest Council.
There are many reasons for Napier’s City Council’s clear success in managing rates levels and debt. Choices and
decisions made in the management of the strategic direction of Council and in the organisation and focus of
Council’s operational arm have been on:
high quality outcomes
best total cost and
affordable for this community
This has been the underlying philosophy over successive Councils and as a result the cumulative effect of many
small decisions over many years has led to the benefits ratepayers now enjoy.
As noted above Napier City has one of the lowest dependencies on rates income in New Zealand’s Territorial Local
Authorities community. This results from well-defined and implemented funding policies which reduce dependency
on rates income. As a result of these funding policies some significant activities are cost neutral to the ratepayer
for example elements of solid waste, property, housing and inner harbour.
Other examples of why Napier rates are lower than others:
Funding:
Income generated by Tourism activities which support the cities Tourism businesses
Property related activities such as the Parklands residential section development project
Quality of operations is further enhanced through the retention of knowledge of infrastructure assets within
the organisation
Investment property income which supports the inner harbour and city foreshore reserves
Other allocations of cost recoveries between users and ratepayers via Council’s funding policies
Cost Control:
1. Lean overhead structure with minimal corporate overheads
2. Inhouse workforce*
3. Low turnover of core staff, Corporate culture and knowledge is retained within the organisation, communications
between and within activities is enhanced, cost of attracting new staff, cost of recruitment, cost of staff
training and induction are minimised
4. Council departments are sized for core work flows and activities only. Peak and seasonal workloads are
managed through employment of temporary or seasonal staff or by contracting out well defined work to
external organisations
5. Adoption of Cost Saving Technologies - Napier Council easily adopts ideas and technologies that are cost
effective for the ratepayer. A clear example of this being that 80% of Napier streetlights have been converted
to eco-fittings saving ratepayers several hundred thousand dollars per annum in reduced electricity charges.
6. Low cost stable organisation wide IT solutions (analysis has demonstrated that organisation wide changes of
IT infrastructure are both time consuming and expensive with forecast cost improvements often not delivered)
Page 11Napier City Council Annual Report Summary 2012/13
7. Stable base of buildings and building locations leading to lower cost of building occupation
8. Shared Services between the Hawke’s Bay local authorities
9. Selection of best cost options, for example the cost to build an urban road which lasts 50 years (with
appropriate maintenance) is 4 % above the cost to build urban road which lasts 25 years (this applies to the
local area with shingle sources)
10. Size of Territory advantages - Napier City is a compact land area and is the 4th most densely populated
Territorial Local Authority in New Zealand.
* Inhouse workforce comprises of:
Napier City Services Department
The Napier City Services Department is the principal provider of maintenance, horticultural, building trade
services and some civil construction services in a cost effective and sustainable manner. The department
undertakes mainly internal works which are demonstrably competitive and high quality.
Quality of operations is further enhanced through the retention of knowledge of assets within the organisation.
Napier City Design Services
Design Services provides design and technical services to other Council departments ensuring the community
receives engineering services of maximum quality and safety in a cost effective and sustainable manner.
The department undertakes internal works which are demonstrably competitive and high quality. Quality of
operations is further enhanced through the retention of knowledge of assets within the organisation.
Growth in rateable properties
The table below shows growth in the number of households in Napier City over the last 8 years and the average
growth since 1990. The growth of households in the last 3 years is significantly lower than the high rates
experienced during 2005 – 2007. The lower growth rate in households during this time reflects both New Zealand
household growth generally and the current economic environment.
Year Number of new properties Percentage growth per year
124
2012/13 0.50%
149
2011/12 0.60%
145
2010/11 0.60%
204
2009/10 0.80%
175
2008/09 0.70%
426
2007/08 1.80%
518
2006/07 2.20%
502
2005/06 2.20%
Average over last 23 years 222 1.01%
Residential growth in Napier totalled has been more than 5,000 properties during the last 23 years, an increase of
26% between 1990 and 2013.
Growth creates demand for water, wastewater, stormwater services, roads, recreation reserves, sports grounds
and community services such as libraries.
Financial and Development Contributions
Financial and development contributions are used to fund growth related projects. These projects are required
to ensure city infrastructure is able to meet demand for services from a growing number of households and
businesses.
In the case of greenfields developments developers construct and pay for the roads, underground services and
recreation reserves on their developments (known as on site services). These services are then vested to Council
(vested assets). After these assets are vested to Council, it becomes the responsibility of Council, on behalf of
ratepayers, to provide for the maintenance and renewal of these assets. For both greenfields development and
city infill, new properties created as a result of subdivision, contribute through financial contributions to the
cost of providing network infrastructure to service developments. Council installs and maintains the additional
infrastructure and services.
The Council also constructs the infrastructure that is needed to support residential and commercial developments
(referred to as off site non local services). For example, new wells and reservoirs are needed to supply water, trunk
sewers and pump stations to take wastewater away, stormwater pump stations and drains to deal with stormwater,
Page 12Napier City Council Annual Report Summary 2012/13
road widening and intersection improvements to provide capacity for the increased traffic that is generated on the
wider roading network, and additional sports grounds, recreation reserves and library books are also needed to
ensure that people will continue to enjoy the same level of service after growth as before.
The Council recovers the cost of off site non local services from developers through charges known as financial
contributions and development contributions. These charges are designed to provide sufficient funds to construct
the off site non local services that are required to service developments. The cost of off site non local services are
often recovered from multiple developments, for example, one well can produce enough water for several medium
sized developments. If these costs were not recovered at the time of development the community would need to
choose between funding the off site non local services through increased rates, or accept a continuing reduction in
the level of service in these areas until it becomes unavoidable to invest significantly in the service. Management
of growth projects through this mechanism also facilitates Council to undertake infrastructure projects in the most
cost effective way.
It is again important to note that maintenance and operation costs of the increased infrastructure are funded
from rates, not from financial and development contributions. The rationale is that new developments should
meet the cost for the infrastructure that is needed to support it, but the operation and maintenance costs of that
infrastructure is funded from the rates collected, which the new properties contribute to.
The community, through rates revenue, contributes around 20% of the cost of growth related projects by direct
contribution to the financial contributions fund. The balance is met, as noted above, through direct charges to
developers. All offsite non-local charges are added to the financial contributions fund. The combined ratepayer and
developer funds form the total fund from which growth projects are funded. Ratepayers also fund, over and above
the 20% contribution to the financial contribution fund, any content of a project which is directly attributable to the
existing ratepayers. The existing ratepayers benefit may be through improved service levels or asset replacements
occurring as a result of a growth related project. Most growth projects have a component funded from financial
contributions and a component funded directly from rates. This is further explored below.
There has been significant discussion around the cost of financial and development contributions over recent
months in regard to the extent to which these costs affect housing affordability. Governments intention to ‘rein in’
development contributions was outlined in the 15 August release on beehive.govt.nz. The release advises of the
government intention to restrict what Councils can charge for development contributions to both residential and
commercial development.
Recent related media coverage and press releases may give the impression that Council can charge any amount
it perceives it can achieve in this area. However this differs from the approach taken which is in accordance with
legislative requirements. Napier City Council sets the level of contribution to any development based on modelling
by qualified professionals of the increased infrastructure required for a specific development. For example, some
developments, based on location, may require a greater capacity in stormwater due to the topography of the land
to be developed or may require increased sewer capacity due to increased industrial effluent output. In addition
it is only the costs directly attributable to growth that are included in fee setting for financial and development
contributions. Many projects can also improve the level of service to existing ratepayers or replace existing assets.
The costs of these components of projects is attributed to existing ratepayers. The split of projects between
existing ratepayers and new ratepayers i.e. ‘growth’ is laid out in the Capital Plan. This is published for public
consultation annually in the Annual Plan of Council or in the Ten Year Plan every three years. The Capital Plan
identifies the split of each project, where there is a split, between growth, levels of service changes and renewals.
Analysis of the 2013/14 Capital Plan and carry forward projects from the 2012/13 year shows that of $113 million
of growth related projects over the next 9 years, around 50% of the project costs are considered to be directly
attributable to growth (of which existing ratepayers contribute 20% of the cost) and the remainder is attributed to
existing ratepayers.
Proposals for changes to financial and development contributions are a significant issue for Napier City ratepayers.
Core to Councils funding policy is the attribution of costs to groups of ratepayers. This is based on exacerbator
pays (broadly defined as user pays) and the current policy in regard to growth related projects flows directly from
this core principle. A removal of, or change to the extent of financial and development contributions chargeable
will likely shift the liability for growth projects to existing ratepayers either through increased rates or significant
increases in debt. Non-targeted rates increases as a result of these proposals could be up to 20%. Any rates
increases arising from changes to the charging of financial and development contributions would severely impact
the ability of Napier City Council to maintain its ten year plan commitments of holding rates increases at or below
CPI.
As noted above, due to lower economic activity New Zealand wide, city growth has been lower than average over
the last 3 years. This has meant that financial and development contributions revenue is lower than forecast
over the same period. As a result of this lower growth the timing of proposed growth related projects has been
reviewed and will continue to be reviewed in future years. Timing of these projects is dependent on actual growth
in the number of households being serviced and forecast to be serviced. Timing of projects is also dependent on
the availability of funding from the sources identified in the plan. Funding is in place, at the end of 2012/13 for
the identified growth related projects outlined in the 2013/14 Annual Plan. as a result these projects have the
necessary funding to proceed. It is also anticipated that growth in households will rise back to or above forecast
levels as the New Zealand economy improves and drive the necessity for the planned growth projects.
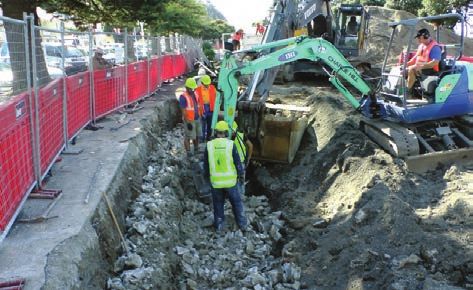
Page 13Napier City Council Annual Report Summary 2012/13 Infrastructure Asset Renewals - Core Infrastructure The Napier City Council is acutely aware that the provision of essential infrastructure which meets the needs of its citizens is core to the economic, social and cultural needs of the city. The figures below demonstrate the value Napier has invested in its essential assets. Provision and maintenance of infrastructure is a critical deliverable of all local councils and this requirement is laid out in the amended purposes of the Local Government Act (as amended in 2012). The citizens of Napier City have invested $1,244.7m for infrastructure and city assets over successive generations. Significant components of this are: Roading Network $575.2m Sewer Management $130.4m Water Supply Systems $65.8m Stormwater $104.8m Sportsgrounds and Reserves $194.3m How are these assets managed? Napier City has detailed asset management plans, which identify and define Current levels of service provided Probable future demand for these services and Planned improvements The Asset Management Plans are the culmination of extensive work undertaken to understand the whole life cycle of Council’s infrastructure assets over many years. The asset management plans are supported by a detailed inventory of the city’s infrastructure assets. This includes the age of the assets and is also supported by condition assessments undertaken periodically. Having the asset management plans in place, with future demand projections, ensures that projects are undertaken with environmental prediction impacts, renewals and projected future demand included in the planning. A key example of this approach is the cross country drain project. This put in place infrastructure that was more than 20 years in planning and implementation and provides stormwater infrastructure which incorporates increased capacity to mitigate the effects of increased rainfall (climate change) renewal of existing stormwater system components provision of increased stormwater capacity for growth of the city How does the City know that renewals are adequate? Council looks at a number of measures to obtain confidence that assets are being renewed appropriately and meeting the demands of the city. The key measures from a user perspective are detailed in the performance measures and targets and customer perception measures (based on the annual NRB survey) reported on in the Annual Plan and Annual Report processes. The vast majority of citizens are very satisfied or satisfied with the level of service provided in terms of core infrastructure. Napier City also has a long history of meeting or exceeding the performance targets set. In addition to the customer satisfaction measures Council also monitors both routine maintenance and reactive maintenance. Above planned expenditures on reactive maintenance will suggest that there are infrastructural renewal issues that need addressing. If this arises, funds are immediately available to meet the costs of any indicated renewals without additional impact on rates (see funding below). Balancing operating and capital costs of infrastructure renewals has proven to be a very cost effective strategy for Napier City. Council also undertakes testing of below ground assets to check the current state on a statistical sampling basis and also monitors water losses from the network as an indication of network issues for water assets. An added assurance to Napier citizens can be gained from the report produced by the Local Government Infrastructure Efficiency Expert Advisory Group (EAG) in March 2013. Napier’s capital and renewal expenditure compares very favourably with the national averages contained in the report. Renewals Funding Napier City Council has been funding its core infrastructure renewals program since 1998 and as a result has robust funding programs in place. Prior to 1998 renewals were funded on an as required basis. This method was prone to funding peaks and troughs; consequently a move to annualised values, based on a whole of life model of asset networks, was commenced in 1998. Napier City annually sets aside 65 - 70% of rate funded capital plan to meet the cost of core infrastructure renewals. Funds are set aside, in advance of requirements, based on the annualised projected cost of renewals over the Page 14
Napier City Council Annual Report Summary 2012/13

expected life of the assets (excludes Road renewals – see below). Costs of assets ‘used up’ in any one year can
be attributed on a linear basis. However renewals do not follow the same linear pattern. As a simple example, an
asset with a life of 100 years will most likely be replaced at the end of 100 years not by 1% per annum, however
the community effectively has used 1% of the item during a single year.
Consequently, Council annually moves any unspent renewals funds (difference between plan allocation and actual
costs) to the Infrastructure Asset Renewal Reserve to ensure that these funds are used for the purposes intended.
Napier City Council at 30 June 2013 has over $19 Million in infrastructure asset renewal reserves for water,
stormwater, sewer, public toilets, sports grounds, cemeteries, reserves, solid waste and pools renewals. Interest
earned on the balance of funds held in this reserve is also paid into the reserve to ensure funds collected for this
purpose are not diminished as a result of inflation.
Road renewals not funded through the renewals reserve. These are funded annually from a combination of rates
and Transit New Zealand subsidies. Road assets are not subject to the variation between years that affects other
core infrastructure. Consequently renewal work is undertaken at a consistent level annually to maintain the current
standard. The major multi-year renewal project concluded during the last 3 years was the renewal and upgrade of
Taradale roads. Note: life assumptions regarding base lasting 50 years, see page 9.

              Renewals - Infrastructure                                   Infrastructure Renewals Funds held
               Actual 2012/13 $000's                                             at 30 June 2013 $000's
                                                                                           $182    $946   $85
                                                                                                                  $2,485
                                   $440                                           $1,537
                                                                          $432
                                                 $1,320

                                                                                                                                   $6,028
                                                          $297

                                                                         $7,341
   $5,008

                                                                 Water Supply Pipes   Stormwater           Sewerage        Public Toilets
            Water Supply   Sewer   Stormwater   Roading          Sportgrounds         Cemeteries           Reserves        Pools

                                                                                                                                   Page 15
Napier City Council Annual Report Summary 2012/13
Statement of Comprehensive Income
This section provides an overview of the Council’s financial results for the year ended 30 June 2013. For detailed
information please refer to the following sections in this Annual Report: Part 2 - Financial Statements and Part 3 -
Activity Statements.
Actual Budget Actual
2013 2013 2012
$000 $000 $000
Income
Rates revenue 45,938 45,466 44,840
Finance income 3,491 1,657 3,219
Development and financial contributions 1,616 1,789 2,192
Subsidies and grants 7,782 7,238 9,651
Other revenue 31,472 39,620 36,006
Other gains/(losses) (4,400) 1,374 (1,103)
Total income 85,899 97,144 94,805
Expenditure
Employee benefit expenses 25,429 25,513 24,847
Depreciation and amortisation 21,099 20,835 20,228
Other expenses 31,570 34,515 30,909
Finance costs 255 278 289
Total expenditure 78,353 81,141 76,273
Operating surplus/(deficit) before tax 7,546 16,003 18,542
Share of associate surplus/(deficit) 291 213 212
Surplus/(deficit) before tax 7,837 16,216 18,744
Income tax expense - - -
Surplus/(deficit) after tax 7,837 16,216 18,744
Other comprehensive income
Valuation gains/(losses) taken to equity (392) - 8,176
Fair value gains/(losses) through comprehensive income on
(20) - 7
investments
Total comprehensive income 7,425 16,216 26,927
Page 16Napier City Council Annual Report Summary 2012/13
Council Income 2012/13
The main sources of Council’s income are shown in the diagram below.
Targeted Rates, $13.2m
Subsidies and Grants, $8.2m
Other Income, $7.2m User Charges and Service
Delivery, $22.8m
Non Targeted Rates, $32.8m Vested Assets, $1.0m
Financial and Development
Contributions, $1.6m
As shown in the pie diagram above 53% of funding for Council activities was derived from the rates levied on
commercial and residential properties within the Napier City boundaries. This varies from 2011/12 year actual
result and the 2012/13 budget which both showed 47% of income being derived from rates. The significant
decrease in income arose from the lower than budget sales of residential sections in the Parklands development.
Section sales and the resulting vested assets were $6.9m below budget. This impacted other revenue against both
budget and comparisons to 2011/12 year.
CPI is a measure of the changes in the price level of consumer goods and services purchased by households.
However, cost changes which significantly impact Council, particularly in the area of capital expenditure are
Income Expenditure Operating Surplus
$120m
$120m $120m
$100m
$100m $100m
$80m
$80m $80m
$60m
$60m $60m
$40m
$40m $40m
$20m
$20m $20m
$0m $0m $0m
08/09 09/10 10/11 11/12 12/13 08/09 09/10 10/11 11/12 12/13 08/09 09/10 10/11 11/12 12/13
Budget Actual Budget Actual Budget Actual
Page 17Napier City Council Annual Report Summary 2012/13
reflected in other indices such as the Capital Goods Price Index (CGPI), the Producers Price Index (PPI) and Labour
Cost Index (LCI). CGPI and PPI indices move differently to CPI. This is due to the components within the indices.
Items such as electricity, gas, oil and oil products, concrete and iron/steel are significant components within CGPI
and PPI whereas food and housing costs are significant components within CPI. Due to the different components
of these measures significant variances arise between CPI and PPI and CGPI. PPI and CGPI have, on average, been
well above CPI over recent years. This has meant that pressures on Council expenditure from price increases
has been above that measured by CPI. Council is very aware of this issue and has addressed cost increases with
a multipronged approach to ensure rates increases are kept close to CPI to ensure community affordability.
Council’s approach has focussed on tight control of costs, competitive purchasing processes, a focus on core
infrastructure within the capital plan and adding new services only when costs for these can be met from within
existing budgets
A table of the last 7 years of rates increases, compared to Consumers Price Index (CPI) is shown below, along with
a graph of the net rates received and cumulative CPI to cumulative rates increases over the same period. The key
trend displayed is the very close alignment between rates increases and changes in CPI for the city.
Net Increase of Rating Revenue 7 Year Trend
2006/07 2007/08 2008/09 2009/10 2010/11 2011/12 2012/13
$000 $000 $000 $000 $000 $000 $000
Rating revenue 38,333 39,708 41,724 42,898 43,799 44,840 45,938
Penalties and remissions (175) (100) (17) 69 74 71 84
Net rates revenue 38,158 39,608 41,707 42,967 43,873 44,911 46,022
$ $ $ $ $ $ $
Rates per rateable property
1,651 1,676 1,733 1,773 1,795 1,827 1,861
(average)
Rates % increase per annum
3.6% 1.5% 3.4% 2.3% 1.2% 1.8% 1.9%
per rateable property
CPI at 30 June* 2.0% 4.0% 1.9% 1.7% 3.3% 1.0% 0.7%
Net increase (under)/over CPI
1.6% -2.5% 1.5% 0.6% -2.1% 0.8% 1.2%
per rateable property*
*Note: CPI quoted is the value at the end of the year reported i.e. for 2012/13 year is as at 30 June 2013. The
2010/11 CPI excludes the impact of the change of GST rate from 12.5% to 15%. CPI used for Annual Plan purposes
is the reported value as at 30 June for the year prior to the Annual Plan (i.e. for 2012/13 year the base rate of CPI
for Plan purposes was the rate at 30 June 2011). The Annual Plan is used for setting rates levels for the community.
Page 18Napier City Council Annual Report Summary 2012/13
7 Year Trend of Cumulative Rate Increases $ and Cumulative Rate Change % to
Cumulative CPI % Change
50000
24%
45000
22%
20% 40000
18% 35000
16% 30000
14% 25000
12%
20000
10%
15000
8%
10000
6%
4% 5000
2% 0
2006/07 2007/08 2008/09 2009/10 2010/11 2011/12 2012/13
Cumulative Rates % increase per annum per rateable property Cumulative CPI at 30 June Net Rates Revenue
Average Residential Rates
1,687
Napier
1,637
1,790
Invercargill
1,653
1,828
Hamilton
1,775
1,848
Whangarei
1,756
1,878
Hastings
1,825
1,967
Rotorua
1,928
2,012
Palmerston North
1,903
2,031
Timaru
1895
2,041
Wanganui
1,912
2,348
Tauranga
2,155
1,943
AVERAGE
1,844
2012/13 2011/12
Page 19Napier City Council Annual Report Summary 2012/13
Council Operating Expenditure 2012/13
Water Supply, $4.0m
Sewerage, $6.5m
Recreation, $10.4m
Stormwater, $3.3m
Solid Waste, $4.9m Social and Cultural, $12.8m
Roading, $16.5m
City Promotion, $9.1m
Democracy and Planning and Regulatory,
Governance, $1.8m Property Assets, $4.3m $5.6m
Details of income, operating and capital expenditure for each of the activity groups above are detailed in Part 3 -
Activity Groups of this Annual Report. In addition explanations of significant variances are contained in Note 2 of
the financial statements.
The following graphs show the trend of revenue, expenditure and net surplus over the last five years. The 2008/09
result reflects year 1 of the international financial crisis.
The 2012/13 operating surplus is significantly below 2011/12 due to below budget sales for Parklands Residential
Development. The lower sales were offset by lower expenditure with a net income below budget $1.9m and vested
assets to Council from Parklands $1.0m below budget. In addition other gains and losses were below budget
$5.8m. The most significant component of below budget gains and losses was the revaluation of Napier City
Council investment properties with a -$3.6m revaluation loss against a budget gain of $1.4m
Borrowing
The Council manages its finances prudently and in a way that supports both the current and the future generations
within the community. Council prepares and consults on a Ten Year Plan every three years. The budget for
the 2012/13 year was year one in the Ten Year Plan 2012/13 - 2021/22 which was adopted on 26 June 2012.
Comparatives to this budget are shown in the financial statements
Capital expenditure for the next 10 years, the funding sources for this expenditure and the borrowing levels for
the next 10 years were reviewed and updated in the 2012/13 - 2021/22 Ten Year Plan. The Plan forecast that
Napier City Council external borrowing would be extinguished during the 2014/15 year. The 2012/13 year results
have not changed this projection. Council is on track to extinguish all external debt in the 2014/15 year.
Actual 2012/13 results have also not materially altered the forecast maximum borrowing levels. However timing
of maximum borrowing will vary to the years indicated in the plan. Variations will be to the extent of changes of
timing of loan funded projects
Page 20Napier City Council Annual Report Summary 2012/13
The table below shows the Council’s level of secured loans, i.e. loans where an entity external to Council have lent
money to Council.
Actual Budget Actual
2013 2013 2012
$000 $000 $000
Current secured loans 2,008 2,008 2,008
Non-current secured loans 13 12 2,020
Total secured loans 2,021 2,020 4,028
In recent years Council has also funded capital projects from cash, held by Council, that is excess to Council’s
short-term requirements. Funding of capital projects by this method is termed ‘internal loan funding’. Internal
loans are used, where possible, for loan funded projects as the net cost of internal loans results in a lower cost
arrangement to the benefit of Council. Internal loans are funded from cash sourced from a mixture of equity and
special funds and enable effective use of funds held while also ensuring activities with loan funding are not cross
subsidised by other activities. This method of loan cost allocation between activities supports the integrity of
Council’s funding policies. The table below displays the gross debt of Council over the last 5 years. However, it
is important to note that if Council had funded all loan funded projects through external debt, Council would also
have shown an equivalent increase in the level of cash or cash and investments in Council’s statement of financial
position.
Debt Levels Internal and External 2008/09 2009/10 2010/11 2011/12 2012/13
$000 $000 $000 $000 $000
External debt (excluding Finance Leases) 7,055 6,044 4,036 4,028 2,021
Internal debt 31,754 34,233 34,489 32,749 35,261
38,809 40,277 38,525 36,777 37,282
In addition to existing loans, Council has approved loan funded capital projects in 2012/13 capital plan and
prior years capital plans of $22.6m. These projects are either in progress at present or will be commenced and
completed in future years. Significant projects which are partly funded by loans, and included in the $22.6m are
the Advanced Wastewater Treatment (AWWT) project $3m (user funded industrial effluent treatment), Hawke’s
Bay Museum and Art Gallery redevelopment $3.1m, AWWT project $2.6m (previously sludge treatment but now
incorporated into the AWWT project), Whakariri Groyne and Westshore Beach Reprofiling $3.3m, Prebensen Drive
projects $3.4m and Park Island Bond Field extension $1.8m. Of particular note is the AWWT project. A previously
planned $7.0m of rate funded loans was cancelled during the 2012 - 2013 Ten Year Plan process. Additionally, the
Advanced Waste Water Levy ceased in the 2013/14 year.
Under Council’s Liability Management Policy, Council is able to borrow to fund projects which will benefit several
generations of residents or when a project is a ‘one-off’ or to fund Council’s balance sheet . However, the risk to
both current and future generations of uncontrolled borrowing is significant, so Council, within its policy, manages
these risks within specific borrowing limits. Performance against these limits is measured annually as a part of
year end reporting. The performance against these limits at the end of 2012/13 financial year and over the 4
preceding years is shown in the tables below.
Page 21Napier City Council Annual Report Summary 2012/13
Debt Servicing
Proportion of Rates Revenue applied to Service Debt (External and Internal Debt)
2008/09 2009/10 2010/11 2011/12 2012/13
$000 $000 $000 $000 $000
Debt Servicing Proportion - actual 10.3% 9.2% 8.9% 8.3% 7.5%
Policy limit: 16% 16% 16% 16% 16%
Rate Funded Debt per Capita
Net Rate-funded Debt per Capita (External & Internal Debt)
2008/09 2009/10 2010/11 2011/12 2012/13
$000 $000 $000 $000 $000
Rate Funded Debt per Capita - actual $536 $530 $485 $459 $480
Policy limit: $1,000 $1,000 $1,000 $1,000 $1,000
Debt / Income
Net Debt as a % of total income (External & Internal Debt)
2008/09 2009/10 2010/11 2011/12 2012/13
$000 $000 $000 $000 $000
Net Debt % of Total Income - actual 50% 44% 44% 37% 42%
Policy limit: 100% 100% 100% 100% 100%
Liquidity
Liquidity to peak 12 month Net Debt
2008/09 2009/10 2010/11 2011/12 2012/13
$000 $000 $000 $000 $000
Liquidity % - actual 206% 328% 385% 724% 630%
Policy minimum: 110% 110% 110% 110% 110%
Cash Flows
This table summarises the movement of cash for the last 5 years. The net cash inflow/(outflow) for the year shows
the net change in cash and bank balances from operating, investing and financing activities.
Debt Levels Internal and External 2008/09 2009/10 2010/11 2011/12 2012/13
$000 $000 $000 $000 $000
Net cash flows from or used in operating activities 30,196 40,936 31,899 37,069 34,624
Net cash flows from or used in investing activities (23,300) (40,200) (28,190) (39,666) (29,224)
Net cash flows from or used in financing activities (4,559) (1,023) (2,010) (8) (2,008)
Net cash inflow/(outflow) for the period 2,337 (287) 1,699 (2,605) 3,392
Net cash from or used in operating activities is the net of receipts from rates, interest and other revenue received,
payments to suppliers, employees and interest paid.
Net cash from or used in investing activities includes purchase and sale of property plant and equipment and
intangibles and acquisition and withdrawal of investments.
Net cash from or used in financing activities is the net change in external loan and lease liabilities for the year.
Net cash inflow/(outflow) for the period is the net change in cash and cash equivalents for the year.
Page 22Napier City Council Annual Report Summary 2012/13
Activity Summary
Democracy and Governance
Through Democracy and Governance, Council provides a democratic and consultative system for decision making.
Key Issues
Preparation for the next Council election to be held in October 2013 is under way. The review of representation
arrangements resulted in no change to the structure of representation; being 6 members elected from four wards
and 6 members elected at large plus the mayor.
Performance Measures
75% of residents satisfied with Sufficiency of Public Information Supplied in the NRB Public Opinion Survey (target
75%).
Roading
The City’s road network provides accessibility to Napier’s residents and visitors within a safe, clean and aesthetic
environment.
Key Issues
Roading Projects
Key works for 2012/13:
Roading I.A.R. – ongoing works with unspent budget carried forward.
Roading Capital Projects (Bulk Funded):
Ongoing projects throughout the City. Work during 2012/13 included the completion of the Puketapu Road
reconstruction, Hill Road, and North Terrace.
Transportation Proposals: Long term budget provision to cater for growth of the City. No physical work carried
out this year, however advanced land purchase has been undertaken to facilitate future works.
Prebensen Drive Four Laning: Council’s share of the funding for this has been carried forward from past plans.
The New Zealand Transport Agency (NZTA) has not as yet approved the subsidy for this project.
West Quay Humber St and Pandora Rd roundabout: The upgrading of this intersection to a roundabout control
has greatly reduced the congestion and number of crashes that were occurring.
CBD Upgrade: The first stage of the Hastings St upgrade from Vautier St to Albion Lane has been completed.
Further stages have been put on hold pending the completion of the building reconstruction and strengthening
works currently being carried out by many building owners / developers.
Herschell Street was also upgraded reflecting its position as part of the “heritage quarter” of the city.
Cycleway Projects: Water Trail Pathway joining Ahuriri and Bay View was completed. Plantation Drain cycleway
completed, the first stage of the Taipo Stream pathway was completed and various short sections of path to
provide improved connectivity with the overall cycling network have also been completed.
Reduced NZTA Funding
As a result of the Government’s revised targets for the Land Transport Programme, subsidy levels for maintenance
and renewal works for the three years from 2011/12 to 2013/14 were reduced in line with previous years. The
Council has carefully reprioritised its works programmes, particularly between renewal and maintenance, to
minimise any adverse affect of this shortfall in funding.
Increase in Mass and Dimensions for Trucks
Council has been working with NZTA and their consultants to monitor the effects of the increased mass and
dimension of higher productivity trucks on parts of the network. Initial indications are that the effect on straight
sections of road is likely to be minimal (less than 5% increase in maintenance and renewal) largely because the
increased tonnage per vehicle is expected to result in fewer vehicles on the road and the weight is generally
spread over more axles. The effects on high stress areas however, (intersections and tight bends) could be more
pronounced because of the additional shear forces generated by the additional axle loadings.
Page 23You can also read