National Road Safety Strategy 2011-2020 - Submission in response to Consultation Draft February 2011 - Public Transport ...
←
→
Page content transcription
If your browser does not render page correctly, please read the page content below
National Road Safety Strategy
2011-2020
Submission in response to Consultation Draft
February 2011
© Public Transport Users Association 2011
247 Flinders Lane
MELBOURNE VIC 3000
www.ptua.org.au
Org. no. A0006256L
ABN 83 801 487 611
Contents

1     Introduction ..............................................................................................................................1

2     Risk Identification and Analysis..........................................................................................4

    2.1       The challenge................................................................................................................................. 4
    2.2       Major causes of road trauma ....................................................................................................... 4
      2.2.1       Enabling more evidence‐based policy .........................................................................................................5

3     Getting to the root of the problem .......................................................................................6

    3.1       Avoidance of the risk ................................................................................................................... 6
      3.1.1       Modeshift to public transport.....................................................................................................................6
      3.1.2       Safe streets................................................................................................................................................10
      3.1.3       Freight transport ......................................................................................................................................11
      3.1.4       Transport investment appraisal ...............................................................................................................12
    3.2       Removing risk source ................................................................................................................. 12
      3.2.1       Dangerous driving ...................................................................................................................................12
    3.3       Changing likelihood ................................................................................................................... 15
      3.3.1       Driver training.........................................................................................................................................15
      3.3.2       Bike education...........................................................................................................................................16
      3.3.3       Catering for active transport ....................................................................................................................16
      3.3.4       Safer roads ................................................................................................................................................18
    3.4       Changing consequences............................................................................................................. 19
      3.4.1       Safer cars ..................................................................................................................................................19
      3.4.2       Safe speeds ................................................................................................................................................21
      3.4.3       Fostering responsible behaviour ...............................................................................................................23
    3.5       Sharing risk .................................................................................................................................. 23
      3.5.1       Insurance..................................................................................................................................................23
    3.6       Retaining risk by informed decision ........................................................................................ 24
      3.6.1       Awareness raising ....................................................................................................................................24

4     Summary of recommended actions....................................................................................25

5     References ...............................................................................................................................27
1 Introduction
The Public Transport Users Association (PTUA) is committed to a safe transport system and
welcomes the opportunity to contribute to the National Road Safety Strategy 2011‐2020. Public
transport is typically safer than private transport (see section 3.1.1), hence modeshift from private
cars to public transport is a logical component of a ʹsafe systemʹ and must be a key tool in reducing
the road toll. Such modeshift should be a central objective of transport policy at Commonwealth,
state and local government levels.
Active transport (i.e. walking and cycling) is also an integral component of most public transport
journeys, such as riding from home to the railway station or walking from the bus stop to the
workplace. Active transport must not only be made safe, but also made appealing to fully realise
the potential of public transport in reducing road trauma, congestion and pollution. Along with
the enforcement of safe behaviour by all road users, greater priority and provision for pedestrians
and cyclists in the built environment will be needed to reduce their over‐representation in road
trauma statistics.
As well as desirable, significant modeshift from private cars to public and active transport is
eminently achievable. Less space is required for active and public transport journeys than is taken
up by car journeys, allowing modeshift to be easily accommodated within the equivalent of the
current transport infrastructure footprint (see Figure 1.1).
Figure 1.1: Road space requirements per person by mode of transport
Road space per person (square metres)
140
120
100
80
60
40
20
0
Car Bus Bicycle Rail Pedestrian
Source: Teufel 1989
Together with active transport, public transport infrastructure also carries the majority of journeys
into the busiest parts of our largest cities, demonstrating substantial people‐moving capacity (see
Figure 1.2). This capacity is often under‐utilised off‐peak when the majority of road fatalities
occur ‐ and even during peak times for counter‐peak journeys ‐ providing substantial scope for
patronage growth if service levels and integration are improved.
Public Transport Users Association 1Without action to increase public transport and rail freight modeshare, any road safety strategy
will fall short of a genuinely safe system approach.
Figure 1.2: Method of Journey to Work by Place of Employment in 2006 (Statistical Local Area)
Active Active
transport transport
Private Private
motor motor
vehicle vehicle
Public Public
transport transport
a) Brisbane – Inner b) Melbourne - Inner
Private Active
motor transport
vehicle
Public
transport
c) Sydney- Inner
The road safety agenda in Australia is also muted by the commercial and political clout of the car
lobby. This is reflected principally in softly‐softly enforcement measures and weak provisions in
car design that relate to road user safety. 1,895 persons died on Victorian roads alone in the six
year period 2005‐2010. It is difficult to imagine such an outcome being tolerated in other areas of
activity where an effective public policy response is required.
If federal state and territory governments exhibited even a modicum of the fortitude required to
reduce Australiaʹs poor road trauma record substantial inroads would be made immediately. The
costs in human misery and monetary terms currently on display each year would be reduced
accordingly.
The motor car is heavily advertised as a fashion item and one that purportedly achieves significant
individual goals. However, under current circumstances being on a road is about the riskiest thing
that most people in Australia do on a daily basis. Regretfully, this is not reflected in countervailing
messages and program activity by the agencies responsible for road safety to the degree necessary
to reduce the current unsatisfactory level of road trauma.
Public Transport Users Association 2It is likely that the popular media and vehicle sales promotion of car driving in Australia as a highly individualistic and competitive activity has negative effects for road safety. The reality is for the most part drivers use shared road space which, for its optimum use and the maximisation of user benefits, calls for a high degree of co‐operative behaviour. However, there is too little evidence that a co‐operative ethos amongst road users, and especially drivers, is promoted by Australian road safety agencies. There is also insufficient official attention paid to the deleterious safety effects of high powered vehicles and the subliminal industry‐ generated messages which encourage fast and reckless driving. This is notwithstanding the presence of a voluntary industry advertising code which purports to eschew the promotion of unsafe products and unsafe road user behaviour. Public Transport Users Association 3
2 Risk Identification and Analysis

2.1 The challenge
About 1,500 people are killed and over 30,000 are hospitalised each year due to crashes on
Australian roads (Henley & Harrison 2009). Many of these injuries leave life‐long physical and
mental scars such as spinal cord injuries or other permanent impairments. The social costs of
these crashes ‐ including medical costs, lost productivity, pain and suffering ‐ are estimated to
total about $18 billion per annum, including $4 billion for fatal crashes, $10 billion for non‐fatal
crashes and $4 billion of property damage (BITRE 2009a).

Although the scale of this carnage is still too large, many lives have been saved over the years
through measures such as the introduction of mandatory seat belt rules and other vehicle safety
standards, heavy vehicle speed limiters, enforcement measures including random breath testing
and use of speed cameras.

Recent tragedies on the road highlight the need for a tougher approach to road safety. High‐risk
behaviour continues to put lives at risk and impose high human and financial costs on those left
behind. Motor vehicle travel remains one of the riskiest activities undertaken on a daily basis,
with vehicle crashes the leading cause of death among 15‐24 year olds in Australia (ABS 2010).

2.2 Major causes of road trauma
Driver behaviour remains a key cause of road trauma in Australia, with many crashes being at
least partly the fault of people who simply should not have been behind the wheel. In the region
of 30 per cent of drivers killed on Victoriaʹs roads each year are over the legal blood alcohol limit
(ATC 2010, p.8). About 20 per cent of fatal crashes involve driver fatigue. Many recent tragedies
have also been blamed on excessive speed or dangerous driving (AAP 2010a; AAP 2010b;
Drummond 2010). This culture of dangerous driving must be a prime target of any serious
attempt to cut the road toll.

Crashes at intersections are also a significant cause of road trauma (ATC 2010, p.7), highlighting
the importance of compliance with traffic signals. The rising number of crashes at major outer
metropolitan intersections indicates that these should be a priority for enforcement activity.

Although secondary to driver behaviour, there are also opportunities to provide wider margin for
error on roads. The absence of road shoulders or edge linemarking are contributing factors in
many rural crashes where the driver loses control after one or more wheels stray from the sealed
road surface (Baldock et al 2008). Poor lanemarking can also be a factor in head‐on crashes.

Public Transport Users Association                                                                     4
2.2.1 Enabling more evidence-based policy
Eleven OECD countries have road fatality rates lower than in Australia and there is significant
disparity between Australian states and territories (ATC 2010, p.2). It is accepted that
benchmarking or other comparisons can never be perfect but it is likely that there are lessons to be
learned from understanding how other countries have reduced fatality rates faster than Australia
in recent years.

2.2.1.1 Recommendation
It is recommended that international and inter‐state and territory comparisons are made in an
attempt to understand what good practices can be adopted in Australia.

Public Transport Users Association                                                                5
3 Getting to the root of the problem
Road transport is inherently risky, so best‐practice risk management concepts can be used to
ensure the most effective safety measures are identified and taken.

The international standard for risk management (ISO 31000) outlines a methodology for risk
treatment. This paper discusses how this methodology could be applied to the National Road
Safety Strategy 2011‐2020 and to road safety more generally.

3.1 Avoidance of the risk

3.1.1 Modeshift to public transport
The surest way to minimise a risk is to avoid exposure to the risk. For good reason, the National
Road Safety Strategy 2001‐2010 includes the encouragement of alternatives to motor vehicle use as a
strategic objective. Public transport is many times safer than private transport, and traffic fatality
rates tend to be much lower in countries where public transport is used for a large share of
journeys (Litman 2010e, pp.5‐9). Telecommuting and video‐conferencing can be even safer.

       Figure 3.1: Risk of fatality by transport mode

                                                   0.7
           Fatalities (per 100 million passenger

                                                   0.6

                                                   0.5
                         kilometres)

                                                   0.4

                                                   0.3

                                                   0.2

                                                   0.1

                                                    0
                                                         Private cars   Bus   Rail

       Source: Australian Transport Safety Bureau

Public Transport Users Association                                                                 6
Figure 3.2: Road deaths and public transport use in OECD countries
16
14
Road deaths (per 100,000
12
population)
10
8
6
4
2
0
0 1,000 2,000 3,000 4,000 5,000
Rail & bus travel (passenger-km per capita)
Source: OECD in Figures. Note: Countries that rely on public transport for a greater share of their mobility
needs tend to suffer from fewer traffic fatalities.
Public transport offers mobility for older people whose driving skills and confidence are declining
(see Figure 3.3). This option will become increasingly important as the population ages and more
people look for alternatives to driving. Public transport also offers an alternative to driving for
people suffering from fatigue or who wish to enjoy a few drinks out with friends.
Figure 3.3: Age of driver and serious injury crashes per distance travelled, Australia, 1996
Source: Fildes et al. 2001 cited in Langford 2006
Clearly public transport will only be an option in these cases if it is available. This means that
adequate services should be available outside of peak hours such as evenings and early mornings
when fatigue is often at its worst and during the day when retired people may wish to travel.
Many areas of our major cities are without adequate public transport and the situation is worse in
regional centres. New railway lines, bus routes and tram routes are needed.
Public Transport Users Association 7For example, in Melbourne:
• New railway lines to Tullamarine Airport, Doncaster and Rowville have been promoted by
the new state coalition government. New lines need funding and the political will to build
them.
• Buses could provide good public transport in the many areas not served by trains or trams,
especially in outer suburbs and regional centres.
• Tram route extensions are needed to fix missing links in the network and serve activity
centres built after construction of tram lines ceased. Examples include routes to Chadstone
shopping centre, Knox City and Doncaster.
• Off‐peak train services and most bus services in Melbourne are not sufficiently frequent to
provide a good service and are not operated at all on weekends on some routes. Service
frequencies should be such that, every day, there is no necessity for people to consult a
timetable; rather they should be able just go to the station or tram or bus stop confident
that a service will be along soon. The PTUA advocates ten minute frequencies on all major
routes, every day.
Trains, buses and trams that connect with one another create a much more extensive and useful
public transport network than is possible by any one mode or route alone. Melbourne is notorious
for poor connections between its transport modes (PTUA 2009a, pp.11‐12; PTUA 2010b), resulting
in the new coalition government’s promise to implement a public transport coordinating body.
Such coordination is recommended throughout Australia.
Regionally in Victoria, more frequent inter‐regional public transport services are also needed. The
success of the Victorian Regional Fast Rail (RFR) services, on which patronage continues to grow
very strongly, necessitating more carriages being built, illustrates the impact that good services
can have in shifting people from car to public transport. These services are quick and quite
frequent but improved frequencies are inhibited by single track lines to Ballarat, Bendigo and
Traralgon. Capacity on these lines needs to be enhanced by duplication where appropriate.
Train services to other regional Victorian centres off the RFR network are very poor, for example,
only three per day to Warrnambool and Shepparton. These service frequencies need improving
significantly, which not only requires more carriages but also more passing loops.
Travelling interstate to and from Victoria is even worse, with only two trains per day to Sydney
and, more importantly, intermediate regional centres and three per week to Adelaide and
intermediate regional centres. Travel times on these services are also slow. Straightening the line
and upgrading the track for faster running (benefiting both passenger and freight traffic) would
enable faster, more frequent services to be operated and encourage long distance travellers – who
are often at greatest risk of fatigue ‐ to use public transport.
Government policies which encourage the purchase and use of motor vehicles distort travel
decisions and increase exposure to the risk of road trauma. Among the worst examples of these is
the statutory method for valuing motor vehicle fringe benefits. This method grants larger tax
concessions for company cars the further the vehicle is driven each year. In contrast to most tax
Public Transport Users Association 8deductions, vehicle use for non‐business purposes or for travel of a private or domestic nature is
counted as part of the annual distance travelled. This creates an incentive to drive as much as
possible instead of walking, cycling or using public transport, and is demonstrated by the number
of vehicles that are driven beyond the various statutory formula thresholds (see Figure 3.4).
Figure 3.4: Number of vehicles using statutory method by kilometres travelled
Source: Henry Review 2009
The direct cost to government of the statutory method concession is rapidly growing beyond
$1 billion per annum (Treasury 2011, p.139), which does not count the costs of additional carbon
emissions, congestion and business motor vehicle expenses resulting from the statutory incentive
in favour of excessive driving. While there may be a case for offering a simple alternative to the
cost basis, such an alternative should neither encourage additional driving nor result in such large
tax expenditure. As recommended by numerous reports, inquiries and submissions, it is now
time for the statutory method to be abolished in its current form. Any replacement method should
encourage sustainable travel decisions and result in negligible tax expenditure. The savings from
abolition of subsidies to the purchase and use of motor vehicles should be directed to improving
transport alternatives that enable reduced exposure to the risk of road trauma.
3.1.1.1 Recommendations
Increasing public transport’s share of passenger transport will improve road safety by reducing
the number of cars on the road which transfers the transport task from an inherently more risky to
a less risky mode of transport.
The following initiatives are recommended:
• Expanding public transport networks;
• More frequent public transport services;
• Better coordination of public transport;
Public Transport Users Association 9• Abolish the statutory method for valuing motor vehicle fringe benefits and direct savings
to public transport and active transport infrastructure.
3.1.2 Safe streets
Safe, ʺwalkableʺ 1 streets are vital both to reach public transport and to walk to local destinations
that avoid the need to drive to more distant destinations. Therefore, urban planning regulations
must ensure generous footpaths are always provided and that these cater for people with
restricted mobility and mobility aids. Street layouts ‐ e.g. road widths, turning arcs, etc ‐ must also
accommodate public transport vehicles otherwise public transport services will be prevented and
residents will be forced to use higher risk modes of transport (VTPI 2010a; Department of
Transport 2008). Building and planning regulations can also help to make streets safer for
pedestrians by ensuring building occupants and passers‐by provide ʺpassive surveillanceʺ that
deters anti‐social activity (DSE 2005).
Many journeys that are currently made by car are short enough to be walked or cycled, while
reaching public transport often involves walking or riding to and from railway stations and tram
and bus stops. The health benefits of active transport are numerous and significant, including
benefits for cardio‐vascular systems, controlling weight and back problems (de Hartog et al 2010).
Therefore, it is important that Australia’s cities and towns have streets that are suitable for
pedestrians and cyclists. Some traditional road treatments can actually worsen conditions for
active transport and should be avoided. For example, roundabouts feature in a disproportionate
number of cyclist injuries and can force pedestrians to deviate from their most direct path (Bicycle
Victoria 2009).
Measures are required to improve safety for people boarding and alighting from trams, such as
alerting motor vehicle drivers that they may have to stop. It is still common in Melbourne for cars
to pass stopped trams while passengers are attempting to board or alight resulting, from time to
time, in death and injury. Such measures could include signage, painted roads immediately
before and at tram stops, flashing lights on trams initiated by tram drivers and on‐board cameras
to identify motorists who fail to give way as required.
3.1.2.1 Recommendations
• Strengthen safety and compliance measures at tram stops.
• National standards are required to mandate safe and accessible streets in Australia. The
following are recommended:
o Safe footpaths and cycle paths. Footpaths and cycle paths that are sufficiently
wide on all urban roads are required to encourage walking and cycling. Those on
busy roads should, ideally, have wide nature strips to separate pedestrians from
1ʺbuilt environment [that] supports and encourages walking by providing for pedestrian comfort and
safety, connecting people with varied destinations within a reasonable amount of time and effort, and
offering visual interest in journeys throughout the networkʺ (Southworth 2005)
Public Transport Users Association 10traffic. Where this is not possible, lower speed limits and traffic calming should be
implemented.
o Universal access. Paths and crossings should cater for wheelchairs and other
mobility aids, prams, etc.
o Pedestrian priority at road crossings. Jaywalking would be significantly reduced if
pedestrian crossing lights were responsive to pedestrians, while vehicle journey
times would not increase over the whole journey. This would follow standard
practice in the UK and mainland Europe.
o Location of pedestrian crossings. Some pedestrian road crossings are not in safe
locations, such as on roundabouts. National standards are required for locating
pedestrian crossings to ensure convenience and safety. Crossings at roundabouts
should feature speed humps and zebra crossings.
• Best‐practice urban design. Urban planning schemes should ensure effective passive
surveillance of pedestrian and cycle routes. Adequate street lighting can also help to make
people feel safer and also assist motorists drive safely.
3.1.3 Freight transport
Just as public transport is safer for passenger travel, rail is safer for freight transport (MacKenzie
2010). Trucks are involved in a disproportionately high number of road deaths relative to the
share of total traffic they represent (ATC 2010, p.7). Regional communities are rightly concerned
about the movement of dangerous goods such as petroleum by road, and wish to see rail regain its
role as preferred mode for goods transport (ABC 2009). However, getting a larger share of freight
onto rail will require a reversal of the massive imbalance in spending that has seen massive
expansion of major highways while rail infrastructure was left to decay (PTUA 2009a, pp.13‐14).
Transferring as much freight as possible to rail, so reducing the number of trucks on Australia’s
roads, will therefore improve road safety disproportionately.
Straightening Australia’s railway lines and improving the quality of the track and signalling to
permit higher speeds are required. That trucks can travel between Brisbane, Sydney and
Melbourne faster than freight trains, despite a lower (100km/h) permitted maximum speed than
rail (115 km/h) indicates the poor state of the rail infrastructure.
In addition, rail freight is inhibited by different track gauges that either make rail uncompetitive or
require trans‐shipment of goods where none would otherwise be required. New South Wales, the
Australian Capital Territory and the Northern Territory have the ‘standard’ (1435 mm) gauge,
Queensland a narrow (1067 mm) gauge, Victoria and South Australia a mix of standard and broad
(1600 mm) gauge and Western Australia has a mix of standard and narrow gauge. Standardising
track gauges Australia‐wide is necessary and would have major economic benefits (VFLC 2010,
pp.50‐60). India has standardised many kilometres of its track gauge over recent years. It is
feasible in Australia too.
Public Transport Users Association 11A number of studies have concluded that truck licence fees and fuel taxes do not even cover the
cost of the damage to roads that trucks cause. Other attributable costs not paid for by trucks
include the capital cost of having to build stronger roads to accommodate them, congestion,
contribution to global warming (trucks are less fuel efficient than freight trains), noise and other
social costs. These costs are in addition to the health care and trauma costs arising from road
accidents involving trucks.
3.1.3.1 Recommendations
The following are recommended:
• Investment in rail infrastructure to enable faster journey times for freight trains and
eliminate break‐of‐gauge inefficiencies.
• Trucks to pay their full track, environmental and social costs, charged on a distance‐
travelled basis.
3.1.4 Transport investment appraisal
The avoided costs of road trauma should be fully recognised in appraisal of public transport and
rail freight investment decisions and measured using the willingness‐to‐pay method (ATC 2010).
The tendency for road capacity expansion to induce additional traffic ‐ and hence greater exposure
to the risk of road trauma ‐ should also be fully recognised in road investment appraisal
(Pfleiderer et al 1995; Mogridge 1997; Kane & Behrens 2000; Noland 2002; PTUA 2008d, pp.15‐19;
Zeibots 2009; Odgers 2009; Litman 2010d; PTUA 2010).
3.1.4.1 Recommendation
When assessing the costs and benefits of rail projects, in order to arrive at optimal outcomes
avoided costs should be factored in to decision making. Appraisal of road projects should include
the impact of induced traffic.
3.2 Removing risk source
3.2.1 Dangerous driving
Dangerous driving is a major source of risk on the road (see Section 2.2). Strenuous efforts should
be made to identify dangerous drivers and get them off the road. Road safety campaigns
targeting speeding, driving under the influence and other high‐risk activities have met with
considerable success, however their deterrence effect is not as strong as it could be, particularly
among younger drivers and in regional areas (Lucas 2010a; Sexton 2010).
More widespread use of speed and red light cameras would assist with identifying offenders and
reducing crashes (Newstead & Cameron 2003; Pilkington & Kinra 2005; Gains et al 2005), while
leaving police available for random drug and alcohol testing and license checking as well as the
Public Transport Users Association 12important task of dealing with non‐traffic offences. Recent moves by Victoria Police to impose tougher penalties on serious traffic offences and crackdown on rorting of the demerit points system are also worthy of emulation by other jurisdictions (ABC 2010; Butler 2010). Public education campaigns can be effective in raising awareness of road safety (Queensland Transport 2009), however they need to be backed up by enforcement activity to be fully effective in reducing high‐risk behaviour (Haworth 2005). Recent research has demonstrated that the risk of being caught and penalised is a greater deterrent than the risk of injury or death (Fleiter 2010). This underlines the importance of comprehensive programs to identify and penalise high risk behaviour. It also casts serious doubt on the wisdom of publishing the location of mobile speed cameras. Even where high‐risk drivers have come to attention, processes for dealing with them are inadequate. For example, a driver in his 70s was able to retain his license despite being diagnosed with impaired vision following a stroke in 2003 and striking and injuring a cyclist in 2004. This licensed driver went on to strike and kill another cyclist in 2006 (Bicycle Victoria 2010). To minimise avoidable tragedies like this, mandatory reporting of unsafe drivers, as proposed by the Coroner in this case, should be considered in tandem with alternative mobility options for disqualified drivers such as scheduled public transport and community transport. Unlicensed driving and unregistered vehicles represent particular challenges due to the lack of deterrence value of typical penalties such as demerit points. In addition to other initiatives in this area, the purchase of periodical public transport tickets could be mandated for unlicensed and/or suspended drivers where adequate public transport services are available. For example, offenders in Melbourne could be required to purchase and register a 365 day myki pass if their license is suspended or they are caught driving an unregistered vehicle. This would rebalance the relative costs of travel choices in favour of public transport instead of illegal road use. Measures to discourage irresponsible road use will be more successful where alternative transport, such as public transport, is available and offers competitive journey times. Long operating spans and adequate staffing (for security) are needed to meet the needs of shift workers who are susceptible to fatigue or people who have enjoyed a few drinks after hours. Attractive regional and intercity public transport services are needed as an attractive alternative to long car trips, and greater investment in rail freight can reduce the risks associated with long‐distance road freight. There has been significant official complacency about the increase in the range of electronic devices, including mobile phones, which are permitted to be used in motor vehicles and which distract drivers and therefore cause increased road crashes (McEvoy et al 2005). This is reflected in the recent negative response by the Victorian Police Minister to a recommendation to ban the use of hands‐free devices by drivers that it would disrupt ʺthe way in which people live their lives”. However, people now live their lives in this dangerous fashion because official negligence in recent years has created the conditions for social acceptance. The fact that this is now reinforced by a powerful commercial constituency which has a vested interest in the continuation of this behaviour should not influence future road safety measures. After all, drinking and driving was once regarded as an admirable duet. Tougher laws are required so that vehicle drivers are held properly responsible for their own actions. There have been examples in Victoria in recent years of drivers acting inappropriately Public Transport Users Association 13
and causing multiple deaths being found not guilty of any offence: 1) In Benalla, a truck drove into
the side of a steam locomotive at a level crossing in broad daylight, causing the deaths of three
people on the locomotive; 2) Near Kerang, a truck drove into the side of a passenger train at a
level crossing in broad daylight killing eleven passengers on the train. Australian laws should be
amended so that vehicle drivers can be and be seen to be brought to justice.

3.2.1.1 Recommendations
The following are recommended:

Compliance and enforcement

   •   Laws be toughened and standardised in States and Territories so that deaths and injuries
       caused while driving a motor vehicle can be more appropriately punished

   •   Driving under the influence. Stiffer penalties for are required for driving while under the
       influence of alcohol or drugs. Penalties should include licence cancellation and, after a
       determined period of time, offenders being allowed to take the appropriate driving tests
       again before regaining their licence. The appropriate driving test should test their
       awareness of and susceptibility to re‐offending.

   •   Controlling devices. A device fitted to serious road offenders’ cars that prevents the
       engine being started until a valid licence is inserted. These licences should be able to be
       disabled remotely after drivers are found guilty of committing an offence

   •   Speeding. Introducing more speed cameras, both permanent and mobile, would be a cost‐
       effective way to discourage speeding. Speed cameras are most effective at discouraging
       dangerous driving if road users do not know their location. Unpaid fines should result in
       licence cancellation.

   •   Running red lights. Red light cameras at more intersections and faster cycle times for
       traffic lights would be effective in reducing red light offences.

   •   Demerit point fraud. Increased compliance measures to prevent demerit point fraud
       would strengthen the deterrence value, and hence effectiveness, of road safety measures
       such as speed and red light cameras.

   •   Mobile phone use. All mobile phone use and other hands free device use should be
       banned in vehicles. Increased penalties and enforcement activity, including the use of
       camera technology, and an ongoing public education program should be introduced to
       reduce the illegal use of mobile phones and other electronic devices.

   •   Vehicle roadworthiness. Enhanced roadworthiness compliance measures should be
       implemented, particularly in jurisdictions without mandatory annual testing.

Mandatory public transport passes for disqualified drivers

Where adequate public transport services exist, disqualified drivers should be required to
purchase periodical public transport tickets for the duration of their disqualification.

Public Transport Users Association                                                                   14
Mandatory reporting of driver non‐fitness
Mandatory reporting to the road licensing authorities of drivers who, for whatever reason, are
unfit to drive is recommended. This should include reporting by doctors, psychologists and
employers, and include support for identifying alternative mobility options.
3.3 Changing likelihood
3.3.1 Driver training
As discussed above, driver behaviour is a key cause of road crashes. Although driver training is
sometimes proposed as a solution to high levels of road trauma, Australian and international
evidence shows that such training may be ineffective at best and counter‐productive at worst by
encouraging early licensing of younger drivers (see Figure 3.3) and over‐confidence (Langford
2006). This is particularly the case with “advanced” training which can encourage people to
ignore the need to drive more cautiously in treacherous conditions. Rather, defensive driving
techniques should be mandatory training for all drivers.
Much greater potential has been demonstrated by graduated licensing approaches that
progressively expand the range of experience of novice drivers, particularly in the presence of
experienced drivers, and that highlight driver limitations rather than encourage over‐confidence
(Langford 2006, pp.5‐6). Lengthy periods of supervised training in all road conditions are
considered the best preparation for learner drivers.
Many drivers who have held their licences for some time are unaware of some road rules,
particularly those rules introduced since their licence was obtained (Rissel et al 2002). This lack of
awareness can contribute to dangerous situations arising while driving. A number of jurisdictions
around the world have introduced periodic retesting of licensed drivers, and such an approach
could help to reduce death and injury on Australian roads.
In addition, drivers can acquire bad habits so periodic refresher training and testing would be
beneficial, while older people lose their cognitive as well as their physical abilities.
Throughout driver training and subsequently, it should be emphasised that:
• Driving is a privilege, not a right, and that acquiring and maintaining an appropriate level
of competence is necessary to acquire and retain that privilege.
• Holding a driving licence places responsibilities on its holder, reflected in tougher laws
(see above).
• Almost all crashes are caused by poor driver behaviour of one sort or another.
Public Transport Users Association 153.3.1.1 Recommendations
Graduated licensing
Acquiring a driving license should require the acquisition and maintenance of a higher level of
competence than is required currently and the competence level should reflect driving experience
and the type of vehicle being driven.
Graduated licensing systems should be in place nationally based upon international best‐practice
and evidence incorporating:
• a minimum age which recognises emerging research on brain maturity and crash risk
(Ockhamʹs Razor 23 August 2009);
• comprehensive written testing on road rules, defensive driving and road safety;
• minimum driving experience under competent instruction;
• limits on engine power and peer passengers;
• further written and practical testing for heavy and commercial vehicles;
• periodic written and practical re‐testing, particularly for older drivers and repeat
offenders.
3.3.2 Bike education
While driver licensing involves theoretical and practical testing that develops understanding of
road rules, the approach to cycling is necessarily less regulated. This means there is often no
formal development of knowledge about road rules among young cyclists. Bike education
programs can be effective in improving bike skills and knowledge of road rules (McLaughlin &
Glang 2010). Given the large benefits offered by cycling (de Hartog et al 2010), all tiers of
government should support bicycle education programs to improve bike skills and control as well
as understanding of road rules & etiquette among cyclists.
3.3.2.1 Recommendation
Bicycle education should be provided at all schools to teach safe riding skills and practices, both
on‐road and off‐road.
3.3.3 Catering for active transport
Inadequate separation of cyclists and motor vehicles also increases the likelihood of a crash. The
rapid growth in cycling as a healthy, affordable and clean form of transport is putting pressure on
existing cycling infrastructure and demonstrating the need for much greater investment in cycling
infrastructure to support this mode shift and save lives. Such investment would strengthen the
“virtuous circle” of higher rates of cycling leading to lower rates of cyclist deaths that has been
witnessed around the world (Jacobsen 2003; Robinson 2005; Elvik 2009). The importance of
Public Transport Users Association 16raising motorists’ consciousness of cyclists is highlighted by recent research demonstrating that
most incidents involving cyclists and motor vehicle are the fault of the vehicle driver (Johnson et al
2010). Increasing participation in cycling will be a key part of raising consciousness.
Higher rates of walking also contribute to lower rates of injuries to pedestrians (Leden 2002) as
well as having cardio‐vascular and other health benefits such as reducing obesity. This can be
encouraged by lowering traffic speeds and breaking through the “barrier effect” that results from
roads and traffic 2 . Plentiful safe and attractive crossing opportunities (such as ground level
pedestrian crossings with absolute priority or responsive signals) minimise the temptation to
jaywalk, while lack of attractive crossing opportunities can encourage risk‐taking by pedestrians.
Figure 3.5: Cycling and fatality rates in 14 European countries in 1998
Source: Jacobsen 2003.
Note: Cyclist and pedestrian fatality rates fall as the amount of cycling and walking increases.
3.3.3.1 Recommendation
Active transport infrastructure
Improved infrastructure to cater for and encourage walking and cycling is recommended,
including:
• Cycle lanes that are physically separated from motor vehicles on roads, not just painted
cycle lanes on roads
• More off‐road cycle and walking paths
• Pedestrian crossings with zebra crossings or lights that are responsive to pedestrians.
2“The Barrier Effect (also called severance) refers to delays and discomfort that vehicle traffic imposes on
nonmotorized modes (pedestrians and cyclists). Severance usually focuses on the impacts of new or wider
highways, while the barrier effect takes into account the impacts of vehicle traffic.” (VTPI 2009)
Public Transport Users Association 173.3.4 Safer roads
The strategy should have regard to changes in urban form currently under way as well as those
that might be anticipated. It should also be recognised that some urban forms are safer for certain
classes of road users than others. e.g. local roads where the default speed limit or lower speed
limits apply and that are reasonably heavily trafficked may be less hazardous for pedestrians than
less congested arterial roads, and especially rural roads, where higher speed limits apply. Prima
facie this appears to be particularly the case with road crashes in rural areas where there is a high
proportion of run‐ off road crashes.
Crash risk can be greatly reduced by guideposts and the maintenance of high visibility
linemarking so the road alignment is clear to drivers and by sealing or widening road shoulders so
there is greater margin for error (Baldock et al 2008). Safety measures such as these are also much
more affordable than duplication of single carriage‐way roads and would greatly expand the
reach of road safety spending compared to duplication projects (ATC 2010, p.25). In contrast,
measures that increase road capacity can encourage people to drive faster, further and with less
care, resulting in increased fatalities and injuries (Noland 2002; Ewing et al 2003; PTUA 2010).
With many other public services ‐ such as health and education ‐ also deserving of funding,
limited resources should not be used up on a relatively small number of duplication projects, but
should instead benefit a larger number of more affordable improvements (such as shoulder
widening) in a wider variety of locations. The expected peak in global oil production (Nashawi et
al 2010; Owen et al 2010; Zhang et al 2010; Aleklett et al 2010; Munroe 2010) also casts major doubt
on the wisdom of road construction and duplication when other modes of transport are likely to
become increasingly important for mobility.
Road signs are not standardised in Australia and are, generally, poor compared with overseas best
practice and sometimes non‐existent, distracting and confusing drivers and potentially causing
them to change lanes suddenly and dangerously. Consistent and legible road signs, including at
and well in advance of roundabouts and intersections similar to those in the UK, would contribute
significantly to safer roads.
3.3.4.1 Recommendations
• Lane edge marking and barriers. Clear delineation of road lanes that show drivers
where they may drive are recommended to encourage the separation of motor vehicles
from cyclists and pedestrians. Barriers to separate traffic flowing in opposite directions on
major, multi‐lane roads (dual carriageways) and to prevent vehicles running off the road
are recommended.
• Shoulder widening. Widening and sealing road shoulders to allow a greater margin for
error are recommended.
• Road signs. Legible signs to one common, national standard are recommended.
Public Transport Users Association 183.4 Changing consequences 3.4.1 Safer cars Vehicle design is a major influence on the severity of injuries in the event of a crash. Safety features such as seatbelts and airbags have played a major role in reducing road trauma ‐ turning impacts that once would have resulted in fatal or serious permanent injuries into less serious crashes. The Australian Design Rules (ADRs) specify a range of minimum standards, such as inertia reel seatbelts, that new cars must incorporate before they can be sold in Australia. Ensuring that the Australian Design Rules (ADRʹs) keep pace with international best practice in vehicle design will be a key part of reducing the severity of injuries suffered in the event of a crash. A matter to which we wish to draw particular attention concerns the increased heterogeneity of the Australian motor passenger vehicle fleet, especially in relation to vehicle mass and power. An increased mix of smaller and larger vehicles is likely to make road use more dangerous for users of small vehicles, in particular. There is a growing list of environmental and other reasons why smaller passenger vehicle use should be encouraged in Australia over larger vehicles. Many of the larger vehicles now on the road originate from the inappropriate tax advantages provided by successive governments to four wheel drive vehicles which are used on‐road. The consequence is that many of the larger vehicles now on Australian roads are more dangerous than is justified. As a class they have been more likely to roll in loss of control crashes and they also inflict greater damage when they impact other road users in smaller vehicles, primarily because of greater mass and power. They have typically very strong acceleration, often observed deployed at controlled intersections and which elevates the risk of a crash, quite uncharacteristic of their rural industry use predecessors. It is not that uncommon to hear vehicle owners who have purchased a sports utility vehicle for the first time to say in effect that ʺif you canʹt beat ʹem, you join ʹem.ʺ The clear implication is that there is a palpable fear of SUVʹs amongst other road users. The notion that ʺmight is rightʺ is a very unsound basis for the improvement of the road safety record on Australian roads. The increased incidence of heavily tinted windows and windscreens in motorcars in recent years is another instance of the triumph of fashion at the expense of road safety. Most seriously it denies an important visual cue, especially during the day, for other road users about the intention of the driver of the vehicle because the drivers face is hidden from view. For example, where a car with tinted windows is turning right at an intersection and pedestrians are crossing the vehicle’s path it assists the pedestrians significantly if he is able to observe that the driver has seen him. Such circumstances are especially hazardous where there is a possibility that the driver may attempt to complete the turn hastily to beat on‐coming traffic. Tinted windows are also a major road safety concern in car parks where there is a mix of vehicular and pedestrian traffic sharing the same space in conditions of limited visibility which heightens the risks for pedestrians in particular. The problem is heightened by the increased heterogeneity of the passenger vehicle fleet in areas such as public car parks where there is a greater range of smaller and larger vehicles. It would be unsurprising if the crash record were to show relatively Public Transport Users Association 19
few serious injury crashes in these situations (because of low vehicle speed) but, again, vulnerable
road users and especially pedestrians are likely to be those most at risk in this situation.

Heavily tinted windows are also an issue for behaviour and enforcement because the identity of
the driver and other vehicle occupants is unclear. Where the driver is comfortable he is not
observed such activity as the illegal use of mobile telephones (which appears to be virtually
untouched by enforcement activity) and other electronic devices is encouraged and enforcement is
made more difficult.

The Australasian New Car Assessment Program (ANCAP) is well‐known for conducting vehicle
crash‐testing in Australia and rating the ʺcrash‐worthinessʺ of vehicles on a scale of 1 to 5 stars.
Although a high crash‐worthiness score indicates a good level of protection for occupants, it does
not mean the vehicle is safe from the perspective of other road users (Cameron et al 1999;
Newstead et al 2000). In fact, the ADRs tend to focus exclusively on protection of vehicle
occupants to the exclusion of other road users (Newstead et al 2004, p.18). The trend towards
heavy four wheel drives and SUVʹs, which tend to cause greater damage to other road users than
lighter cars (Newstead et al 2003), highlights the need to focus on other road users when setting
safety standards.

Since around a quarter of motorists admit to near misses with pedestrians and cyclists (AAMI
2005), and about 18 per cent of people killed in road crashes are pedestrians, it is crucial that the
ADRs also focus on minimising the severity of injuries to vulnerable road users. While ANCAP
now includes a pedestrian impact test, it is unlikely that pedestrian impact will be a major
consideration for car buyers. It is vital therefore that the ADRs mandate improved design features
‐ such as adequate under‐bonnet clearances ‐ that minimise the severity of impact with
pedestrians.

3.4.1.1 Recommendations
Maximum mass and power to weight ratios of licensed passenger vehicles

The increased heterogeneity of the Australian passenger vehicle fleet should be addressed as a
major contributor to the rate of serious injury and fatality road crashes. Particular regard should
be had for vehicles of larger mass and power with a view to implementing power and mass limits
that do not impose upon reasonable on‐road use and having full regard for the unreasonable costs
currently imposed on other road users.

Eliminating tinted windows and windscreens to maximise visual acuity for all road
users

Tinting of windscreens and windows of motor vehicles that reduces the ability of other road users
and enforcement officers to clearly observe the occupants of motor vehicles should be banned.

Australian Design Rules to include pedestrian impact

Designing vehicles to be as safe as possible for occupants in the event of impact is obviously
worthwhile, but it is also important to consider vehicle impact on non‐occupants i.e. pedestrians
and cyclists. Features such as bull‐bars that cause significant damage to the human body on

Public Transport Users Association                                                                  20
impact are not required for city and town driving and should be removable and only used when
necessary, such as for off‐road driving and driving on country roads at night.
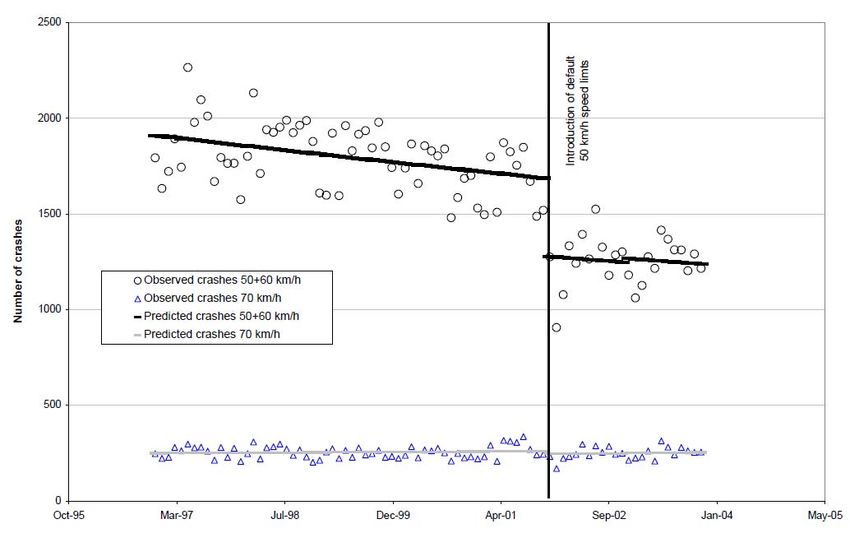
3.4.2 Safe speeds
Figure 3.6: Monthly crash frequency in 50 and 60 km/h zones and 70 km/h speed zones in Perth
Source: Office of Road Safety 2004. Note: Crash frequency dropped significantly when the default urban
speed limit in Western Australia was lowered from 60km/h to 50km/h.
The severity of injuries suffered by a pedestrian and the likelihood of a fatal impact can both be
reduced dramatically by lowering impact speed as shown in Figure 3.7. For example, the
reduction of default urban speed limits from 60 km/h to 50 km/h in Western Australia resulted in
an immediate and significant reduction in the number of crashes, while the same speed limit
reduction in Victoria resulted in a 25‐40 per cent reduction in fatal and serious injury crashes
involving pedestrians (OʹHare 2005; Hoareau et al 2006). Nevertheless, Australia still has among
the highest speed limits in the world (Garrard 2008).
Even larger safety benefits can be obtained by lowering speeds limits to 30‐40 km/h in areas where
there are potential conflicts between pedestrians and cars such as activity centres, residential
streets and near schools (Woolley & Dyson 2003).
Public Transport Users Association 21Figure 3.7: Probability of critical injury by speed and victim age
80
Probability of critical injury (%)
70
60
50
40
30
20
10
0
Up to 10 10 to 20 20 to 40 Over 40
Im pact speed (km /h)
Up to 15 years 16 to 50 years Over 50 years
Source: McClean et al. 1994
Note: The likelihood of serious injury, including death, increases dramatically from about 30‐40km/h.
Traffic calming is also proven to reduce the risk of injury to pedestrians and should be a key part
of making streets safer for young and old alike. Traffic calming measures and street design more
generally must however apply ʺuniversal designʺ concepts to ensure attractive public transport
services can be provided safely and efficiently and that walking and cycling are also safe and
attractive (VTPI 2010a; Department of Transport 2008).
Active enforcement of the road rules, especially in relation to speeding, is a proven technique for
reducing serious injury road crashes. The recent decision of the Victorian government to publicly
advise the location of mobile speed cameras every week will significantly reduce the effectiveness
of this important component of the Victoria Police road safety enforcement armoury and will
contribute to an increase in crash rates. It is comparable to a security firm announcing to would‐
be burglars of the time when they intend to visit particular business premises on a ʺrandomʺ
check.
3.4.2.1 Recommendations
• Speed limits. It is recommended that speed limits be reviewed throughout Australia and
that new limits be set that recognise safety as a priority, especially in areas where people
live or congregate, such as suburbs, city centres and around schools and aged care
facilities.
Lower speed limits are recommended, for example:
• In suburban side streets and city and town centre roads – 40 km/h
• On main roads in built up areas – 50 km/h
• On main roads that have wide nature strips or similar separation from pedestrians
and cyclists – 70 km/h
Public Transport Users Association 22• On open roads, including freeways and tollways – 100 km/h.
• Traffic calming. Traffic calming measures in built up areas, approaching intersections and
in other places where traffic must slow down, such as tight bends, are also recommended.
• Enforcement of the road rules. Highly active enforcement of the road rules in relation to
speeding should be reinforced in the strategy including the unencumbered use of speed
camera technologies.
3.4.3 Fostering responsible behaviour
Although the ADRs now mandate the provision of seatbelts and road safety laws mandate their
use, about 30 per cent of car occupants killed in crashes are unrestrained, once again highlighting
the importance of targeting road user behaviour in efforts to cut the road toll. Seatbelt
enforcement should clearly feature in road safety campaigns.
In addition to official enforcement activities, parents can also help to ensure the safety of their
children once they reach driving age. Parents start by setting an example behind the wheel that
their children often unconsciously mimic when they get behind the wheel themselves (Lucas
2010a). Parents can also help by making the family car available to their children rather than
forcing them to buy more affordable but often less safe cars of their own. Sharing a smaller
number of (safer) cars instead of owning at least one car per driver can also slash the large sums of
money that some households spend owning and operating motor vehicles.
3.4.3.1 Recommendation
It is recommended that enforcement of seatbelt rules be tightened and that this aspect of road
safety be included in all driving tests.
Parents of young, learner drivers should be educated about teaching road safety to their children
and setting a good example.
3.5 Sharing risk
3.5.1 Insurance
This risk treatment option is less relevant to road safety than some other risks, however insurance
is still an important consideration in this context. Compulsory Third Party insurance schemes
play a vital role in ensuring road trauma victims receive good quality medical care and
rehabilitation. Governments should ensure that insurers provide adequate benefits for road
trauma victims.
The Review of Australia’s Future Tax System found that “compulsory third party insurance
premiums are not charged on the basis of individual risk or driving behaviour” and
recommended that CTP insurance schemes be improved to reflect individual risks (Henry 2009,
Public Transport Users Association 23You can also read