Natura 2000 Areas and Sites of National Interest (SNI): Measuring (un)Integration between Naturalness Preservation and Environmental Remediation ...
←
→
Page content transcription
If your browser does not render page correctly, please read the page content below
sustainability

Article
Natura 2000 Areas and Sites of National Interest (SNI):
Measuring (un)Integration between Naturalness
Preservation and Environmental Remediation Policies
Francesco Scorza , Angela Pilogallo * , Lucia Saganeiti               and Beniamino Murgante
 School of Engineering, University of Basilicata, 85100 Potenza, Italy; francesco.scorza@unibas.it (F.S.);
 lucia.saganeiti@unibas.it (L.S.); beniamino.murgante@unibas.it (B.M.)
 * Correspondence: angela.pilogallo@unibas.it; Tel.: +39-320-421-0250

 Received: 27 December 2019; Accepted: 2 April 2020; Published: 7 April 2020

 Abstract: The Natura 2000 network was established as a tool to preserve the biological diversity of
 the European territory with particular regard to vulnerable habitats and species. According to recent
 studies, a relevant percentage of Natura 2000 sites are expected to be lost by the end of this century and
 there is widespread evidence that biodiversity conservation policies are not fully effective in relation
 to the management plans of the protected areas. This paper addresses the issue by analyzing a specific
 case in which there is a problem of integration between different competences and sectoral policies
 that leads to the lack of a monitoring system of territorial management performances. The study area,
 located in the Basilicata Region (Southern Italy), includes a Site of National Interest (SNI), for which
 several reclamation projects are still in the submission/approval phase, and a partially overlapping
 Natura 2000 network site. The tool used to monitor biodiversity in the study area is the degradation
 map obtained through the “habitat quality and degradation” InVEST tool which is used to assess the
 current trend and thus define a baseline for comparison with two medium and long-term scenarios
 applicable to the SNI’s procedure of partial and total remediation. The proposed methodology is
 intended to be a part of a larger and more complex monitoring system that, developed within the
 framework of ecosystem services, allows for the overcoming of the limits related to fragmentation
 and contradictions that are present in land management by offering a valuable support to decision
 makers and the competent authorities in biodiversity conservation policy design.

 Keywords: habitat degradation; ecosystem services; Natura 2000 network; Site of National Interest
 (SNI); spatial planning; Basilicata Region

1. Introduction
       According to the Intergovernmental Science-Policy Platform on Biodiversity and Ecosystem
Services (IPBES) [1] about 25 per cent of both animal and plant species are threatened and around
1 million species already face extinction, many within decades. Even if during the last twenty years
remarkable progress has been made in deeply understanding how biodiversity impoverishment affects
ecosystems’ services (ES) and their relevant performance [2], and consequently the quality [3] of human
life, the composition of the species’ communities is rapidly decreasing with potentially unpleasant
consequences for the resilience of the ecosystems [4].
       If the current challenges included in the Sustainable Development Goals (SDGs) point toward
balancing the often conflicting objectives of human development and biodiversity conservation (see
SDGs 1, 2, and 8) [5], the aims of biological diversity preservation and the protection of vulnerable
habitats and species have already been addressed by the European Union (EU) through the Birds and
Habitats Directives and the subsequent establishment of the Natura 2000 network (N2K network).

Sustainability 2020, 12, 2928; doi:10.3390/su12072928                           www.mdpi.com/journal/sustainability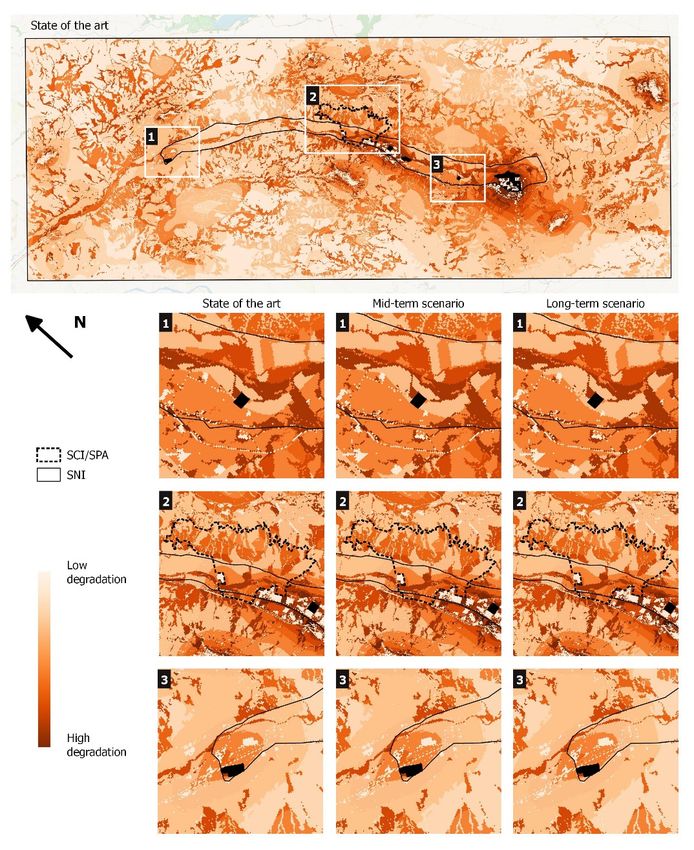
Sustainability 2020, 12, 2928                                                                        2 of 16

Stretching over 18% of land areas and about 9.5% of marine territories across all 28 EU countries, N2K
represents the largest international network of protected areas. Although the goal of constituting a
vital backbone of the EU's green infrastructure has been reached, a big challenge still lies ahead: the
appropriate management of sites [6]. As a matter of fact, protected areas should not only be considered
as reservoirs of biological diversity but also as the sustainers of an ecosystem resilience and the
fundamental providers of functions, goods, and services that are essential for human well-being and
wealth [7,8]. Although the N2K network potential for the achievement of the conservation objectives
is widely recognized [9], the results to date are not considered to be fully satisfactory [10,11], and a
number of studies have been carried out in order to identify the main weaknesses [12–15].
      As far as territorial governance is concerned, it emerges that the effectiveness of site designation
and management depends on the decision-making and policy-design process [16], as the support of
local stakeholders in their approval and participatory role is crucial for the long-term success of site
management [17,18]. Another point considered to be very critical is that of the overlapping policies
and responsibilities at different government levels [12] that are often reflected in cross-scale political
contradictions [19], conflicts related to other sectoral policies [20], and a top-down governance gap [21].
      The European Commission (EC) [22], in declaring the gap between spatial planning and its
instruments for the implementation of the N2K network as one of the most significant causes for the
lack of conservation objectives, points to territorial planning as the most appropriate framework for
the creation of an improved synergy between different sectoral and environmental policies and for
ensuring that developments comply with the EU sectoral and environmental legislation. Furthermore,
it promotes the adoption of geo-spatial information technologies (GIS) and remote sensing as reliable
information sources for decision-making processes and identifies Strategic Environmental Assessment
(SEA) and Environmental Impact Assessment (EIA) as key instruments to guarantee knowledge-based
prevention, mitigation, and compensation of sector-specific impacts on N2K sites.
      In the same perspective, Leone et al. [23] assume that the consistency between N2K site management
plans (MPs) and municipal masterplans (MMPs), in terms of sustainability objectives, should be
guaranteed by the SEA of MMPs and/or MPs and considered to be a very effective technical procedure
in order to support the implementation of ES into spatial planning.
      This work examines a case study from the Basilicata Region where a Site of Community Interest
(SCI)/ Special Protection Area (SPA) and a Site of National Interest (SNI) coexist and partially
overlap. This area was developed as an industrial site between the post-World War II years and the
70s. Public-driven industrial policies stopped during the 80s and the area underwent a period of
abandonment and decline with consequent environmental issues that derived from extensive pollution
in abandoned industrial parcels. At the end of the 90s a part of the study area was proposed as a
SCI/SPA site thanks to the variety of species and biodiversity richness present there. The procedure
for the recognition of sites as nodes of the N2K of the Basilicata Region was completed in 2003, but
it was only in 2017, following the drafting and approval of their management plans, that sites were
designated as Special Areas of Conservation (SACs).
      At the same time, due to the high levels of pollution and related effects on health, environment,
and the local economy, Law 179/2002 established the “Val Basento” as a SNI and assigned its remediation
responsibility to the Ministry of the Environment, Land, and Sea (MATTM).
      The fragmentation of competences in territorial governance led to a lack of integration between
those acts promoted by the different competent authorities (Basilicata Region for N2K sites and MATTM
for SNI), who operated without any coordination.
      The aim of this work is to describe and explain the conflict between SCI/SPAs and SNI sites in our
case study via ES land-use analysis and produce an estimation of the positive effects that remediation
actions produce on the environmental components in medium and long-term scenarios.
      “Habitat quality”, in referring to the recent debate on ES classification [24,25], is considered to
be a provisioning ES as per the Millennium Ecosystem Services Assessment [26], but a supporting
ES according to the most recent interpretation of The Economics of Ecosystems and Biodiversity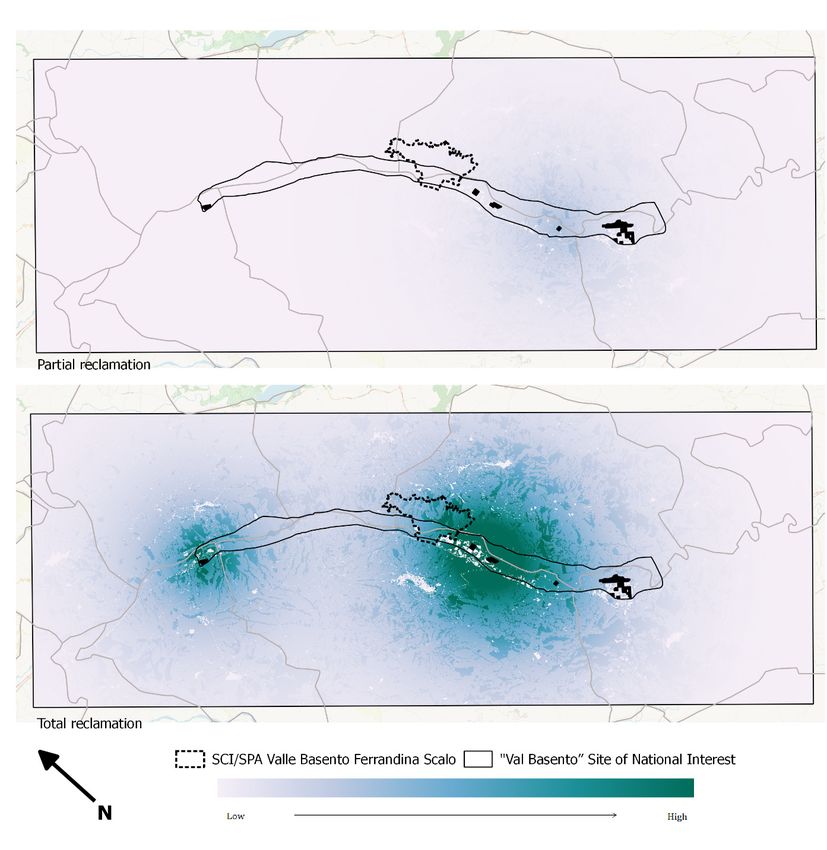
Sustainability 2020, 12, x FOR PEER REVIEW 3 of 16
“Habitat quality”, in referring to the recent debate on ES classification [24,25], is considered to
be a provisioning ES as per the Millennium Ecosystem Services Assessment [26], but a supporting ES
Sustainability 2020, 12, 2928 3 of 16
according to the most recent interpretation of The Economics of Ecosystems and Biodiversity (TEEB)
[27]. The last version of the Common International Classification of Ecosystem Services (CICES) [28],
in reorganizing
(TEEB) [27]. Thedivisions and ofgroups
last version belonging
the Common to the “Regulating
International and of
Classification Maintenance
Ecosystem Services
Services
(biotic)”,
(CICES) [28],further explores the divisions
in reorganizing various aspects related
and groups to biodiversity.
belonging The closestand
to the “Regulating reference to the
Maintenance
meaning by which we have dealt with habitat quality is the class “maintaining nursery
Services (biotic)”, further explores the various aspects related to biodiversity. The closest reference to populations
and habitats by
the meaning (including
which we gene
havepool protection)”
dealt with habitat(code 2.2.2.3—CICES
quality v.5), representing
is the class “maintaining nursery the provision
populations
of
andsuitable
habitats habitats
(includingfor wild
geneplants and animals(code
pool protection)” and 2.2.2.3—CICES
the maintenance of the
v.5), appropriate
representing theecological
provision
conditions necessary for sustaining these populations.
of suitable habitats for wild plants and animals and the maintenance of the appropriate ecological
In thisnecessary
conditions work, wefor refer to habitat
sustaining quality
these as a measure (or even as a proxy) for biodiversity by
populations.
applying
In this work, we refer to habitat quality as a of
a tool that produces a spatial assessment habitat(or
measure quality
evenand
as adegradation based on land-
proxy) for biodiversity by
use classes without any additional hypothesis on “genetic diversity” or “species
applying a tool that produces a spatial assessment of habitat quality and degradation based on land-use richness” or any
other
classesspecific
without biological/ecological meaning.on “genetic diversity” or “species richness” or any other
any additional hypothesis
specific biological/ecological meaning. Habitat Quality, that proved to be effective for the assessment
The analytical tool used is InVEST
of howThedifferent
analyticalchange scenarios
tool used in land
is InVEST coverQuality,
Habitat or, as inthat
ourproved
case study,
to be habitat
effectivethreats
for themight affect
assessment
habitat
of howquality
different and, consequently,
change scenariosbiodiversity [29].or,
in land cover Theasresults
in ourobtained in thehabitat
case study, study area highlight
threats might
the potential of the proposed methodology to support the decision-making
affect habitat quality and, consequently, biodiversity [29]. The results obtained in the study area process, orienting
reclamation
highlight theprocedures
potential ofand improving
the proposed management
methodology toactions
supportfor theboth SCI/SPA andprocess,
decision-making SNI sites within
orienting
an integrated approach.
reclamation procedures and improving management actions for both SCI/SPA and SNI sites within an
integrated approach.
2. Study Area
2. Study Area
The study area, located in the Basilicata Region (Southern Italy), extends for about 742.5 square
kilometers and area,
The study is located
locatedalong
in thethe middleRegion
Basilicata valley (Southern
of the Basento
Italy), River,
extendspartially
for aboutincluding the
742.5 square
municipalities
kilometers andofis Grassano, Grottole,
located along Miglionico,
the middle valleyPomarico, Montescaglioso,
of the Basento Bernalda,
River, partially Pisticci,
including the
Ferrandina, Salandra,
municipalities Garaguso,
of Grassano, and Calciano,
Grottole, all belonging
Miglionico, to the
Pomarico, province of Matera.
Montescaglioso, Bernalda, Pisticci,
The interest
Ferrandina, in this
Salandra, study area
Garaguso, and(see Figureall
Calciano, 1) belonging
is based ontothe
the simultaneous presence of a large
province of Matera.
industrial area, a SNI,
The interest and
in this areasarea
study of acknowledged
(see Figure 1) naturalistic-environmental
is based on the simultaneous value.
presence of a large
industrial area, a SNI, and areas of acknowledged naturalistic-environmental value.
Figure 1. Represents the context of the study area from which emerges the dominance of agricultural
land use
Figure 1. linked to both
represents thecropland and
context of theextensive meadows.
study area Along
from which the Basento
emerges Valley there
the dominance is one of the
of agricultural
majoruse
land industrial areas
linked to ofcropland
both the Basilicata
and Region,
extensivepart of whichAlong
meadows. was subsequently
the Basento designated
Valley thereasisa one
Site of
of
National Interest (SNI). On the image is also visible the perimeter of the Natura 2000 (N2K) site and the
overlapping area under investigation.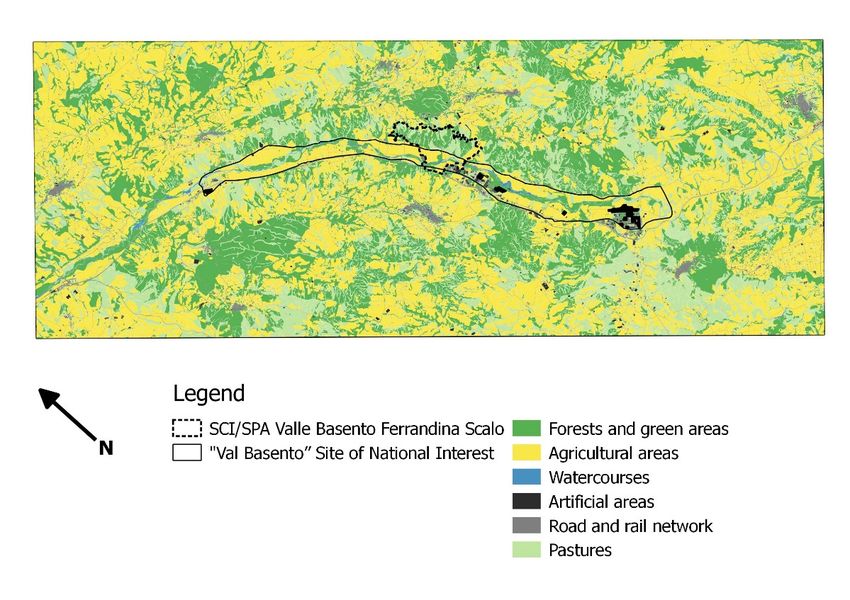
Sustainability 2020, 12, 2928                                                                       4 of 16

     This area certainly falls within the Val Basento industrial agglomeration, one of the largest in
Southern Italy, founded between the 50s and 60s subsequent to the discovery of a large methane deposit.
After the starting phase of the construction works of the Ferrandina-Bari-Monopoli gas pipeline in
1961, many other industrial activities were established in the area, such as the petrochemical complex
of the National Fuel Hydrogenation Company (ANIC). The international crisis that started in 1973 did
not spare this industrial area and led to the shutdown of several establishments. A program agreement
signed in 1987 gave the National Hydrocarbons Agency (Eni) full powers to relaunch the Val Basento
industrial area, and the Matera Industrial Consortium was given the task of creating a technology
park. In 1990 the so-called Tecnoparco Valbasento Spa was founded, which currently hosts production
activities and companies involved in the environmental and energy sectors, providing services and
infrastructures such as analysis laboratories; the production and distribution of electricity, nitrogen,
and demineralized water production plants; and the collection, treatment, and disposal of liquid waste.

2.1. “Val Basento” Site of National Interest (SNI)
      The Italian legislation defines SNIs as those areas in which the pollution of soil, subsoil, surface
waters, and groundwater is so widespread and severe that they constitute a significant danger to public
health and the natural environment.
      Because of the seriousness of the contamination, with significant environmental, health,
and socio-economic impacts, the administrative competence in remediation procedures is given to the
MATTM, whereas local authorities are often involved in the role of operation-implementing bodies
and are responsible for the development and protection of the territories affected by environmental
contamination. The criteria for the identification of a SNI are defined by Law Number 134/2012, which,
as a result, envisages the possibility that the SNI perimeter may change over time on the basis of new
information on the potential and/or confirmed contamination of new areas or on the basis of a more
accurate definition of the areas affected by potential contamination sources.
      The Val Basento industrial area has been declared a SNI in accordance with Law Number 179/2002
“environmental provisions”, while its perimeter is officially defined by the Ministerial Decree of
26.02.2003, which identifies an area of approximately 34 square kilometers. It is located along the lower
altitudes of the Basento River middle valley, brushing three municipal territories.
      Industrial settlements deemed responsible for a higher potential environmental impact include
the Eni Desulphurization Plant (formerly AGIP) in the Salandra municipality; the chemical
cluster of Ferrandina, including an asbestos treatment company (Materit), a plant for biodiesel
production (Mythen), a chemical production plant (ex-Liquichimica, ex-Pozzi, now Syndial); the
chemical-pharmaceutical pole of Pisticci with the presence of active ingredient production companies
(Gnosis Biosearch), the manufacturing of plastics and chemical fibers (Dow, Nylstar, Politex,
Equipolymers), and industrial wastewater treatment plants, such as that of the Tecnoparco Valbasento
company and landfill areas (2C Dump, Enrico Mattei Airstrip).
      On 31 December 2018 the report on the state of the remediation procedure issued by
MATTM [30] declared that only 1% of the SNI’s total area was under an approved project for
the protection/remediation of both the soil and the aquifers.

2.2. “Valle Basento–Ferrandina Scalo” Natura 2000 Site
      Since the 1980s, the struggle against the decline in biological diversity and habitat fragmentation
has been extensively explored leading to remarkable progress toward understanding how biodiversity
loss affects the functioning of ecosystems [3] and, consequently, human well-being. Aware that if
this trend were to continue the sixth mass extinction would occur in less than 250 years [31], in 1998
the European Union approved a strategy to preserve biodiversity by actively implementing the
Habitats Directive 92/43 and the Birds Directive 79/409 and proceeded with the establishment of the
N2K network.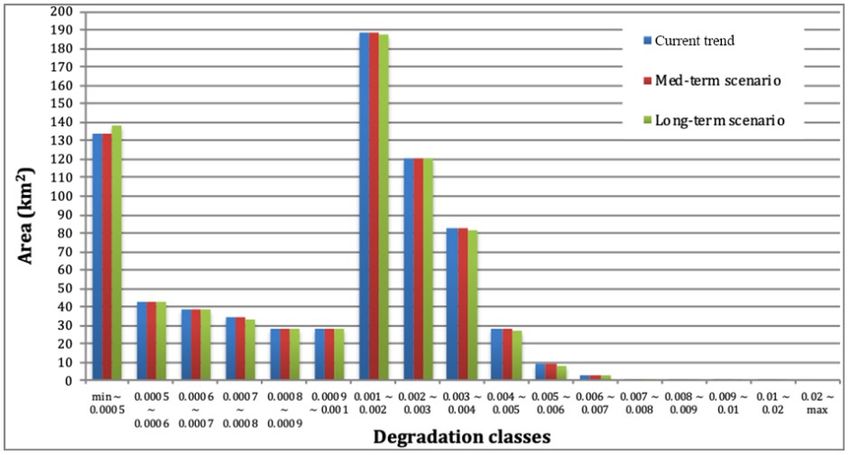
Sustainability 2020, 12, 2928                                                                           5 of 16

      The N2K project assigns great importance to high-naturalness areas but also to semi-natural
environments, which are essential for connecting areas that are spatially distant but close in ecological
functionality [14]. This means that it assesses not only the current quality of a site but also the potential
of the habitats to reach higher levels of complexity. The directive also takes into account those currently
degraded sites where, nevertheless, habitats have retained their functional efficiency [32] and can,
therefore, return to more evolved forms by reducing or eliminating degradation sources.
      The habitats directive furthermore assigns the responsibility of ensuring the management of N2K
sites, to member states. Although it is entirely left up to them to decide which option to follow among
the management plans (either statutory or administrative measures), all have to take concrete actions
to guarantee the conservation status of habitats and species. In Italy, the regions and autonomous
provinces are responsible for the management of N2K sites. Most of them have delegated other
administrations with this kind of responsibility.
      The study area involves two sites of the N2K network: the SCI/SPA IT9220255 Valle Basento
Ferrandina Scalo, which is entirely included, and part of the SCI/SPA IT9220260 Valle Basento Grassano
Scalo. As it is assumed that the two sites are spatially connected within the ecological network of the
Basilicata Region for the reasons mentioned above, the management plan approved by resolve of the
Regional Council 1492/2015 is unique for both sites.
      It is composed of two main parts: the first describes the characteristics of the two areas and
illustrates the higher-ordered and sectoral regulatory framework in which the SCIs are located.
      Although the management plan does not make explicit reference to the presence of the SNI,
despite the spatial overlapping between these two areas, the planning tools to be considered include
the regulatory plan of the industrial development area of Matera. It is prescribed that projects related
to productive activities, in addition to their compliance with the obligations provided for by sectorial
legislation, must be complemented by a specific report aimed at verifying the impacts and compatibility
with neighboring activities and, more generally, with the territorial ecosystem and the urban settlements
of the industrial and surrounding areas. Areas classified as SCIs and SPAs allow for the setup of craft
activities and small and medium-sized industrial activities, characterized by low pollution levels or
disturbances (gases, liquids, noise). Each plant, however, has to be subjected to ex ante Environment
Impact Assessment (EIA).
      As already mentioned, the interest in this case study arises from the overlay of a high
naturalistic-environmental value area and a site considered to be particularly critical for the pollution
level, especially with regards to the potential effects that this situation could cause from a social, health,
and economic point of view. Equally critical is that no explicit reference to this conflicting situation is
included in the management plan for the N2K site.

3. Methodology
     The N2K network was created to meet the needs and wishes to preserve breeding and resting
grounds for both rare and endangered species and certain endangered habitats. In other words, it was
established to safeguard biodiversity [33].
     In playing a key role at all levels of the ecosystem service hierarchy [34], biological diversity is the
basis for the multifunctionality of N2K sites and is defined as a core planning principle [35] able to
explicitly consider multiple and intertwining ecological, social, and economic functions. Sharing the
positions of several authors [35–37], whereby an ES approach addresses crucial aspects relevant to
multifunctionality planning, in this work we take a conservation perspective [34] by handling habitat
quality as a proxy for biodiversity, i.e., as one of the ES provided by N2K sites.
Sustainability 2020, 12, 2928 6 of 16
As stated by Sallustio et al. [38], habitat quality assessment can, without a doubt, be considered an
effective tool in order to both evaluate the effectiveness of tangible conservation policies and programs
and orient management strategies toward improving biodiversity preservation. The tool is adopted in
scientific literature to analyze how the intensity of human activity influences habitat quality [39,40]
and determine the effects of ongoing threats [41] and expected reclamation actions on the current levels
of biodiversity.
The habitat quality model, that belongs to the InVEST suite and is based on the hypothesis that
a higher HQ corresponds to a higher abundance of species and vice versa [40,42–45], draws up two
maps: habitat quality (Qxj ) and degradation (Dxj ).
The HQ is directly related to the suitability of each land use/land cover (LULC) class to provide
adequate conditions for the persistence of biodiversity (H j ) [46] and to (Dxj ) according to the following
formula: z
Dxj
Qxj = H j 1 − z
(1)
Dxj + kz
where z is a constant equal to 2.5 and k is a scaling half-saturation parameter [42]. By default, k = 0.5
but users can modify its value in order to better highlight the spatial degradation on the landscape. In
dealing with scenario analysis, users are recommended to set the k value equal to half the highest grid
cell degradation and run all the subsequent elaborations with the same k value.
H j represents habitat suitability, and its score, ranging from 0 to 1 and summarized in Table 1,
was assigned considering the most suitable (H j = 1) woodland and freshwater LULC classes as they
are considered the least modified habitats and consequently the most suitable for native species.
On the other hand, the lowest values (H j close to 0) were attributed to anthropic LULC classes,
such as industrial and residential buildings, roads and railways, and landfills and mining areas.
Intermediate values were finally given to the semi-natural land-use classes—grasslands, arable lands,
and agricultural crops.
Habitat degradation (Dxj ) is the function of the sensitivity of each LULC class to each threat (S jr ),
of the relative weight of each threat (wr ), and of the impact irxy of the threat r in cell x originating in y
and distant dxy :
XX w !
Dxj = P r r y irxy βx S jr (2)
r y r wr
where βx , ranging from 0 to 1, represents the level of accessibility in grid cell x. In this work we always
considered a complete accessibility; therefore βx = 1.
With regards the assigned sensitivity values, it is possible to see from Table 1 that the highest values
were allocated to woodlands, freshwaters, agricultural lands, and grasslands falling within the SCI/SPA
area because they were considered to be of higher value and more vulnerable to the threats taken
into consideration. In line with habitat suitability, zero sensitivity values were assigned to land-use
classes with a strong anthropogenic component and, therefore, considered less vulnerable to threats.
This process of value assignment comes from a qualitative expert interpretation of case-study-specific
features in land use. In this specific case study, the assessment aimed to highlight, on the one hand,
the greater suitability of the habitats included within the N2K site and, on the other hand, to amplify
the value of the threat assigned to the industrial areas present within the SNI perimeter. The criterion
was to transfer the overall approach of the research (comparing both the protected areas and the
national interest sites remediation policies) to input values of the analytical model in order to verify
the research hypothesis.Sustainability 2020, 12, 2928 7 of 16
For each threat, users have to assign the maximum influence distance (drmax ), which is to be
considered as the threshold over which the threat r no longer has any impact, and the distance-decay
function (linear or exponential):
dxy
!
irxy = 1 − if linear (3)
drmax
! !
2.99
irxy = exp − dxy if exponential. (4)
drmax
The advantage of using the InVEST HQ model stems not only from the possibility of representing
the cumulative impact of multiple threats in a spatially explicit way but also in adequately considering
the variability in the effects of each threat on different habitats (i.e., on each LULC) [40].
In general, a correct interpretation of the results should be achieved by following a joint reading of
both habitat quality and degradation maps. As a matter of fact, while the first map depends on LULC
and habitat characteristics and on the distribution and intensity of threats, the habitat degradation
(HD) map is useful to emphasize areas where cumulative impacts, by different threats, influence HQ.
With the same low HQ values, the HD map allows one to distinguish areas of poor naturalness (low H j
values) from those areas characterized by high habitat suitability and affected by a strong impact.
As this work aims to compare the positive effects of remediation actions, three scenarios were
formulated, based on the current trend (I scenario), medium (II scenario), and long-term (III scenario)
reclamation programs. According to MATTM, the polygons bounded and classified as sources of
pollution included by the SNI perimeter and corresponding to abandoned or still-active industrial
and production sites, are divided on the basis of the environmental remediation program progress.
For some sites (polygons) the reclamation plan has already been approved, while for others it has been
elaborated and formally submitted to the competent authority (MATTM) but is still not approved, so it
is fair to assume that the reclamation times will be longer. For this reason, the mid-term scenario was
created considering that only the sites (polygons) that correspond to approved remediation plans have
been reclaimed. The long-term scenario, on the other hand, analyzed the effects of the completely
reclaimed site. Both these scenarios (partial and total remediation) were compared to the current trend
in which the weight of the threats corresponding to these polygons takes on its maximum value.
The weights have a value between 0 (less important) and 1 (very important) and were assigned
on the basis of expert advice. The highest value was attributed to the industrial areas included within
the perimeter of the SNI considering that the effects of remediation have a weight reduction from
1 to 0.6 (a reduction of 40%). The hypothesis is that the remediation process cannot recover a full
degree of naturalness but has to render the environmental conditions of the sites comparable with
other industrial ones. The minimum value of 0.2 was assigned to residential buildings, which in the
study area correspond mainly to rural housing.
All the values used for threat definitions are summarized in the following table (Table 2). As can
be seen, the assessment made by the expert did not lead to any distinction between the decay functions
of the different threats. However, a relevant difference existed between the distances to which every
threat exerts its impact. drmax was in fact greater for the industrial areas included within the perimeter
of the SNI.Sustainability 2020, 12, 2928 8 of 16
Table 1. Sensitivity matrix in which the habitat suitability [0-1] for each land use/land cover (LULC) and the sensitivity of each habitat to the individual threat [0-1] is
reported. Habitat suitability Site of Community Interest/Special Protection Area (SCI/SPA) regards the LULC inside the SCI/SPA.
Sensitivity for each LULC
Residential Secondary Landfills and Green Renewable Energy Primary Industrial
Arable Land Woodlands Freshwaters Railways Grassland
Buildings Roads Mining Areas Areas Sources (RES) Roads Buildings
Habitat suitability 0,7 1 1 0,1 0,1 0,1 0,3 0,1 0,05 0,001 0,1 0,8
Habitat suitability (SCI/SPA) 0,8 1 1 0,1 0,1 0,1 0,4 0,1 0,05 0,001 0,1 0,9
Agriculture 0 0,6 0,4 0 0 0 0 0 0 0 0 0
Landfills and mining areas 0,6 1 1 0 0 0 0,3 0 0 0 0 0,6
Industrial buildings 0,6 0,8 0,9 0 0 0 0,5 0 0 0 0 0,7
RES fields 0,8 0,9 0,7 0 0 0 0,4 0 0 0 0 0,9
Residential buildings 0,6 1 0,8 0 0 0 0,4 0 0 0 0 0,6
Threats Primary roads 0,7 0,9 0,7 0 0 0 0,3 0 0 0 0 0,7
Secondary roads 0,6 0,7 0,5 0 0 0 0,4 0 0 0 0 0,6
Railways 0,7 0,9 0,7 0 0 0 0,3 0 0 0 0 0,7
Industrial areas with implemented
0,6 0,7 0,7 0,6 0,4 0,4 0,5 0,1 0,4 0,2 0,4 0,9
prevention measures
Industrial areas with reclamation
0,8 1 1 0,8 0,5 0,5 0,6 0,2 0,5 0,3 0,5 1
plan presented but not approved
Industrial areas with reclamation
0,8 1 1 0,8 0,5 0,5 0,6 0,2 0,5 0,3 0,5 1
plan approved
Table 2. Summary table of values used for threat definition.
Weight
Threat Maximum Influence Distance (drmax ) (Km) Distance-Decay Function
I Scenario II Scenario III Scenario
(Current Trend) (Mid-Term Scenario) (Long-Term Scenario)
Agriculture 1.5 exponential 0.3 0.3 0.3
Industrial Buildings 2 exponential 0.6 0.6 0.6
Landfills and mining areas 2 exponential 0.8 0.8 0.8
Primary roads 1 exponential 0.6 0.6 0.6
Secondary roads 0.6 exponential 0.4 0.4 0.4
Renewable energy sources (RES) farms 1 exponential 0.4 0.4 0.4
Railways 0.8 exponential 0.5 0.5 0.5
Residential buildings 1.5 exponential 0.2 0.2 0.2
Industrial areas with implemented
3 exponential 0.6 0.6 0.6
Industrial areas included by prevention measures
the SNI perimeter
Industrial areas with reclamation plan presented
3 exponential 1 1 0.6
but not approved
Industrial areas with reclamation plan approved 3 exponential 1 0.6 0.6Sustainability 2020, 12, 2928 9 of 16
Sustainability 2020, 12, x FOR PEER REVIEW 9 of 16
4. Results
The degradation
The effects of a complete remediation,
maps obtained for thewhich involves
current a total
trend and of three
some industrial
detailed boxesareas, were
showing more
partial
significant.and
(mid-term) Onetotal
area(long-term)
was located in the northern
remediation part respectively,
scenarios, of the SNI zone and thebelow
are shown other(Figure
two were in the
2). Color
immediate downstream area with respect to the SCI/SPA perimeter. The surface area involved
nuances represent the areas where the reclamation actions have a weaker (light red) or a greater effect in this
case was
(dark red).30.06 ha, equal to 0.04% of the entire study area.
Figure 2. Degradation
Figure 2. Degradation analysis: the large
analysis: the large figure
figure represents
represents the
the entire
entire study
study area
area in
in the
the current
current trend.
trend.
The
The detail boxes display three areas where, thanks to the greater proximity to industrial sites
detail boxes display three areas where, thanks to the greater proximity to industrial sites that
that
currently
currentlyconstitute
constituteaasource
sourceof
ofthreat,
threat,the
theeffects
effectsofofremediation
remediationmeasures
measuresare
aremore
morevisible.
visible.
Out of a total of 21 polygons (i.e., industrial areas) identified as sources of impact according to the
Figure 3, with respect to the difference in the degradation maps following partial and total
MATTM, the medium-term scenario showed the remediation effects of only one of these industrial
remediation related to the current situation, shows the areas where the benefits of the interventions
areas accounting for 3.71 ha. The degradation decrease was, therefore, rather localized and was not
are felt.
extended to the entire study area
The effects of a complete remediation, which involves a total of three industrial areas, were more
significant. One area was located in the northern part of the SNI zone and the other two were in the
immediate downstream area with respect to the SCI/SPA perimeter. The surface area involved in this
case was 30.06 ha, equal to 0.04% of the entire study area.Sustainability 2020, 12, 2928 10 of 16
Figure 3, with respect to the difference in the degradation maps following partial and total
remediation related to the current situation, shows the areas where the benefits of the interventions
Sustainability 2020, 12, x FOR PEER REVIEW 10 of 16
are felt.
Figure 3. Effects of the reclamation procedure: decrease of the degradation degree in mid-term (partial
Figure 3. Effects
reclamation) andof the reclamation
long-term procedure:
(total decrease
reclamation) of the degradation
scenarios. The figure degree
shows in mid-term
the effects, (partial
obtained by
reclamation)
difference, ofandthelong-term (totalforeseen
interventions reclamation) scenarios.
in the mediumThe andfigure shows scenario.
long-term the effects,While
obtained
the by
area of
difference, of the
influence for theinterventions foreseen scenario
partial remediation in the medium andlimited
is rather long-term scenario.toWhile
compared the area
the study of total
area,
influence
remediationfor has
the two
partial remediation
much scenario
larger areas is rather limited compared to the study area, total
of influence.
remediation has two much larger areas of influence.
In order to assess the variations following the implementation of a remediation program,
In order tochanges
the percentage assess the variations
were following
calculated the implementation
using map of a remediation program, the
algebra operations.
percentage changes were calculated using map algebra operations.
The maximum reduction in the degradation level (therefore corresponding to the long-term
The maximum
scenario) within the reduction
study areainwas
the6%,
degradation
whereas inlevel (thereforeterm,
the medium corresponding
a decrease to the long-term
of less than 1% could
scenario) within
be expected. the study area was 6%, whereas in the medium term, a decrease of less than 1%
could be expected.
Within the SCI/SPA site, the partial reclamation (mid-term scenario) had no effect on changes in
Within the SCI/SPA site, the partial reclamation (mid-term scenario) had no effect on changes in
habitat degradation or quality. Differently, in the southern part of the area, the degradation reduction
habitat degradation or quality. Differently, in the southern part of the area, the degradation reduction
reached 3% as its maximum value (Figure 4).
reached 3% as its maximum value (Figure 4).
By overlapping the results obtained in terms of the percentage degradation decrease and land-
use map, it appeared that the main beneficiaries of land reclamation interventions were mainly
riparian areas close to creeks (reduction in degradation degree up to 4%) and grazing grounds. OnSustainability 2020, 12, x FOR PEER REVIEW 11 of 16
Sustainability
the contrary, the12,
2020, 2928
wooded areas were affected to a lesser degree by the reclamation operations which,11 of 16
in these areas, led to a reduction of a maximum of 2%.
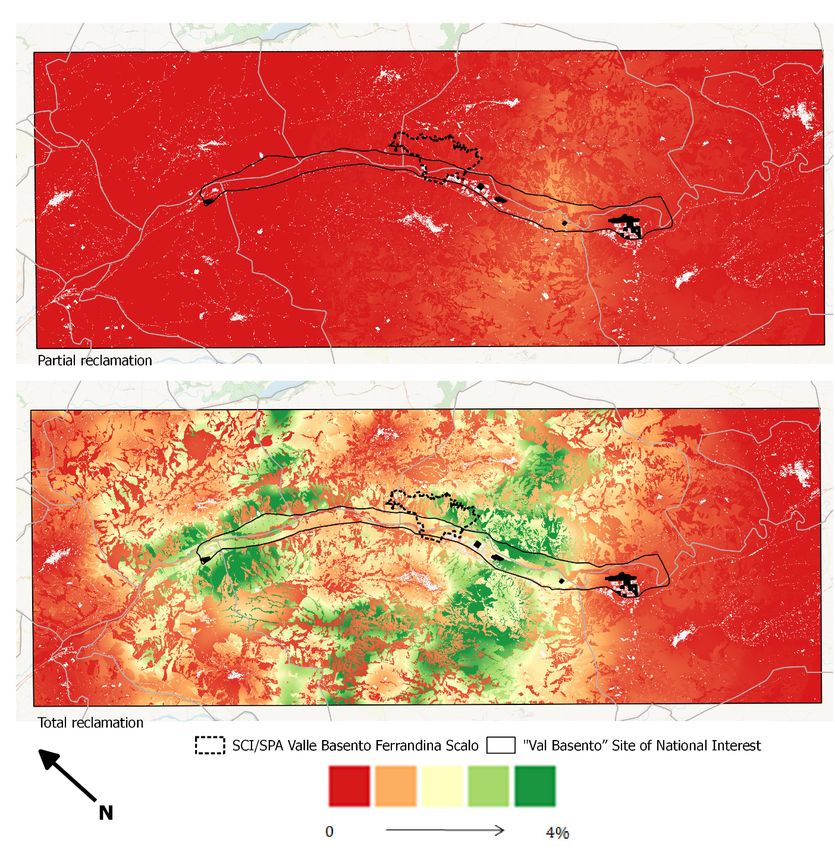
Figure 4. Percentage reduction in habitat degradation in mid-term (partial reclamation) and long-term
Figure 4. Percentage reduction in habitat degradation in mid-term (partial reclamation) and long-
(total reclamation) scenarios. It is possible to note that the effects of land reclamation were highly
term (total reclamation) scenarios. It is possible to note that the effects of land reclamation were highly
dependent on land use, with priority being given to meadows and grasslands. It is also possible to
dependent on land use, with priority being given to meadows and grasslands. It is also possible to
see that in areas where there are several threats that give rise to a cumulative impact, the effects of
see that in areas where there are several threats that give rise to a cumulative impact, the effects of
remediation were less significant. This was the case, for example, of the riparian areas close to the
remediation were less significant. This was the case, for example, of the riparian areas close to the
primary road and the railway line.
primary road and the railway line.
By overlapping the results obtained in terms of the percentage degradation decrease and land-use
5. Discussions
map, it appeared that the main beneficiaries of land reclamation interventions were mainly riparian
areasAn interpretation
close of the results
to creeks (reduction must take into
in degradation account
degree that
up to 4%)the model
and neglects
grazing the morphology
grounds. On the contrary,
of
the wooded areas were affected to a lesser degree by the reclamation operations which,are
the territory and, therefore, the privileged directions of pollutant diffusion. The results in linked
these areas,
to land-use class characteristics in terms of habitat suitability and vulnerability to different threats.
led to a reduction of a maximum of 2%.
Because it is, in actual fact, a valley riverbed with two converging sides, the expected spatial
distribution
5. Discussions of reclamation effects—all other variables being equal—is not isotropic as, however,
appears from the image. As a matter of fact, in the western part of the study area there is a sector
alongAn theinterpretation
slope where of the results
a relevant must take reduction
degradation into account that the model
is recorded, neglects
especially withthe morphology
respect to
of the territory and, therefore, the privileged directions of pollutant diffusion. The results are linked
to land-use class characteristics in terms of habitat suitability and vulnerability to different threats.
Because it is, in actual fact, a valley riverbed with two converging sides, the expected spatial distributionSustainability 2020, 12, 2928 12 of 16
of reclamation effects—all other variables being equal—is not isotropic as, however, appears from the
image. As a matter of fact, in the western part of the study area there is a sector along the slope where
a relevant degradation reduction is recorded, especially with respect to meadows, grazing grounds,
and agricultural crops. Moreover, no improvement in the wooded areas has been achieved, especially
where they2020,
Sustainability are 12,
surrounded
x FOR PEER by cultivated areas. This is due to the fact that agriculture is in itself
REVIEW a
12 of 16
source of threat, and the relevant reclamation effects are clearly marginal.
However,
meadows, in analyzing
grazing grounds, anddataagricultural
distributioncrops.
(Figure 5), it is evident
Moreover, that reclamation
no improvement effects areas
in the wooded have
ahas
positive impact on
been achieved, differentwhere
especially patches that,
they are in the long-term
surrounded scenario, areas.
by cultivated are included in the
This is due lowest
to the fact
degradation
that agriculture class.
is in itself a source of threat, and the relevant reclamation effects are clearly marginal.
Figure 5. Distribution of degradation values in relation to the three scenarios.
scenarios.
In attentively
However, analyzingdata
in analyzing the data, the partial
distribution (Figurereclamation (mid-term
5), it is evident scenario) haseffects
that reclamation an effect
haveona
apositive
portionimpact
of territory that is equal to 0.56% of the total area. In particular, the
on different patches that, in the long-term scenario, are included in the lowest classes that in the
current situation
degradation are characterized by a high degradation, move to the low (0.43%) and medium (0.13%)
class.
degradation classes. The long-term
In attentively analyzing the data,remediation
the partial scenario,
reclamation on (mid-term
the other hand, involves
scenario) 3.79%
has an effectofon
thea
total surface area which, from the higher degradation classes, shifts to the lowest degradation
portion of territory that is equal to 0.56% of the total area. In particular, the classes that in the current level.
The results
situation show that habitat
are characterized by a highdegradation
degradation,in the study
move toarea
the islowcertainly
(0.43%)dueandtomedium
the cumulative
(0.13%)
impact of multiple threats arising partially from the industrial area located
degradation classes. The long-term remediation scenario, on the other hand, involves 3.79% along one of the of main
the
regional road infrastructures and partially from the road and rail network that from
total surface area which, from the higher degradation classes, shifts to the lowest degradation level. the river valley
branches off along
The results the slopes,
show also bordering
that habitat degradation or crossing areasarea
in the study of high naturalness.
is certainly due to the cumulative
impact of multiple threats arising partially from the industrial area located along one of the main
6. Conclusions
regional road infrastructures and partially from the road and rail network that from the river valley
Although
branches the conservation
off along of biodiversity
the slopes, also bordering oris acrossing
priorityareas
on theofEuropean Union’s agenda, the results
high naturalness.
reached so far are still lagging behind the objectives set [22]. The need to achieve a better integration
6. Conclusions
between policies and stakeholders at all levels is highlighted with particular regard to the N2K
network [16].
Although the conservation of biodiversity is a priority on the European Union’s agenda, the
This work analyzes a case study where a strong contradiction in the management of the territory
results reached so far are still lagging behind the objectives set [22]. The need to achieve a better
emerges. On the one hand, the presence of industrial areas with high pollution potential has led
integration between policies and stakeholders at all levels is highlighted with particular regard to the
to the identification of a SNI whose remediation procedure is the direct responsibility of MATTM.
N2K network [16].
On the other hand, the recognition of naturalistic and biodiversity conservation values has led to
This work analyzes a case study where a strong contradiction in the management of the territory
the identification of a N2K site, whose management plan, approved in 2015, completely neglects the
emerges. On the one hand, the presence of industrial areas with high pollution potential has led to
presence of a SNI.
the identification of a SNI whose remediation procedure is the direct responsibility of MATTM. On
The aim of this work is to provide and test a methodology able to measure the effects of two
the other hand, the recognition of naturalistic and biodiversity conservation values has led to the
overlapping and conflicting policy frameworks: the first is oriented toward naturalness preservation
identification of a N2K site, whose management plan, approved in 2015, completely neglects the
(N2K) and the second aims at solving environmental contamination issues (SNI). Both policies
presence of a SNI.
substantially ignore each other and demonstrate a fragmentation in the territorial governance system,
The aim of this work is to provide and test a methodology able to measure the effects of two
where different authorities are responsible for specific fields of intervention.
overlapping and conflicting policy frameworks: the first is oriented toward naturalness preservation
(N2K) and the second aims at solving environmental contamination issues (SNI). Both policies
substantially ignore each other and demonstrate a fragmentation in the territorial governance system,
where different authorities are responsible for specific fields of intervention.
As already pointed out by the authors in previous works [47–51], the ES framework allows for
the integration and simultaneous consideration of multiple scales, multiple habitats, and multilevelSustainability 2020, 12, 2928 13 of 16
As already pointed out by the authors in previous works [47–51], the ES framework allows for
the integration and simultaneous consideration of multiple scales, multiple habitats, and multilevel
environmental policies, thus offering the advantage of more holistic environmental management [52].
Therefore, the use of the InVEST Habitat Quality model allowed us to contribute to the general
process for the provision of an effective territorial monitoring system, suitable to assess the effects
of ongoing threats and environmental management actions on habitat quality. Although the model
simplifies the complex reality linked to the phenomenon of pollutant diffusion, temporal and spatial
variability, boundary conditions, and more generally the complex dynamics with which threats act to
the detriment of habitat quality [46,53], it is useful to perform a scenario analysis in order to identify
threats and habitats with respect to land use, especially in those area in which information on species
abundance and composition, endemism, and functional significance is poor [40].
Considering the emerged strengths and weaknesses presented in the discussion section, future
research should deepen the proposed methodology that proves to be efficient in approaching the issue
of territorial governance by overcoming the limits of sectorial policy fragmentation. Therefore, further
developments will be oriented toward testing alternative tools so as to better model the remediation
processes in detail, including information on specific remediation actions (today not available) and
integration input data with additional layers, such as morphology, water quality, air pollution, noise
pollution, and evidence of climate-change effects.
The ES approach is considered adequate to deliver a common spatial evaluation framework in
order to achieve a better integration of territorial governance, which has been fragmented into different
decision centers (see also the work by Balletto et al. 2020 [54]). The proposed methodology should be
useful for the construction of a cognitive framework that supports a regional landscape plan which we
consider to be the appropriate planning level to manage such a contradictory case (SNI and SCI/SPA
overlapping). This planning level is still lacking in the Basilicata Region even if the Regional Planning
Law (23/99) foresees its development as a structural node in hierarchy planning.
Author Contributions: Conceptualization, A.P. and F.S.; methodology, F.S.; software, A.P.; validation, B.M., F.S.
and A.P.; formal analysis, L.S.; investigation, A.P.; resources, A.P. and L.S.; data curation, L.S.; writing—original
draft preparation, A.P. and L.S.; writing—review and editing, A.P. and F.S.; visualization, F.S.; supervision, F.S.
and B.M.; project administration, B.M.; funding acquisition, F.S. All authors have read and agreed to the published
version of the manuscript.
Funding: This research received no external funding.
Conflicts of Interest: Authors declare no conflict of interest. The funders had no role in the design of the study;
in the collection, analyses, or interpretation of data; in the writing of the manuscript, or in the decision to publish
the results.
References
1. IPBES. Summary for policymakers of the global assessment report on biodiversity and ecosystem services of
the Intergovernmental Science-Policy Platform on Biodiversity and Ecosystem Services. 2019. Available
online: https://ipbes.net/global-assessment. (accessed on 15 December 2019).
2. European Commission. Our life insurance, our natural capital: an EU biodiversity strategy to 2020. Landsc.
Ecol. Manag. 2015, 20, 37–40. Available online: https://ec.europa.eu/environment/nature/biodiversity/
comm2006/pdf/EP_resolution_april2012.pdf (accessed on 20 December 2019).
3. Cardinale, B.J.; Duffy, J.E.; Gonzalez, A.; Hooper, D.U.; Perrings, C.; Venail, P.; Narwani, A.; Mace, G.M.;
Tilman, D.; Wardle, D.A.; et al. Biodiversity loss and its impact on humanity. Nature 2012, 486, 59–67.
[CrossRef] [PubMed]
4. Oliver, T.H.; Isaac, N.J.B.; August, T.A.; Woodcock, B.A.; Roy, D.B.; Bullock, J.M. Declining resilience of
ecosystem functions under biodiversity loss. Nat. Commun. 2015, 6, 10122. [CrossRef] [PubMed]
5. Waldron, A.; Miller, D.C.; Redding, D.; Mooers, A.; Kuhn, T.S.; Nibbelink, N.; Roberts, J.T.; Tobias, J.A.;
Gittleman, J.L. Reductions in global biodiversity loss predicted from conservation spending. Nature 2017,
551, 364–367. [CrossRef]Sustainability 2020, 12, 2928 14 of 16
6. Kati, V.; Hovardas, T.; Dieterich, M.; Ibisch, P.L.; Mihok, B.; Selva, N. The challenge of implementing the
European network of protected areas Natura 2000. Conserv. Biol. 2015, 29, 260–270. [CrossRef]
7. Bastian, O. The role of biodiversity in supporting ecosystem services in Natura 2000 sites. Ecol. Indic. 2013,
24, 12–22. [CrossRef]
8. Doak, D.F.; Bakker, V.J.; Goldstein, B.E.; Hale, B. Tutorial reading 1—What is the future of conservation?
Trends Ecol. Evol. 2014, 29, 77–81. [CrossRef]
9. Donald, P.F.; Sanderson, F.J.; Burfield, I.J.; Bierman, S.M.; Gregory, R.D.; Waliczky, Z. International conservation
policy delivers benefits for birds in Europe. Science 2007, 317, 810–813. [CrossRef]
10. Jaeger, J.A.G.; Madrinán, L.F.; Soukup, T.; Schwick, C.; Kienast, F. Landscape fragmentation in Europe (EEA
Report, Report No.: 2). Copenhagen, EEA: Bern: Federal Office for the Environment FOEN, European
Environment Agency EEA. 2011. Available online: https://www.eea.europa.eu/publications/landscape-
fragmentation-in-europe (accessed on 20 December 2019).
11. European Environment Agency. EU 2010 Biodiversity Baseline. Post-2010 EU biodiversity policy;
Luxembourg. 2010. Available online: https://www.eea.europa.eu/publications/eu-2010-biodiversity-baseline
(accessed on 20 December 2019).
12. Nolte, C.; Leverington, F.; Kettner, A. Protected area management effectiveness assessments in Europe;
Bundesamt für Naturschutz (BfN) Federal Agency for Nature Conservation: Bonn, Germany, 2010;
ISBN 978-3-89624-006-4.
13. Brambilla, M.; Bergero, V.; Bassi, E.; Falco, R. Current and future effectiveness of Natura 2000 network in the
central Alps for the conservation of mountain forest owl species in a warming climate. Eur. J. Wildl. Res.
2015, 61, 35–44. [CrossRef]
14. Dimitrakopoulos, P.G.; Memtsas, D.; Troumbis, A.Y. Questioning the effectiveness of the Natura 2000 Special
Areas of Conservation strategy: The case of Crete. Glob. Ecol. Biogeogr. 2004, 13, 199–207. [CrossRef]
15. Pellegrino, D.; Schirpke, U.; Marino, D. How to support the effective management of Natura 2000 sites?
J. Environ. Plan. Manag. 2017, 60, 383–398. [CrossRef]
16. Beunen, R.; de Vries, J.R. The governance of Natura 2000 sites: The importance of initial choices in the
organisation of planning processes. J. Environ. Plan. Manag. 2011, 54, 1041–1059. [CrossRef]
17. Dudley, N.; Jo Mulongoy, K.; Cohen, S.; Stolton, S.; Victor Barber, C.; Babu Gidda, S.; Nigel Dudley, C. Towards
Effective Protected Area Systems. An Action Guide to Implement the Convention on Biological Diversity Programme
of Work on Protected Areas; Secretariat of the Convention on Biological Diversity: Montreal, CA, USA, 2005;
Volume 108.
18. Achim Steiner, J.M. The World’s protected areas: Status, values and prospects in the 21st century. Choice Rev.
Online 2009, 46, 3865.
19. Apostolopoulou, E.; Drakou, E.G.; Pediaditi, K. Participation in the management of Greek Natura 2000 sites:
Evidence from a cross-level analysis. J. Environ. Manag. 2012, 113, 308–318. [CrossRef] [PubMed]
20. Winkel, G.; Blondet, M.; Borrass, L.; Frei, T.; Geitzenauer, M.; Gruppe, A.; Jump, A.; de Koning, J.; Sotirov, M.;
Weiss, G.; et al. The implementation of Natura 2000 in forests: A trans- and interdisciplinary assessment of
challenges and choices. Environ. Sci. Policy 2015, 52, 23–32. [CrossRef]
21. Stringer, L.C.; Paavola, J. Participation in environmental conservation and protected area management in
Romania: A review of three case studies. Environ. Conserv. 2013, 40, 138–146. [CrossRef]
22. Natura 2000 and Spatial Planning. Final report for the European Commission (DG ENV) (Project
07.0202/2015/716477/ETU/ENV. B.3). Available online: https://www.wur.nl/upload_mm/9/5/2/7368439e-
42ea-427a-8aec-f5d7d5827442_02635_Natura%202000_V5.pdf (accessed on 20 December 2019).
23. Leone, F.; Zoppi, C.; Leone, F.; Zoppi, C. Conservation Measures and Loss of Ecosystem Services: A Study
Concerning the Sardinian Natura 2000 Network. Sustainability 2016, 8, 1061. [CrossRef]
24. La Notte, A.; D’Amato, D.; Mäkinen, H.; Paracchini, M.L.; Liquete, C.; Egoh, B.; Geneletti, D.; Crossman, N.D.
Ecosystem services classification: A systems ecology perspective of the cascade framework. Ecol. Indic. 2017,
74, 392–402. [CrossRef]
25. Costanza, R.; de Groot, R.; Braat, L.; Kubiszewski, I.; Fioramonti, L.; Sutton, P.; Farber, S.; Grasso, M. Twenty
years of ecosystem services: How far have we come and how far do we still need to go? Ecosyst. Serv. 2017,
28, 1–16. [CrossRef]
26. Alcamo, J.; Bennett, E.M. Millennium Ecosystem Assessment (Program). Ecosystems and Human Well-Being:
A Framework for Assessment; Island Press: Washington, DC, USA, 2003; ISBN 9781559634038.Sustainability 2020, 12, 2928 15 of 16
27. Ten Brink, P. The Economics of Ecosystems and Biodiversity in National and International Policy Making; Patrick
ten Brink: Earthscan, London and Washingtonk, UK, 2012; ISBN 9781849775496.
28. Haines-Young, R.; Potschin, M. Common International Classification of Ecosystem Services (CICES) V5.1
Guidance on the Application of the Revised Structure; Barton in Fabis, Nottingham, NG11 0AE, U. 2018.
Available online: https://cices.eu/content/uploads/sites/8/2018/01/Guidance-V51-01012018.pdf (accessed on
20 December 2019).
29. Arcidiacono, A.; Ronchi, S.; Salata, S. Ecosystem Services Assessment Using InVEST as a Tool to Support
Decision Making Process: Critical Issues and Opportunities. Lect. Notes Comput. Sci. (including Subser. Lect.
Notes Artif. Intell. Lect. Notes Bioinformatics) 2015, 9158, 35–49.
30. Documenti Sullo Stato di Avanzamento delle Procedure di Bonifica Ministero dell’Ambiente e della Tutela
del Territorio e del Mare. Available online: https://www.minambiente.it/bonifiche/documenti-sullo-stato-di-
avanzamento-delle-procedure-di-bonifica (accessed on 20 December 2019).
31. Hooper, D.U.; Adair, E.C.; Cardinale, B.J.; Byrnes, J.E.K.; Hungate, B.A.; Matulich, K.L.; Gonzalez, A.;
Duffy, J.E.; Gamfeldt, L.; O’Connor, M.I. A global synthesis reveals biodiversity loss as a major driver of
ecosystem change. Nature 2012, 486, 105–108. [CrossRef]
32. Cortina, C.; Boggia, A. Development of policies for Natura 2000 sites: A multi-criteria approach to support
decision makers. J. Environ. Manag. 2014, 141, 138–145. [CrossRef] [PubMed]
33. Friedrichs, M.; Hermoso, V.; Bremerich, V.; Langhans, S.D. Evaluation of habitat protection under the
European Natura 2000 conservation network—The example for Germany. PLoS ONE 2018, 13, e0208264.
[CrossRef] [PubMed]
34. Mace, G.M.; Norris, K.; Fitter, A.H. Biodiversity and ecosystem services: A multilayered relationship. Trends
Ecol. Evol. 2012, 27, 19–26. [CrossRef] [PubMed]
35. Hansen, R.; Pauleit, S. From multifunctionality to multiple ecosystem services? A conceptual framework for
multifunctionality in green infrastructure planning for Urban Areas. Ambio 2014, 43, 516–529. [CrossRef]
[PubMed]
36. Haase, D.; Schwarz, N.; Strohbach, M.; Kroll, F.; Seppelt, R. Synergies, Trade-offs, and Losses of Ecosystem
Services in Urban Regions: An Integrated Multiscale Framework Applied to the Leipzig-Halle Region,
Germany. Ecol. Soc. 2012, 17, art22. [CrossRef]
37. Chan, K.M.A.; Satterfield, T.; Goldstein, J. Rethinking ecosystem services to better address and navigate
cultural values. Ecol. Econ. 2012, 74, 8–18. [CrossRef]
38. Sallustio, L.; De Toni, A.; Strollo, A.; Di Febbraro, M.; Gissi, E.; Casella, L.; Geneletti, D.; Munafò, M.;
Vizzarri, M.; Marchetti, M. Assessing habitat quality in relation to the spatial distribution of protected areas
in Italy. J. Environ. Manag. 2017, 201, 129–137. [CrossRef]
39. Gao, Y.; Ma, L.; Liu, J.; Zhuang, Z.; Huang, Q.; Li, M. Constructing Ecological Networks Based on Habitat
Quality Assessment: A Case Study of Changzhou, China. Sci. Rep. 2017, 7, 46073. [CrossRef]
40. Terrado, M.; Sabater, S.; Chaplin-Kramer, B.; Mandle, L.; Ziv, G.; Acuña, V. Model development for the
assessment of terrestrial and aquatic habitat quality in conservation planning. Sci. Total Environ. 2016, 540,
63–70. [CrossRef]
41. Scorza, F.; Pilogallo, A.; Saganeiti, L.; Murgante, B.; Pontrandolfi, P. Comparing the territorial performances
of Renewable Energy Sources’ plants with an integrated Ecosystem Services loss assessment: A case study
from the Basilicata region (Italy). Sustain. Cities Soc. 2020, 56, 102082. [CrossRef]
42. The Natural Capital Project Habitat Quality—InVEST 3.6.0 Documentation. Available online: http:
//data.naturalcapitalproject.org/nightly-build/invest-users-guide/html/habitat_quality.html (accessed on
13 November 2019).
43. Aneseyee, A.B.; Noszczyk, T.; Soromessa, T.; Elias, E. The InVEST Habitat Quality Model Associated with
Land Use/Cover Changes: A Qualitative Case Study of the Winike Watershed in the Omo-Gibe Basin,
Southwest Ethiopia. Remote Sens. 2020, 12, 1103. [CrossRef]
44. Golden, H.E.; Lane, C.R.; Amatya, D.M.; Bandilla, K.W.; Raanan Kiperwas, H.; Knightes, C.D.; Ssegane, H.;
Lüke, A.; Hack, J.; Brauman, K.A.; et al. The Use of Scenario Analysis to Assess Water Ecosystem Services in
Response to Future Land Use Change in the Willamette River Basin, Oregon. J. Environ. Manag. 2014, 53,
4–14.You can also read