Natural Gas and Ukraine's Energy Future - Ukraine Policy Dialogue
←
→
Page content transcription
If your browser does not render page correctly, please read the page content below
IHS CERA
                                                     February 2012
   Ministry of Energy and Coal Industry of Ukraine

   SPECIAL REPORT

   Natural Gas and Ukraine’s Energy Future
   Ukraine Policy Dialogue

3448_0711PB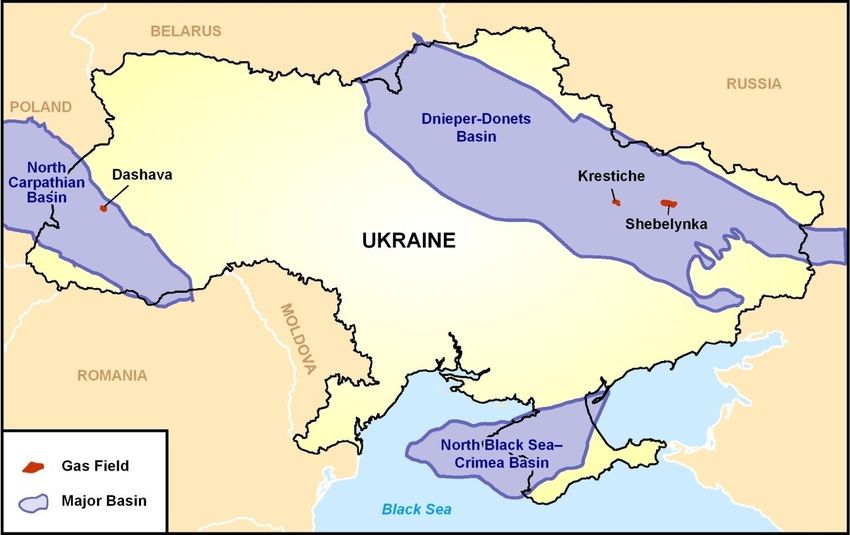
TERMS OF USE. The accompanying materials were prepared by IHS CERA Inc. (hereafter IHS CERA) and are not
to be redistributed without prior written consent. IHS CERA content and information, including but not limited to
graphs, charts, tables, figures, and data, are not to be reprinted or redistributed without prior written permission from
IHS CERA. Content distributed or reprinted must display IHS CERA’s legal notices and attributions of authorship. IHS
CERA provides the materials “as is” and does not guarantee or warrant the correctness, completeness or
currentness, merchantability, or fitness for a particular purpose. All warranties of which are hereby expressly
disclaimed and negated. To the extent permissible under the governing law, in no event will IHS CERA be liable for
any direct, indirect, special, incidental, lost profit, lost royalties, lost data, punitive, and/or consequential damages,
even if advised of the possibility of same.

                                                                © IHS, 2012
           No portion of this report may be reproduced, reused, or otherwise distributed in any form without prior written consent.
IHS CERA & Ministry of Energy and Coal
Industry of Ukraine would like to acknowledge
and thank our Premium Partners in supporting
the Ukraine Policy Dialogue Initiative

IHS CERA & Ministry of Energy and Coal
Industry of Ukraine would like to acknowledge
and thank our Premium Partners in supporting
the Ukraine Policy Dialogue Initiative

IHS CERA & Ministry of Energy and Coal
Industry of Ukraine would like to acknowledge
and thank our Standard Partners in supporting
the Ukraine Policy Dialogue Initiative

Ukraine Special Report                                                                Natural Gas and Ukraine’s Energy Future

                            Ukraine Special Report:
                    Natural Gas and Ukraine’s Energy Future

                                         EXECUTIVE SUMMARY
    At the request of Ukraine’s Ministry of Energy and Coal Industry, IHS CERA has carried
out an intensive six-month program of research, consultation, and analysis in order to help all
stakeholders develop a shared understanding of the specific challenges and opportunities
presented by Ukraine’s natural gas industry. This has allowed participants to begin
developing some policy concepts that could help Ukraine realize its full potential in this
sector in partnership with both domestic and foreign investors.
    This Executive Summary outlines the main conclusions of the Special Report as well the
as the specific policy recommendations that have emerged from the dialogue.
    The overriding insight of the study program is that Ukraine has the potential to transform
its natural gas industry by enacting the right policies. The geological potential exists for
Ukraine to produce much larger volumes of gas than it does today and, with the right
demand-side measures, even to reach self-sufficiency in natural gas. Achieving this goal will
only be possible, however, with much larger flows of investment into gas exploration and
development—and this investment can be expected only if today’s industry structure and
regulatory climate are reformed to attract private sector involvement from both domestic and
international sources.

Executive Summary                                                                                                                                   1
       © 2012 IHS        No portion of this report may be reproduced, reused, or otherwise distributed in any form without prior written consent.
Ukraine Special Report Natural Gas and Ukraine’s Energy Future
Hydrocarbon Resource Assessment
It is clear that Ukraine’s natural gas resource potential is very large—certainly much
larger than commonly perceived. Although IHS CERA has not carried out a detailed,
independent technical resource assessment, we have applied our own international experience
as well as our methodologies for assessing so-called yet-to-find resources to data and
analyses obtained from a variety of sources, including IHS proprietary databases and official
data provided by Naftogaz of Ukraine and the government of Ukraine.
Ukraine’s gas potential will be produced from several distinct sources:
Advanced recovery from fields already in production
Development of discoveries currently considered marginal
Exploration for new accumulations within existing conventional plays or in new
areas of southern Ukraine, including the offshore Black Sea
Tight gas sands, i.e., reservoirs with substantial resources but extremely low
permeability
Unconventional gas resources, including both shale gas and coalbed methane
(CBM)
Regardless of the source, Ukraine’s ability to achieve its potential—or even to scratch the
surface—will depend heavily on the extent to which modern technologies for seismic
evaluation, drilling, completion, well stimulation, and production management are applied.
This, in turn, will depend mainly on the attractiveness of the investment climate for
exploration and production (E&P).
IHS CERA has generated an indicative gas production profile for Ukraine through 2035
under a scenario in which modern technologies are gradually but comprehensively applied
(see Figure ES-1). This production profile does not rely on particularly aggressive
assumptions from a geological point of view, but it does require that investment in upstream
gas development grows from present levels of approximately $1 billion annually to levels
approaching $10 billion annually.
Figure ES-1
Projected Production Profile 2012–35
80
70
Unconventionals
60
Base Case
50
Tight Gas
Annual 40 Reservoirs
Production
(Bcm) 30
New Resource
20 Development
10 Existing Fields
(decline)
0
2005 2010 2015 2020 2025 2030 2035
Source: IHS CERA.
2 Executive Summary
©2012 IHS No portion of this report may be reproduced, reused, or otherwise distributed in any form without prior written consent.Ukraine Special Report Natural Gas and Ukraine’s Energy Future
This production scenario is characterized by the following underlying trends and
estimates:
The incipient decline of conventional gas production in Ukraine is reversed by 2015
on the basis of major investment, including from foreign investors, along with the
application of modern upstream technologies. This results in new production of
about 14 billion cubic meters (Bcm) per year by 2025 and 26 Bcm per year by
2035. High levels of investment activity should gradually convert conventional gas
resources that are today considered contingent or prospective into proven reserves.
Tight gas development starts slowly but achieves production levels of 9 Bcm per
year by 2025 and 16 Bcm per year by 2035.
Evaluation, appraisal, and development of unconventional gas resources result in
the achievement of a production plateau of 25 Bcm per year soon after 2025. It is
this component of Ukraine’s gas potential that carries with it the highest level of
uncertainty; IHS CERA has developed several scenarios for shale gas and CBM
production based on varying estimates of formation productivity and other factors.
The scenario that has been incorporated into the indicative production profile is a
reasonable reference case.
Ukraine’s Gas Transportation System
Ukraine’s extensive gas transportation system, which includes nearly 40,000 kilometers
of transmission pipeline and 74 compressor stations along with 32 Bcm of active storage
capacity—which is at present bundled with the pipeline system in terms of ownership and
operations—is a core asset for Ukraine in terms of both its strategic importance and its
economic value.
The flow of Russian transit gas through Ukraine’s trunk pipelines has declined in recent
years both in absolute terms and as a percentage of total Russian exports to Europe. IHS
CERA expects transit volumes to continue their decline in the medium term with the start-up
of the Nord Stream pipeline, and then to stabilize toward the end of the present decade, with
slow growth possible after 2020.
It is an appropriate goal for Ukrainian policy to reinforce the central importance of the
transit system for Russian gas exports and European gas supply. One mechanism that has
been proposed in this regard is transfer of trunk pipeline ownership and operations to a
Ukraine-led multilateral consortium in which both Russian and European companies would
take a minority shareholding. Such an arrangement would require consensus on a wide range
of legal and commercial issues.
Ukraine’s Domestic Gas Market—Pricing, Consumption, and Indigenous
Production
Ukraine’s domestic gas market was designed for an era of cheap gas that no longer exists.
Not only does the current gas market structure result in large and sustained financial losses
for the state, not to mention inevitable complications in the relationship with Ukraine’s main
gas supplier, but it also acts as a disincentive to investment in new gas development. For
these reasons, IHS CERA believes the status quo is no longer sustainable.
The sector is dominated by Naftogaz of Ukraine, a 100% state-owned entity, which
through a network of subsidiaries is the leading or only player in all major areas of the natural
gas industry: production, import, transportation, storage, distribution, and sales. Price
regulation is mainly the responsibility of the National Electricity Regulatory Committee
(NERC).
Executive Summary 3
© 2012 IHS No portion of this report may be reproduced, reused, or otherwise distributed in any form without prior written consent.Ukraine Special Report Natural Gas and Ukraine’s Energy Future
Ukraine’s domestic gas market of approximately 55 Bcm annually (not including pipeline
system use and losses) is divided into three categories:
Industrial customers—a group which by NERC definition includes the power
generation sector—make up about 45% of the market. Users in this category pay
prices that fully reflect the cost of imported gas.
Residential customers make up about 35% of the market, and pay a regulated price
which, although it has increased significantly in the past three years, remains very
low by European standards. This price is notionally linked with the supply cost of
gas produced domestically by Naftogaz’s affiliates.
District heating utilities account for the remaining 20% of demand and pay a
blended price reflecting both import prices and supply costs for domestic gas.
The recent history of gas demand and pricing is shown in Figure ES-2.
Figure ES-2
Gas Deliveries by Category of User, 2000–10
90 450
76.3 75.8 76.4
80 74.0 400
73.4
70.5 69.8 69.9
8.3 8.8 8.7 66.4
70 8.3 8.2 350
7.6 8.1 7.2
57.7 59.3
7.2
60 8.6 14.4 13.9 13.7 300
12.9
10.8 10.5 52.0
5.3
$/Mcm with VAT
12.8 10.1 5.3
50 5.8 10.9
250
17.2 11.1
Bcm
18.0 17.1 18.0 17.1
17.3 18.9
40 10.2 200
38.3 17.0 17.6
35.0 32.9 17.4
33.8 34.5 34.9 34.1
30.9 30.5 17.6
30 150
16.8
24.7
22.7
20 100
18.4
10 50
0 0
2000 2001 2002 2003 2004 2005 2006 2007 2008 2009 2010 1H2011
Internal Use by Gas Sector* Heat Producers**
Budgetary Organizations Population
Other Chemicals
Metals and Mining Power Sector
Total Industry, Total
Gas Price for Industry, Rhs Gas Price for Population, Rhs
Gas Price for District Heating, Rhs
Source: IHS CERA.
*Includes internal gas use by transporting, distributing, and gas-producting companies.
**For the needs of population, budgetary organizations, and other residential users.
4 Executive Summary
©2012 IHS No portion of this report may be reproduced, reused, or otherwise distributed in any form without prior written consent.Ukraine Special Report Natural Gas and Ukraine’s Energy Future
The present market structure is not sustainable for the following reasons:
Structural financial losses. The district heating sector continues to pay a low
“blended” price even though it is being supplied notionally with purely imported
gas; this arrangement results in losses to Naftogaz of as much as $2.5 billion
annually.
High import prices. Prices in many European contracts for import of Russian gas
have been revised downward in the past two years, while Ukraine’s January 2009
contract terms have not changed in parallel. As a result, Ukraine’s average import
price for Russian gas now exceeds the export parity value of this gas, which is to
say, it is significantly higher than the German border price minus transit costs from
Ukraine to Germany.
Disincentives to upstream investment. The regulated prices established for gas
produced by Naftogaz and its affiliates are much lower than prices for imported
gas, and too low to justify new investment under most circumstances. Domestic
production is in decline as a result.
Demand Outlook
Although Ukrainian industry has reduced its gas consumption significantly in recent years
under the pressure of rising prices, IHS CERA sees substantial further potential for greater
increases in energy efficiency. In particular, the chemicals sector (consuming 8 to 8.5 Bcm
annually at present) could reduce its use of gas by 2 Bcm per year while maintaining its
current output, and the metals sector (with consumption of roughly 9 Bcm annually) could
similarly cut consumption by nearly 4 Bcm per year.
Meanwhile, higher prices for the residential sector would also lead to some greater
efficiency and reduced demand. However, there is limited potential for reducing demand
elsewhere, and economic growth will tend to have some upward effect on gas consumption.
IHS CERA has developed alternative scenarios for Ukrainian gas demand. In the highest
case, demand grows to 73 Bcm by 2030; in the lowest case, it declines to 55 Bcm. In the base
case scenario, however, Ukrainian consumption of gas will be flat or show very slight growth
during this period as efficiency improvements in some sectors offset growing demand in
others.
Supply Outlook
One area of growth in Ukrainian gas production in recent years has been the small share
of production (just 8%) controlled by independent producers, which are allowed to sell gas
domestically at an unregulated price. More investment here is possible if the investment
climate is perceived to be stable and fair; however, under present circumstances this will
remain just a small component of overall gas production and will at best make up for
declining Naftogaz production.
The prospects of a more significant boost in Ukrainian domestic gas supply depend
entirely on a more radical change in the environment for investment in gas development,
including reform of the state sector as well as pricing reform.
The Regulatory Environment
Although Ukrainian legislation affecting the gas sector has fostered many positive
changes in the past 18 months, the overall regulatory environment for investors remains
complex and extremely challenging.
Executive Summary 5
© 2012 IHS No portion of this report may be reproduced, reused, or otherwise distributed in any form without prior written consent.Ukraine Special Report Natural Gas and Ukraine’s Energy Future
The permitting process for E&P (for oil as well as gas) has changed frequently in
the past three years, creating an overall sense of legal and regulatory instability.
Meanwhile, the overall permitting framework contains flaws and ambiguities that
risk leading investors to the conclusion that full compliance is time-consuming at
best and impossible at worst.
Customs clearance procedures for imported equipment are cumbersome and
expensive, and add to upstream development costs; any benefit in terms of local
content is outweighed by the negative impact of reduced upstream investment and
development.
The new Law “On the Principles of the Functioning of the Natural Gas
Market,” which was adopted in July 2010 as a condition of accession to the Energy
Community—an EU-backed multilateral organization—represents a step forward.
However, in many areas the law lacks specific implementation mechanisms and
fails to define clearly a “transition period” during which provisions will be phased
in. Furthermore the Law continues the practice of regulated pricing for wholly or
partly state-owned gas producers.
The European Gas Market
The events of the past three years have put the traditional structures of the European gas
market under great stress. In the economic recession of 2009, European gas demand declined
sharply just as the global liquefied natural gas market became oversupplied. This resulted in a
large pricing differential between gas delivered at (high) oil-linked prices under long-term
contracts on the one hand and the (low) spot prices for gas traded at the Continent’s emerging
hubs on the other.
This situation put enormous pressure on the long-term contracts that have long formed the
basis for Gazprom’s sales into Europe—not to mention huge financial pressure on the
traditional leading companies of the European gas midstream, which found themselves
buying gas at high prices and selling it at low prices. Although the market has largely
returned to balance in 2011, it is clear that the European gas industry has changed in some
fundamental ways, most notably with the growing relevance of traded market prices for gas.
These developments are not, however, likely to have a major impact on Ukraine’s
position with respect to the European gas market. Some key elements of the market should
remain relatively stable going forward.
Demand growth to continue. First, European import of gas is very likely to
continue growing over time because of slow but steady demand growth as well as
declining indigenous production. It is true that Europe has considerable potential
for production of shale gas and CBM. But for reasons of cost and politics, IHS
CERA believes that unconventional gas will emerge more gradually in Europe than
in North America.
Russia a main supplier. Second, Russia will remain a major source of gas for
Europe imports under any scenario; and indeed in most scenarios European imports
of Russian gas will continue to grow over time.
Radical scenarios in which European gas demand begins to decline sharply as a result of a
major focus on renewable energy and efficiency, or where an explosive shale gas boom (in
Poland and elsewhere) displaces Russian gas, are theoretically possible but unlikely.
These conclusions highlight again the relevance of the Ukrainian pipeline system for
Europe as well as Russia, even in the context of declining transit volumes.
6 Executive Summary
©2012 IHS No portion of this report may be reproduced, reused, or otherwise distributed in any form without prior written consent.Ukraine Special Report Natural Gas and Ukraine’s Energy Future
Benchmarking Analysis of Ukraine and Other Competing International
Opportunities
IHS CERA has undertaken a comparative review of Ukraine as a destination for
investment in E&P, taking into account a wide range of parameters including average field
characteristics, capital and operating costs, and fiscal terms. The IHS proprietary databases
were used to review a total of 30 conventional gas plays and 26 unconventional gas plays for
comparison.
Overall, Ukraine did not fare particularly well in comparison to the other plays
considered, largely because of its relatively unattractive fiscal terms in the context of the
commercial environment for marketing the produced gas.
Recommendations for the Future
The following specific policy recommendations emerged from the dialogue. Taken
together, IHS CERA would expect that the implementation of policies along the lines
described in this Special Report would attract substantial new investment to the Ukrainian
gas sector and help Ukraine achieve the promise of its potential natural gas resources.
Industry Structure
Ukraine can benefit from the vertical unbundling of the gas sector by restructuring the
current integrated industry into distinct segments:
An upstream segment that will build on today’s semicompetitive playing field to
become fully competitive in the context of stronger and clearer regulation
A downstream segment comprising distribution and marketing into which more
competition can gradually be introduced
A midstream segment—transportation and storage—that could remain as a
regulated monopoly for the time being (although storage could be spun off as well).
Upstream
A target of attracting up to $10 billion of investment annually into the upstream will
likely require a revamp of the terms under which foreign or domestic investors can invest in
the exploration and development of natural gas (as well as oil). This could include the
following reforms:
Changes to permitting including greater duration and acreage for license awards, a
strong preference for issuing combined special permits for E&P, and in general
more streamlined permitting procedures
Strengthening the stability of properly obtained permits and introducing robust
procedures for smooth conversion of existing exploration permits into production
permits
Increasing significantly the time allowed for submission of bidding documents at
license auctions
Developing special rules for unconventional gas E&P because of the inherent
differences relative to conventional gas development
Making access to exploration data easier
Simplifying procedures for importing equipment and reducing customs duties on
new technology for E&P
Executive Summary 7
© 2012 IHS No portion of this report may be reproduced, reused, or otherwise distributed in any form without prior written consent.Ukraine Special Report Natural Gas and Ukraine’s Energy Future
Implementing an internationally competitive system of upstream taxation—
necessary (but not sufficient) condition for meeting Ukraine’s investment needs.
Such a regime would combine a relatively low royalty (no more than 10% of sale
price) with profit-based taxation. This tax-and-royalty approach could be
complemented with an alternative system based on production-sharing agreements
for larger, more difficult projects (for instance, those offshore).
Downstream
In terms of the domestic gas market, full implementation of the 2010 law on Principles of
Functioning of the Natural Gas Market is a good first step, but there is a need to go further in
some areas:
The principle of free choice of suppliers for consumers will provide strong
leverage for squeezing costs out of the supply chain and ultimately lead to lower
prices for end users.
Secondary legislation will be required to implement the principle of
nondiscriminatory access to the gas transportation system as well as storage
facilities.
Price liberalization will ultimately remove distortions caused by regulation. The
extent of this liberalization should lie in a range of outcomes:
At a maximum, this would include full price liberalization for all
categories of customers, combined with financial support for vulnerable
categories of consumers (which could be financed by upstream royalties).
As a minimum first step, regulated prices for sales to district heating
utilities would be increased to reflect the actual cost of gas acquisition in
order to make Naftogaz financially sustainable.
Ukraine’s greatest challenge is that there is only a limited track record of international
private-sector investors participating in its E&P sector and achieving commercial success.
This lack of visible success stories along with the complex regulatory environment have
created the perception Ukraine is a difficult place in which to invest in gas development.
Adopting the recommendations arising from this dialogue and study program will not
alter perceptions immediately. But the experience of other countries following this path
suggests that a goal of self-sufficiency in natural gas could be achieved through Ukraine’s
consistent and patient application of the policy prescriptions laid out in this Special Report.
8 Executive Summary
©2012 IHS No portion of this report may be reproduced, reused, or otherwise distributed in any form without prior written consent.Ukraine Special Report Natural Gas and Ukraine’s Energy Future
CHAPTER 1: HYDROCARBON RESOURCE ASSESSMENT
Introduction
This section provides a high-level overview of the current status and potential of
Ukraine's conventional and unconventional gas resources, in order to characterize the
development opportunities that can be encouraged by future energy policy. This overview
makes use of data and insights provided by Naftogaz of Ukraine and the government of
Ukraine as well as IHS CERA and publicly available data on historical production and gas
resources and reserves. IHS CERA has applied its judgments based on international
experience, particularly for areas in which specific data for Ukraine was limited. It is
important to highlight that this study is intended to provide an overview only and does not
amount to a full, independent technical assessment of Ukraine's gas resources.
Undoubtedly, Ukraine has vast resource potential divided among three areas: existing
producing areas in the east and west of the country, new areas including the South as well as
the Ukrainian sector of the Black Sea, and finally the country's largely unexplored
unconventional reservoirs. The Ukrainian government estimates remaining conventional gas
resources at 5.37 trillion cubic meters (Tcm), a large portion of which is characterized as
prospective resources. For comparison, there are 2.6 Tcm of remaining resources in the
highly mature onshore and offshore areas of the Netherlands and the United Kingdom, and
about 3 Tcm remaining in offshore Norway. Meanwhile, estimates for the commercial
potential of Ukraine's unconventional shale gas vary widely from 1.2 Tcm in a recent US
study to IHS CERA’s own estimate of 11.5 Tcm.
In this study, a variety of potential upstream investment opportunities have been
identified for both conventional and unconventional resources. These opportunities can be
categorized broadly as follows:
Further development of existing fields. Ukraine has large gas resources in fields
that have been producing for decades but which have seen limited investment since
independence. These fields could potentially yield new resources through the
application of production optimization, gas compression, infill drilling, and
development of small pools as satellites.
Development of recent discoveries and economically marginal fields. Here also
the broader application of new technologies, including 3D seismic, could have a
strong impact.
Exploration within known conventional plays, for instance, stratigraphic and
lithological traps or salt tectonic complexes, where broader application of new
technology could bring major benefits.
Exploration in new plays which are yet to be identified or fully defined. These
include deep plays and in particular the deeper offshore sectors of the Black Sea,
which could contain large undiscovered potential.
Tight gas sands. These structures pose a technical challenge because of their low
permeability. However, commercial exploitation of such resources, if their
commercial potential can be proven, would again benefit enormously from modern
technology such as hydraulic fracturing which has only just started to be used
widely in Ukraine.
Unconventional resources (shale gas and coalbed methane [CBM]).
Unconventional gas clearly offers major opportunities for increased gas production
Chapter 1 1-1
© IHS, 2012 No portion of this report may be reproduced, reused, or otherwise distributed in any form without prior written consent.Natural Gas and Ukraine’s Energy Future Ukraine Special Report
in the Ukraine if the lessons of the US unconventional gas boom can be applied and
if geological potential can be developed into a commercial resource.
The rest of this section summarizes the current resource base and the potential of
prospective resources in Ukraine, taking particularly into account the potential benefits from
application of modern exploration and production technology as well as the potential of tight
sands and unconventional reservoirs.
Conventional Gas: Overview of Gas Resource Base
The following discussion of Ukraine's future gas production potential draws on
assessments of ultimate recoverable resources provided by the Ukrainian government. The
IHS CERA analysis puts these estimates in a context of potential development, investment,
and risk over the period 2012-35 and reflects IHS CERA's tested approach for estimating
resources based on the recognized classification system commonly used by international
investors.
It is important to highlight that there are some key differences between the resource
assessment methodology used by Naftogaz and the Ukrainian government and that used by
IHS CERA. In Ukraine, the classification system developed during the Soviet period is used;
this puts reserves and resources into six categories, namely, A, B, C1, C2, C3 and D. For its
part, IHS CERA applies the Petroleum Resources Management System (PRMS) defined by
the Society of Petroleum Engineers. IHS CERA's analysis of recoverable resources are based
on the PRMS categories of proven and probable (referred to as 2P), which is considered the
equivalent of A+B+C1 reserves in the Ukrainian classification. The categories C2 and C3 can
be considered as contingent resources. Category D is considered equivalent to prospective
resources in this report following PRMS standards, although in Ukraine, this category is often
referred to as predicted resources.
The official Ukrainian government estimate of 5.37 Tcm for remaining conventional gas
resources includes both contingent and prospective (predicted) resources, i.e., all categories
through D, with category D resources representing 64% of this total.
Table 1-1 compares resource estimates from IHS CERA data with estimates from various
Ukrainian sources, as reinterpreted by IHS CERA. As can be seen, there are no significant
differences between the IHS CERA assessment of proven and probable reserves and the
Ukrainian assessment of A+B+C1, either on an overall or regional basis.
Table 1-1
Ukraine's Initial Conventional Gas Resources,
IHS CERA and Various Estimates from Various Ukrainian Sources
(nonassociated gas; billion cubic meters)
Region IHS Ukraine
Proven + Probable Initial ABC1 C2+C3 D Total Remaining
East 2,374 2,431 707 1,516 4,654 2,791
West 407 368 136 373 877 554
South 99 101 350 1,602 2,053 2,021
Total 2,880 2,900 1,193 3,491 7,584 5,366
Source: IHS CERA.
Note: The above estimates are based on various sources and reinterpreted by IHS CERA, which can lead to slight
differences with some official Ukrainian published numbers.
1-2 Chapter 1
© IHS, 2012 No portion of this report may be reproduced, reused, or otherwise distributed in any form without prior written consent.Ukraine Special Report Natural Gas and Ukraine’s Energy Future
These figures show that most of Ukraine's initial 2P reserves are or were located in the
East, while a large portion of Ukraine's ultimate potential lies in the South, including the
offshore Black Sea.
Ukraine geoscientists estimate the country's potential ultimate recoverable resources
based not only on A, B, and C1, but also taking into account contingent (C2 and C3) and
prospective (D) resources. It should be noted that the Ukrainian system defines category D as
an unallocated resource figure, often referred to as predictive resource, meaning that no
specific prospect has been identified and drilled; instead the estimate is based on the density
of exploration within a basin, information on success rates, and the expectation that future
prospects will be found.
The methodology used by IHS CERA to estimate yet-to-find (YTF) resources instead
extrapolates from proven and probable resources based on the reserve probability distribution
in existing petroleum systems, and takes into account minimum economically recoverable
risked resources as well as differences in development timing. This IHS CERA method does
not fully capture the potential of plays that have not yet been identified, and ultimate potential
can turn out to be higher than YTF estimates made by this method. Therefore in this report
we make reference to all categories of resource potential, drawing on the data made available
by the government of Ukraine.
It should also be noted that of resources in the C2, C3, and D categories, more than 50%
are estimated to be situated at drilling depths of between 4,000 and 6,000 meters (m), with
around two thirds of this resource deeper than 5,000 m. This suggests that exploitation of
these resources will involve higher risk because of tighter and deeper reservoirs, increased
operational risks, and higher development costs.
Conventional Resource Opportunities by Region
Although detailed field-by-field analysis was not possible within the scope of this study,
some broad estimates have been made about future development potential based on available
data as well as the global experience of IHS CERA's team. The resource numbers quoted in
the text are based on various Ukrainian sources and reinterpreted by IHS CERA.
East Region
The East region of Ukraine for the purposes of this report consists of the area in and
around the Dnieper-Donets Basin in eastern Ukraine. It is the most developed of the three
regions in terms of existing gas production. The first discoveries here were made more than a
century ago, but the main phase of development took place in the 1960s and 1970s. Since that
time, investment and development activity has been at relatively low levels, and new
technologies such as 3D seismic, horizontal drilling, and hydraulic fracturing have been used
to only a modest extent.
Reservoirs of Paleozoic age form the large majority of producing fields in this region.
Reservoir characteristics vary widely from tight reservoirs with porosity of less than 10% and
permeability less than 1 millidarcy to high-quality reservoirs with permeability in the darcy
range. The structural style of the hydrocarbon traps and accumulations in this area also vary,
ranging from simple anticlines, fault-blocks to complex salt tectonic areas. In general, the
area is highly faulted with relatively small accumulations. Most reservoirs have normal
pressures, but slight overpressure has been measured in some cases.
The East region has the highest ultimate recoverable resources in Ukraine based on the
official government estimates, totaling 4,654 billion cubic meters (Bcm), which is 62% of the
total estimated gas resource for the country. This includes contingent resources of 707 Bcm
(category C2 + C3) and prospective resources of 1,516 Bcm (category D). This leaves a
Chapter 1 1-3
© IHS, 2012 No portion of this report may be reproduced, reused, or otherwise distributed in any form without prior written consent.Natural Gas and Ukraine’s Energy Future Ukraine Special Report
figure of 2,431 Bcm for initial recoverable resources located in existing discoveries and
producing fields (A+B+C1), of which 77% has already been produced.
Development of the remaining resources in these existing fields and discoveries as well as
the contingent resources could benefit from modern 3D seismic surveys to better delineate
small fault-blocks, deeper hydrocarbon pools, and small satellite fields. Modern production
techniques such as horizontal drilling, hydraulic fracturing, and compression could improve
recovery from marginal reservoirs. These technical options are discussed below.
It is estimated that 85% of the remaining resource in the category ABC1 can be
developed through improved recovery and by successfully delineating new pools and
satellites of existing fields. Thus, of the remaining 568 Bcm, a total of 483 Bcm could be
developed in the future.
Potential development of the contingent resources (C2+C3) is much more uncertain
because of geological, development, and economic risks. It is estimated that economic
development of relatively small satellite accumulations will be feasible; this represents 66%
of the total resources in this category, or 467 Bcm.
Prospective resources (category D) hold the largest risks both above and below ground.
Given that this is a relatively mature basin, it is assumed that only 30% of this gas would
ultimately be developed, leading to a potential of 455 Bcm.
Although this East region of Ukraine is mature, it would certainly benefit from the use of
modern technology as discussed later in this section. In particular, the productivity of
Paleozoic reservoirs should respond very well to modern fracturing techniques and horizontal
wells.
West Region
This region in western Ukraine consists of areas bordering Poland, Romania, and
Moldova, incorporating the Carpathian Flysch Zone, the Foredeep, and East European
Platform. This geologically complex region is made up of sandstone reservoirs of Cretaceous
and Tertiary age in complex structural settings ranging from simple horst and graben
structures to heavily thrusted anticlines. Accumulations are relatively small with a median
size of 2.2 Bcm, but with 15% of the fields bigger than 10 Bcm.
Gas resources in the West region are not at the same scale as the East region. Of the total
initial resources of nonassociated gas of 877 Bcm, the initially recoverable category
(A+B+C1) holds 368 Bcm, contingent resources (C2+C3) are 136 Bcm, and
prospective/predicted resources (category D) are estimated at 373 Bcm. Since this is a very
old region for gas production, most of the initial resource has already been produced, leaving
only 45 Bcm in this category (about 5% of the initial resource). With regard to contingent
resources, again the application of modern seismic technology to better delineate deeper
pools or complex structures would be extremely helpful. However, given the zone's structural
complexity, IHS CERA estimates that a total of 226 Bcm from the combined categories C2,
C3, and D could be commercially developable in the future.
South Region
The southern region has been underexplored to date but has major potential over a large
area. This region includes the Ukrainian sectors of the Azov and Black Seas as well as
onshore areas of the Crimean Peninsula. The Black Sea zone includes shallow areas closer to
shore, but water depths further south are greater than 2,000 m. Although seismic has been
shot offshore in the past, exploration is immature, and many potential prospects have not
1-4 Chapter 1
© IHS, 2012 No portion of this report may be reproduced, reused, or otherwise distributed in any form without prior written consent.Ukraine Special Report Natural Gas and Ukraine’s Energy Future
been properly defined. Modern exploration and drilling technology has been applied only to a
very modest extent.
The major sandstone reservoirs are formed by the Oligocene-Miocene Mykop Group, but
the largely untested potential is recognized in Carboniferous, Jurassic, and Cretaceous
sandstones. Since many prospects are located in deep water, exploitation will require not only
considerable investment but also a significant improvement in supply chain capability and
infrastructure to service the emerging offshore industry as it develops.
To date, initial recoverable gas resources in the A+B+C1 category are estimated at 101
Bcm. Large potential of 350 Bcm is present as contingent resources (C2+C3), of which
almost three-quarters could be located in the shallow part of the Black Sea in water depths of
less than 100 m. Prospective resources (category D) for the entire South region amount to
another 1,584 Bcm, of which 928 Bcm consists of potential resources located offshore in the
Black Sea at depths of more than 100 m, with the Azov Sea accounting for another 291 Tcm.
Because of the large uncertainty around the extent of the geological plays in the offshore
areas, it is assumed that 30% of the prospective resources will be developed with current
technology, which is similar to discovery and development rates in the North Sea.
Application of Modern Technology to Develop Resources
The development of existing fields as well as exploration for new prospects in Ukraine
has been hampered by low levels of investment as well as limited application of modern
technology. A number of exploration and production methods that have been successfully
used in other mature areas (such as Northwest Europe) could be used to improve the
productivity of existing fields or to explore for additional gas accumulations.
3D Seismic
This technique is used not only to better delineate subsurface structures, but also--with the
use of technology such as amplitude variation with offset and the evaluation of direct
hydrocarbon indicators--to detect gas in small accumulations that would not previously have
been recognized, for instance accumulations in unusual positions such as downthrown fault-
blocks. This methodology has been very useful in the northern Netherlands, to cite one
example, where significant additional resources have been discovered.
The use of 3D seismic acquisition has been limited to date in Ukraine. For example, since
1998, Naftogaz has shot a total of 6,553 square kilometers of 3D seismic, mostly
concentrated in the Dnieper-Donets Basin and the offshore Black Sea. However, only 10%-
20% of the prospective area of the Dnieper-Donets Basin is believed to have been covered by
3D seismic thus far. This represents a large opportunity for identifying additional resources in
these mature areas.
Horizontal Drilling
Horizontal well-bores offer multiple advantages over vertical wells, such as larger
drainage areas and limited pressure drawdown. Apart from improved reservoir recovery,
multilateral well development also has reduced drilling and production costs per unit of
production.
From data provided by Naftogaz, it is understood that horizontal drilling activity in
Ukraine has been modest to date. Chornomornaftogaz has drilled eight horizontal wells, of
which five were on the Skhidno-Kazantipskoye field in the Azov Sea and three on the
Shtormovoye Field in the Black Sea. Naftogaz reported that it drilled nine horizontal wells
Chapter 1 1-5
© IHS, 2012 No portion of this report may be reproduced, reused, or otherwise distributed in any form without prior written consent.Natural Gas and Ukraine’s Energy Future Ukraine Special Report
between 1999 and 2010, with a total of 1,688 m of horizontal section. Here also the potential
opportunity for improved exploitation efficiency is clear.
Multilateral Completions
Operational and production efficiency can be improved significantly using multilateral
well completions. This technique has not been used widely so far in Ukraine.
Well Stimulation Through Hydraulic Fracturing
This technology introduces fractures in the reservoir rock to enhance flow rates in
reservoirs with low permeability. Although well stimulation has been in use for many
decades, recent success in North American shale gas with multistage hydraulic fracturing has
demonstrated its potential to increase flow rates from tight gas reservoirs as well as shale gas
reservoirs. This technology has already been tested in the Olkhovskoye field with some
success, suggesting there is potential for its further application in Ukraine.
Production Management
The use of compression to boost production is a well-established technique to extend field
life and add to recoverable resources. Some success has been achieved on the Shebelinskoye
field, where resource additions of some 295 Bcm have been cited, along with a significant
increase of production levels.
It is also noted that nitrogen injection, which has been employed to great effect outside
Ukraine (for instance in Mexico's Cantarell field), has been used to a small extent in Ukraine
to increase production.
Tight Reservoir Development
Some parts of the gas reservoirs discovered in the past could not be developed because of
poor reservoir properties. These "tight" reservoirs have relatively low porosity and
permeability which restrict the flow of natural gas. Whereas normal producing reservoirs
have permeability in the range of millidarcies to darcies, tight reservoirs have permeability of
fractions of millidarcies. In this case, methods of well stimulation such as multistage
fracturing could be used to enhance the permeability of induced fractures in order to drain the
tight reservoirs.
Tight gas reservoirs are present in five recognized intervals in the Permian and
Carboniferous areas of the Dnieper-Donets Basin. At present, only onshore reservoirs are
considered feasible for development involving modern well stimulation. There are large
opportunities for tight reservoir development not only in the East region but also to a lesser
extent in the West region. Various tight reservoir intervals in the East region Carboniferous
section are already targeted for future development.
No precise resource numbers are available, and estimates of ultimate recoverable tight gas
resources based on a study carried out by the Ukrainian government vary between about 1.5
Tcm and 8.5 Tcm. Many of these resources are located at depths greater than 4,000 m, and to
a large extent they have not been properly explored.
Unconventional Resources
The results of a recent IHS CERA study, which are supported by results from a separate
study carried out by the Energy Information Agency within the US Department of Energy,
show that Ukraine holds vast resources of shale gas and CBM. The majority of shale gas and
CBM in Ukraine is present in the East region, specifically the Dnieper-Donets-Donbas Basin,
1-6 Chapter 1
© IHS, 2012 No portion of this report may be reproduced, reused, or otherwise distributed in any form without prior written consent.Ukraine Special Report Natural Gas and Ukraine’s Energy Future
with some additional potential present in the West region. Total gas-in-place resources for
unconventional gas in Ukraine could exceed 11.5 Tcm, in IHS CERA's view.
Experience from production in the United States shows that only a small portion of shale
gas and CBM plays—their so-called sweet spots—are likely to be economically producible.
The location and geometry of sweet spots is determined by gas content, maturity, depth,
pressure, and rock mechanics; at this stage, these factors remain highly uncertain in frontier
areas for unconventional gas such as Ukraine.
IHS CERA has mapped the potential areas for shale gas and CBM in the East and West
regions of Ukraine. By applying analogues from the United States, potential key parameters
including time to first production as well as ramp-up and plateau rates were determined for
the various play areas. This allows modeling of potential longer-term production profiles for
different cases, taking into account various possible levels for unit production costs.
The potential shale gas and CBM areas were risked on the basis of key geological
parameters including depth, thickness, maturity, and gas content. From this analysis, each
play was categorized to have high, medium, or low potential. Taking also into account
aboveground risks such as access restrictions, recovery factors, and regulatory constraints,
IHS CERA estimated the timing of when each play could start production, the time it would
take to reach plateau, and also its ultimate plateau production level.
This approach allows for potential production volumes to be estimated for Ukraine's shale
gas and CBM potential in aggregate. Estimates of gas in place and production potential for
individual unconventional plays are not particularly useful, given the large uncertainties
regarding rock mechanics and the presence and distribution of sweet spots. But aggregating
estimates over a large range of plays does produce robust results, in IHS CERA's view.
IHS CERA's modeling of potential production shows a wide range of plausible scenarios
for unconventional gas production in Ukraine. In the base case, unconventional gas
production reaches a plateau of about 25 Bcm per year by 2030. A high case, incorporating
more optimistic assumptions about aggregate play productivity, points toward plateau
production of 30 Bcm per year or higher. In either case, these levels of production could be
reached, using P50 assumptions for productivity and thus unit costs, at wellhead supply costs
of between $176 and $282 per thousand cubic meters.
Indicative Production Scenario
While a full technical and commercial assessment of Ukraine's resources has not been
undertaken as part of this study, it is important to highlight the possible scale and impact of
investment in the various exploration and development opportunities as listed above. IHS
CERA has therefore modeled an indicative outlook for future Ukrainian gas production from
the key resource categories listed above from 2012 to 2035. Some indicative approximations
have been applied to both conventional and unconventional resources, as follows:
Production from existing fields is assumed to decline at a rate of 2.4% per
year. This reflects results from IHS CERA research on global decline rates for gas
fields similar to those in Ukraine, taking into account the maturity of producing
fields. This decline rate assumes that some production technologies are applied to
arrest decline and improve recovery. It is noteworthy that Ukraine has already had
considerable success in heading off production declines from its existing fields for
many years.
$5–8 per thousand cubic feet (Mcf).
Chapter 1 1-7
© IHS, 2012 No portion of this report may be reproduced, reused, or otherwise distributed in any form without prior written consent.Natural Gas and Ukraine’s Energy Future Ukraine Special Report
Remaining resources in the categories of proven and probable (A+B+C1) are
assumed to be 85% developed onshore and 50% offshore. Recoverable
resources were risked at 85% feasible for development onshore and 50% for
offshore up to 2035.
Additional development of contingent resources in the category C2+C3 is
assumed following the application of modern technology. These resource figures
are risked at a level of approximately 60% for the East and West regions and at
50% for the South.
It was estimated that 30% of prospective/predictive resources (category D) for
all regions would be developed, taking into account exploration risk.
Given the large investment required for field appraisal and development, as well as the
necessity of building a significant service industry and support infrastructure, development is
assumed take place initially at a relatively slow pace. Development of prospective resources
is assumed to take more time than development of proven or probable resources located near
existing infrastructure. Figure 1-1 shows the results of IHS CERA production modeling
exercise for Ukraine on the whole, taking into account conventional gas, tight gas reservoirs,
and unconventional gas. This project growth would be driven by the East region, which is
seen to be the most likely destination for initial major investments, starting with reserves in
the proven and probable category (A+B+C1), followed by exploration and exploitation of
contingent resources. Exploration for prospective resources (category D) is assumed to have
no impact on production before 2020.
Production in the West region is assumed to be much smaller, deriving initially from the
redevelopment of remaining proven and probable resources as well as contingent resources.
Figure 1-1
Projected Production Profile for Ukrainian Gas, 2012–35
80
70
Unconventionals
60
Base Case
50
Annual Tight Gas
Production 40 Reservoirs
(Bcm)
30
New Resource
20 Development
10 Existing Fields
(decline)
0
2005 2010 2015 2020 2025 2030 2035
Source: IHS CERA.
1-8 Chapter 1
© IHS, 2012 No portion of this report may be reproduced, reused, or otherwise distributed in any form without prior written consent.Ukraine Special Report Natural Gas and Ukraine’s Energy Future
Considerable time and significant investment will be needed before the large prospective
resources of the South region can be explored and developed. In part this reflects the
considerable time it will take to build the infrastructure and oilfield service capability needed
to explore the deeper waters of the Black Sea. Thus first production is not expected before
2020, and it is likely to start at relatively low levels.
For production from tight gas reservoirs, a minimum assumption for resources able to be
developed of 1.5 Tcm was used, of which 20% (300 Bcm) was assumed as the risked
recoverable resource involving current technology. In this area as well, development will not
be rapid.
The development of Ukraine's important unconventional gas potential will require large
investment; if this investment is forthcoming, it could have a highly significant impact on
overall gas production in Ukraine. The potential productivity of individual plays is highly
uncertain, and various alternative cases have been considered. In the base case, productivity
could reach some 25 Bcm per year after a long period of exploration and infrastructure and
service sector development.
Investment Requirements
It is clear that the exploitation of Ukraine's considerable gas resources will require
considerable new capital investment. The rate at which money will be invested and resources
will be exploited is of course a function to a large extent of the policy incentives provided by
the government and the industry response to those incentives—as well as the actual
commercial viability of the resources.
If one assumes that government policy succeeds in providing a conducive environment
for investment, and as a result the production scenario described above is achieved, this
would imply levels of investment in gas development far greater than those recently seen in
Ukraine. Capital costs for shale gas and CBM development alone could reach levels of $2-
$3.5 billion annually (in 2011 dollars) if and when unconventional development takes off.
Total capital investment for the production scenario shown in Figure 1-1 could reach levels of
approximately $10 billion per year during some periods between 2012 and 2035. This figure
does not include related investment in support infrastructure.
Chapter 1 1-9
© IHS, 2012 No portion of this report may be reproduced, reused, or otherwise distributed in any form without prior written consent.Ukraine Special Report Natural Gas and Ukraine’s Energy Future
CHAPTER 2: OVERVIEW OF UKRAINE’S GAS TRANSPORTATION SYSTEM
AND PRACTICES
Transportation and Storage
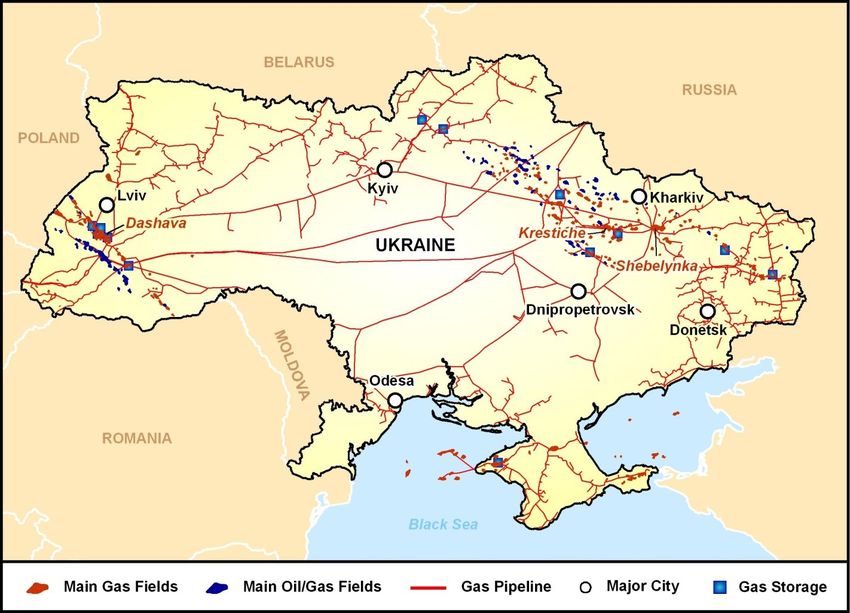
Ukraine’s Gas Transportation System (GTS) consists of nearly 40,000 kilometers (km) of
pipeline, of which more than half (22,000 km) are high-pressure pipelines, as well as 74
compressor stations (see Figure 2-1). In terms of nameplate capacity, the Ukrainian pipeline
system can receive 288 billion cubic meters (Bcm) annually from the east and can deliver 179
Bcm annually beyond Ukraine’s borders, mainly toward Europe; Russian transit gas being
delivered farther west into Europe accounts for nearly two-thirds of the gas volumes
transported by the system (see Figure 2-2). Having entered the Ukrainian system from Russia
and Belarus, gas can exit into Poland, Slovakia, Hungary, Romania, and Moldova.
The Ukrainian GTS is owned by the state and managed by Ukrtransgaz, with the
exception of trunk pipelines on the territory of Crimea, which are managed by
Chornomornaftogaz. Both Ukrtransgaz and Chornomornaftogaz are subsidiaries of state-
owned Naftogaz of Ukraine.
Figure 2-1
Gas Infrastructure—Ukraine
Source: IHS CERA.
10503-15
Chapter 2 2-1
© IHS, 2012 No portion of this report may be reproduced, reused, or otherwise distributed in any form without prior written consent.Natural Gas and Ukraine’s Energy Future Ukraine Special Report
Figure 2-2
Ukrainian Gas Consumption versus Gas Transit Volumes, 1990–2010
160
Total Gas Consumption Total Transit Shipments
140
120
100
Bcm 80
60
40
20
0
1990 1992 1994 1996 1998 2000 2002 2004 2006 2008 2010
Source: IHS CERA.
Ukraine also benefits from Europe’s second largest system of gas storage, which consists
of 13 storage facilities with an active capacity of nearly 32 Bcm. These storage facilities are
divided into four operational regions: West (five facilities), Central (four facilities), East (two
facilities), and South (two facilities). All gas storage is operated by Ukrtransgaz apart from
one 1 Bcm facility in Crimea. The total capacity for injection and withdrawal across the
system is roughly 250 million cubic meters per day.
Ukraine’s gas storage has traditionally played an important role by providing convenience
to Gazprom and by extension to Gazprom’s customers in Europe, which have benefitted from
flexible supply of Russian gas as a result. However, in the wake of commercial disputes,
Russian use of Ukrainian gas storage has declined considerably. Storage also allows Ukraine
to manage its own seasonal swings in demand and at times to hold extra volumes purchased
in expectation of higher future prices.
Gas Transit Volumes
Volumes of gas transiting the territory of Ukraine have been in decline since 2004, and
Ukraine’s significance as the core transit state for Russian gas is declining over time as
Russia continues slowly to diversify its export routes—first with the Blue Stream pipeline to
Turkey and imminently with the start-up of the Nord Stream pipeline to Germany (see Figure
2-3). Meanwhile, transit of Russian gas through Ukraine to Southern Russia has dropped to
zero following Gazprom’s construction of a new bypass pipeline on Russian territory.
Russian gas transit via Ukraine will continue to decline for the next few years before
potentially rebounding in the longer term. Figures 2-4 and 2-5 show projections for Russian
gas transit via Ukraine under different scenarios in terms of volume and also as a share of
Russia’s total gas exports to Europe by pipeline.
2-2 Chapter 2
© IHS, 2012 No portion of this report may be reproduced, reused, or otherwise distributed in any form without prior written consent.You can also read