NATURAL GAS BASED LIQUID FUELS: POTENTIAL INVESTMENT OPPORTUNITIES IN THE UNITED STATES - MILES LIGHT - Goldman Sachs
←
→
Page content transcription
If your browser does not render page correctly, please read the page content below
NATURAL GAS BASED LIQUID FUElS:
POTENTIAL INVESTMENT OPPORTUNITIES IN THE UNITED STATES

Conducted by:
Miles Light
Leeds School of Business
University of Colorado Boulder

June 2014
NATURAL GAS BASED LIQUID FUElS:POTENTIAL INVESTMENT OPPORTUNITIES IN THE UNITED STATES

synopsis
This report highlights potential investment opportunities related to natural gas liquids. The
research was conducted as a project for the Fuel Freedom Foundation.

Low natural gas prices and new technology present an opportunity to market and sell liquid
fuels in the form of ethanol and methanol to US consumers. Per unit of energy, oil is almost
four times more expensive than natural gas. This implies a potential arbitrage opportunity to
convert natural gas and natural gas liquids into a liquid fuel. In the US, 14.5 million vehicles can
currently utilize ethanol fuels. These are so called “Flex Fuel” vehicles, or FFVs. Another 16.1
million FFV “Twins” can utilize ethanol with a software upgrade, and 46.9 million conventional
fuel vehicles can potentially be converted for $150–$250 each. In all, this represents 77.75
million light duty vehicles, or 31.8% of the national light duty fleet, that would potentially
purchase natural gas liquid fuel, if prices were attractive.

The conversion and sale of NG based ethanol to US customers offers relatively high margins
compared to other energy-arbitrage efforts, such as LNG exports, because conversion and
shipping costs are lower for the local market, and because the replaced product (gasoline motor
fuel) is expensive compared to natural gas. Alongside the core ethanol production opportunity,
there are several related supply-chain development projects, such as production facility
development, ethanol fuel marketing, fueling station upgrades, blending facility expansions, and
vehicle update kits.

Table 1: Potential Fuel Replacement from Oil Based to Natural Gas Based Liquids (2014)

                                                                                        Conventional Fuel
                        2014 Fleet           Potential Demand   Potential Fuel Sales*     Reduction**
                        (Millions)                (Mgal)            ($ Millions)           ($ Millions)
FFVs                      14.67                     8,786              $19,154                $25,041
FFV Twins                 16.14                     9,665              $21,070                $27,545
Conversions               46.94                    28,116              $61,294                $80,132
Total:                    77.75                    46,567             $101,518              $132,718

*Using wholesale price of $2.18/gallon of ethanol.
**Using wholesale price of $2.85/gallon of gasoline.

Overview
The growing surplus of natural gas and natural gas liquids, combined with new technology to
convert natural gas into liquid ethanol or methanol, has created a potential market for non-oil
based liquid fuels. A legacy of farm-based policies to encourage corn-based ethanol has created
a large segment of vehicles that can now utilize ethanol. Almost all of these vehicles have never
actually used a high-ethanol blend (called “E85”), due to mostly market barriers that can now be
removed. Natural gas based ethanol can be produced and marketed for less than half the cost of
regular unleaded fuel, representing an arbitrage opportunity for investors, and an alternative to
high-cost gasoline for many American consumers.

                                                                                                            1
North American Energy Summit While alternate methods of using natural gas in vehicles have emerged in developing countries, such as compressed natural gas in India and Asia – the US market for CNG is narrow but growing. Ethanol, on the other hand, can be utilized by a large segment of the vehicle fleet today (gasoline). Compared to gasoline, ethanol has a major asset. It is contains high levels of octane, leading to improved vehicle performance. The energy content in ethanol is slightly lower than unleaded gasoline, so that more fuel must be injected per mile travelled, which leads to slightly lower mileage. These contradictory attributes have contributed to the confusion over ethanol fuels in the US marketplace. If a low-cost alternative to oil-based fuel would become available and accessible, consumers would begin to consider switching to a low cost option. Low cost ethanol and methanol is made possible by a new enzyme and chemical technologies that convert natural gas into pure ethanol According to Coskata and Celanese corporations, the marginal cost of ethanol is reported to be $1.25 (Coskata) to - $2.35 (Celanese) per gallon, when natural gas feedstocks are $4.00 per million British Thermal Units (mmbtu). When blended to create (E85), a common fuel mix consisting of 85 percent ethanol and 15 percent gasoline, the net cost would be approximately $1.65 per gallon (if the ethanol cost is $1.50). This is possible because natural gas is currently far less expensive per unit of energy (BTU) than oil ($4.50/ mmbtu for natural gas vs. $18.20/mmbtu for oil). Some states are better positioned to leverage NG-based fuels than others. Midwestern states, such as Illinois and Indiana, already have a deep infrastructure for ethanol-based distribution and sale, and the population is more familiar with ethanol liquid fuel, due to legacy corn promotion efforts. However, natural gas supplies that are needed to produce ethanol in the Midwest must compete with utilities for supply. Gas exporting states, such as Colorado, may be well suited to deploy natural gas-based ethanol fuels, because there is abundant natural gas feedstock, and there is also a high ratio of Flex-Fuel Vehicles (FFVs) per capita, although there are fewer fueling stations than the Midwest. Like other natural gas exporting states, the Colorado governor’s office is interested in increasing the use of locally-produced fuels in the state. Ethanol is considered to be a clean fuel compared to unleaded gasoline, with 20%–30% lower tailpipe emissions. Tailpipe (local) emissions for newer vehicles (post 2012) lower for either fuel, due to more stringent EPA standards and to newer technology. In order to quantify the demand for E85 in different regions of the country, relative price is paramount. However, even if prices are low, total demand is capped by the number of vehicles that can utilize E85, and the number of fueling stations that can dispense it. In this report, each region’s stock of FFVs, and E85 dispensing stations is compared, and the potential demand is computed using the relative prices between E85 and unleaded gasoline. In addition to the present stock of FFVs in the US (there are approximately 14.7 million), there also exist a similar number of so-called “FFV Twins”. These are identical make and model versions as the FFVs but they are not branded as FFVs. Respected technicians in Denver and Los Angeles have shown that so far – all FFV twins can be converted without any mechanical changes, simply by enabling the “flex fuel” intake programming within the onboard computer. A full study regarding on E85 conversions is listed in the references. 2
NATURAL GAS BASED LIQUID FUElS:POTENTIAL INVESTMENT OPPORTUNITIES IN THE UNITED STATES

Table 2: Summary Statistics: Regional and National Potential Demand for Natural-Gas Based
Liquid Fuels (E85 and Similar)

                                                                          Maximum Potential Fuel Demand
                    Number of Flex-Fuel Vehicles by Region                  (Millions of Gallons Per Year)
                   Population                     FFVs Per                                          FFV + Twins +
Region              (Millions)      FFVs           Capita                FFVs        FFV + Twins Conversions
Central                25.1        1,560,000         6.22%                934.3          1,962.1        4,952.0
Southwest              39.5        2,755,000         6.97%              1,650.1          3,465.1        8,745.3
Southeast              62.4        2,975,000         4.77%              1,781.8          3,741.8        9,443.7
Northeast              73.2        2,575,000         3.52%              1,542.3          3,238.7        8,173.9
Midwest                51.9        3,200,000         6.16%              1,916.6          4,024.8       10,157.9
West                   61.9        1,605,000         2.59%                961.3          2,018.7        5,094.8
Total FFVs:           314.0       14,670,000         4.67%              8,786.4        18,451.2        46,567.6
Twins:                            16,100,000         5.13%
Conversions:                      46,900,000       14.94%

Source: (US Census Est. for 2014, and Ford Motor Company FFV rolling stock, authors’ calculations. Twins &
Conversions extrapolated from R.L. Polk Data.

INTRODUCTION TO Ethanol
As noted earlier, ethanol is an alcohol fuel that has higher octane, but slightly lower energy
content than conventional gasoline. Vehicles that use fuels with a high ratio of ethanol are
tuned to use a slightly higher fuel to air ratio than when burning pure gasoline, or a 90%/10%
gasoline/ethanol mix. Ethanol has a much higher octane rating – higher than premium unleaded
gasoline, so vehicles perform better using a high ethanol mix. However, more fuel is needed per
mile. By optimizing for E85 octane levels, fuel economy falls less than the BTU difference would
suggest.

Table 3: Comparative Energy Content by Fuel Type

                                             Basic Ethanol Statistics
                                          Blend:
 Fuel Name:                   Ethanol               Gasoline               Octane:              BTU / Gallon
 E10                           10%                    90%                   85–87                 111,000
 E85                           85%                    15%                  105–108                 81,800
 Gasoline                       0%                   100%                     85                  114,000
 Premium Unleaded               5%                    95%                     92                  111,250

In 2012, 13.3 billion gallons of ethanol were produced in the United States and 12.95 billion
gallons were consumed. About 96% of ethanol consumption was due to a fuel-blending
mandate, where gasoline must be mixed with 10% ethanol and sold as “regular unleaded”
around the country. The remaining 4% is either used by the industrial sector or is exported.

                                                                                                                    3
North American Energy Summit
Less than 0.5% of ethanol is consumed in the form of E85. Due to the E10 mandate, ethanol
production has grown from 750 million gallons in 1990, to 13.3 billion gallons in 2012. The
near term potential market for E85, if attractively priced, is over 45 billion gallons, or $67.5
billion, at $1.50 per gallon (at the wholesale price). These E85 purchases replace $128.25 billion
dollars of gasoline (at wholesale prices of $2.85). Long term growth is greater, if existing vehicles
choose to convert, and if a larger share of new-vintage vehicles are sold as FFVs for example,
25% of new-vintage vehicles are FFVs, and if 1.5% of the existing fleet converts to use ethanol
blends, the potential demand would increase by $6.513 billion, or 9.6% per year.
MARKET for natural gas ethanol – Flex Fuel Vehicles
Flex Fuel Vehicles (FFVs) can use any mix of ethanol and gasoline. More than 15 million FFVs
have been sold in the US since 2000. Approximately 16.6% of new vintage sales are FFVs, and
about 5% of all vehicles are FFVs. Most owners are unaware that their vehicle can use E85. A
survey from 2005 found that 68% of FFV owners were not aware their vehicle was an FFV.1
Conversations with a diverse group of owners in both Colorado and California suggest that a
similarly large percentage of owners continue to lack knowledge that their vehicle is an FFV.
Most of the FFVs are produced due to a credit under the CAFE standard, so that manufacturers
can meet their requirements while still selling larger SUVs and trucks.
At the manufacturing facility, the cost of an FFV enhancement is $70–$100 according to
manufacturer data. Most of this cost is associated with additional certification and branding,
rather than equipment costs.
Table 4: Evolution of Flex Fuel Vehicles in the United States An FFV with an average 25
miles per gallon (MPG) rating
Light-Duty E85 will attain a 40 mpg rating
FFVs Sold Net annual under the CAFE rules, so
Year (Each Year) increase Total Fleet manufacturers produce FFVs to
1998 216,165 144,000 144,000 maintain their CAFE fleet
2005 735,693 683,217 4,117,109 averages. The CAFE credit
expires in 2016, but
2006 1,011,399 960,287 5,077,396
manufacturers are expected to
2010 1,484,945 N/A N/A continue producing FFVs due to
2011 2,116,273 N/A N/A the low cost and renewed
2012 2,466,743 N/A N/A government interest in
2013 N/A 14,600,000 alternative fuels.
Total** 15,113,909 N/A N/A
Again, fuel economy is lower for
*Net increase is new FFVs manufactured discounted by the survival rate. FFVs using E85. For example,
**Includes years not shown. the 2014 Dodge Avenger SXT,
Source: National Renewable Energy Laboratory. a mid-sized passenger FFV, is
rated at 19/27 miles per gallon
using conventional gasoline. The corresponding E85 rating is 14/20. If the vehicle has a small
tank, such as an 11-gallon tank, then city driving range is reduced from 209 miles (gasoline)
1
See Goettemoeller, Jeffrey; Adrian Goettemoeller (2007). Sustainable Ethanol: Biofuels, Biorefineries, Cellulosic Biomass, Flex-
Fuel Vehicles, and Sustainable Farming for Energy Independence. Prairie Oak Publishing, Maryville, Missouri. pp. 56–61.
4NATURAL GAS BASED LIQUID FUElS:POTENTIAL INVESTMENT OPPORTUNITIES IN THE UNITED STATES
to 154 miles (E85). Up until now, most FFVs tend to be larger vehicles, with larger fuel tanks.
Third-party researchers have found that actual vehicle mileage may be better than official EPA
ratings.2
In its latest energy forecast report, the EIA believes that FFV production and penetration will
continue to grow over the coming 25 years. In the agency’s Annual Energy Outlook [AEO]:
2014 (pre-release), the forecast for FFVs was increased from 7% of overall vehicle sales by 2040
to 11%. Of course, this forecast does not consider the possibility of a low-cost, natural gas-based
ethanol supply. Such a supply has the potential to significantly change AEO forecast estimates in
the future.
FFV Twins
In addition to conventional FFVs, there are so-called FFV twins. These are vehicles that are
identical to existing FFVs, but are not branded as such. For example, there were 38,011
Chevrolet Silverado brand vehicles registered in Colorado as “gasoline” in 2012, but they are
identical to 16,041 Silverados that are categorized as “Dual Fuel” in the same state. In all,
there were 222,180 twins registered in Colorado that could potentially utilize E85 with no
modification at all, or that require a check-box change to allow for E85 fuel-use profiles. The
ratio of Twins to FFVs across four states is between 0.9 – 1.3, meaning that for every FFV there
were 0.9-1.3 FFV twins. A ratio of 1.1 was used to derive the estimated 16.2 million FFV twins
nationwide.
FFV Conversions
Conventional cars cannot legally use ethanol, but if E85 prices are sufficiently attractive, owners
of conventional vehicles may be willing to pay for a ”conversion” that allows their vehicle to use
an ethanol blend for motor fuel. A large segment of the US vehicle fleet can be converted for a
modest price ($150–$250), assuming the EPA approves the process and relevant products.
Testing has been applied to selected models of conventional fuel vehicles, primarily vehicles
produced by General Motors between 2004 and 2010. Those models can be re-programmed
with the proper spark timing and air-flow profiles to use E85 with a software update. Two
vehicles that received extensive testing were the 2007 Chevrolet Cobalt, and the 2007 Chevrolet
HHR LS. Over 13.9 million GM vehicles were sold in the United States that use the E37, E38, or
E67 processors, all of which could be converted using a software change only.
In all, we estimate that 46.9 million light duty vehicles can be converted to FFVs for a cost
between $150–250 each. This represents 19.2% of the national rolling fleet of vehicles.
It should be noted that most newer-model vehicles can only be converted if the mechanic has
appropriate encryption keys that will unlock the software. Most late-model vehicle software has
been significantly upgraded by the manufacturers, and decryption for some vehicle models could
be a problem.
2
Some groups argue that the EPA official E85 fuel economy ratings are not accurate. These parties claim that actual fuel
economy is higher if vehicles are optimized for E85 consumption. Current required testing protocols optimize for pure
gasoline, even when using E85 fuel. Tests have shown that mileage can reach 95% of gasoline mileage, in properly tuned
vehicles.
5North American Energy Summit
Modeling Potential E85 Demand
A demand model for E85 was developed to identify volume of E85 demanded at different E85
price points. The model includes only the key aspects of E85 that differentiate it from unleaded
gasoline: energy content, and relative price.3
An FFV can travel 17% further by purchasing a gallon of gasoline compared to a gallon of
E85. This sets a “reservation price” for E85 about 14% lower than gasoline.4 Any price above
the reservation price, and demand would be zero.5 Equation 1 shows the base demand model
mathematically:
(1)
In the first half of equation (1), the demand for E85, in millions of gallons, is a function of the
number of FFVs in the US, the average number of miles driven per year, and the average MPG
rating using E85 (the manufacturer mpg never represents true road condition – it is usually
lower). These inputs determine the maximum potential demand for E85 in a given year. The
second half of equation (1), the actual demand is scaled by the potential demand function, which
depends upon relative prices between E85 and unleaded gasoline.
Potential Demand Curve
If the relevant estimates are inserted into Equation 1, then the relative price range that entices
FFV drivers to purchase and use more E85 over time can be identified. This E85 demand curve
for the US is presented in Figure 1.
3
Additional attributes can be included into a refined version, such as pump distance, signage, and E85 familiarity. Adding these
attributes would provide a richer depiction of E85 demand structure.
4
For example, a vehicle with 23.5 mpg rating using E10 would, on average, have a 20.0 mpg rating using E85. If fuel prices
were $3.50 per gallon, then the equivalent cost per mile using E85 is $2.99. The E85 reservation price of $2.99 is then $0.51
or 14.3% lower than the gasoline price of $3.50.
5
There is a minimum demand for E85, due to government mandated fleets. Most states and the federal government require fleets
to purchase E85 if it is 10% above gasoline prices or less, and if a pump is within 5 miles.
6NATURAL GAS BASED LIQUID FUElS:POTENTIAL INVESTMENT OPPORTUNITIES IN THE UNITED STATES
Figure 1: Potential Demand Curve: The Volume of E85 Demanded in Colorado when E85 is
Competitively Priced
E85 Demand - National Totals for FFVs and Twins
Unleaded = $3.45
12,000
Millions of Gallons of E85
10,000
8,000 FFV Demand
Twin Demand
6,000
Min-Use
4,000
FFV-Max
2,000
Twin-Max
0
$2.85
$2.81
$2.77
$2.72
$2.68
$2.64
$2.60
$2.55
$2.51
$2.47
$2.43
$2.38
$2.34
$2.30
$2.26
Source: Authors’ calculations based on business as usual (BaU) assumptions regarding FFV fleet, fuel efficiency,
and elasticity of substitution. Pump distance and availability are not part of the calculations in this chart.
This curve shows that E85 demand is equal to the minimum mandated fleet demand until the
average price of E85 is 18%6 lower than gasoline, but it then rises quickly to more than 4 Billion
gallons as FFV consumers shift toward E85. Another 4 Billion is demanded by FFV Twins, for
a slightly higher price spread. This demand continues to grow, but more slowly as the price
difference grows.
Figure 2: Aggregate Demand Curve for FFV and FFV Twins in the United States
Aggregate Demand - FFV + FFV Twins
(Unleaded = $3.45)
20,000
Millions of Gallons of E85
15,000
10,000
5,000
0
$2.85
$2.81
$2.78
$2.74
$2.71
$2.67
$2.63
$2.60
$2.56
$2.52
$2.49
$2.45
$2.41
$2.38
$2.34
$2.31
$2.27
6
The 18% price difference in the model combines the 14% price difference due to fuel efficiency, plus a static 4% price
difference to capture non-financial consumer aspects, such as distance to E85 pumps and unfamiliarity with E85 fuels.
7North American Energy Summit
E85 Pricing and distribution
E85 Pricing
Figure 3 : E85 and Conventional Gasoline E85 has 26% less energy content than
Prices over the Past Year (2013/14, $/Gallon) unleaded, lowering the miles per gallon by
approximately 14%, depending upon how
the vehicle is tuned. Therefore, consumers
will not purchase E85 unless it costs at least
14% less than gasoline. Crowd-sourced
price aggregation websites, such as
E85Prices.com, indicate that national E85
prices were 18.4% lower than gasoline
prices in May, 2014. The national average
E85 cost $3.08 per gallon, whereas
unleaded cost $3.78 per gallon during this
month.
The price spread is different for each state.
The spread is larger in corn-producing states
and smaller in oil-producing states.
Source: http://e85prices.com. There is no reason why ethanol and gasoline
prices should move in tandem, since
they use different feedstocks. But Figure 3 shows a clear trend, where ethanol prices generally
follow gasoline. It is possible that fuel distributors are choosing E85 prices based upon gasoline
prices, in order to maximize profits. The optimal spread between fuel types may be larger under
different conditions, such as when large supplies of low-cost ethanol are available.
Figure 4: Average Price Differential Between In August 2013, the price spread was
Conventional Gasoline and E85 in 2013/2014 highest, at 20.5% per gallon. This
(% of Gasoline Price) occurred during the peak summer fuel
season. The price spread was lowest in
December, during the winter when
average gasoline prices are lower. The
small price spread in April 2014 was
caused by a spike in ethanol prices, due
to rail-car shortages that limited
distribution of ethanol between
producers and blending stations.
E85 Distribution
E85 Fueling Stations
According to the U.S. Department of
Energy’s Alternative Fuels Data Center
(AFDC), there are currently 2,394 fueling
stations in the United States that can
Source: http://e85prices.com. dispense E85 ethanol, and according to
8NATURAL GAS BASED LIQUID FUElS:POTENTIAL INVESTMENT OPPORTUNITIES IN THE UNITED STATES
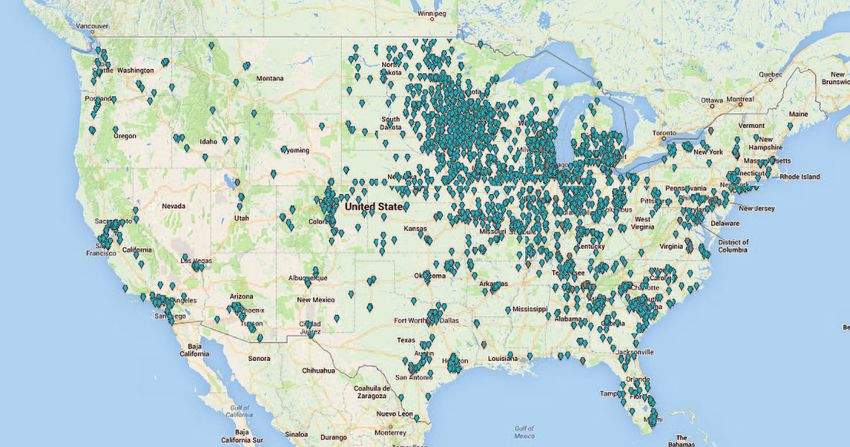
the crowd-sourcing website called e85prices.com, there were 2,678 fueling stations in May, 2014.
By far, the majority of stations are located in the Midwest, near to the ethanol production facilities
Figure 5: Ethanol Fueling Stations in the United States
Source: U.S. Department of Energy, Alternative Fuels Data Center. http://www.afdc.energy.gov/locator/stations
accessed on June 3, 2014.
Certain convenience store chains, such as Western Convenience, based in Denver, Colorado have
included E85 fueling options at every store location as a policy.
E85 Production from natural gas
This section considers the cost of natural gas-based ethanol production. A production facility
would be designed to convert natural gas into ethanol and then blended with gasoline to produce
E85 for sale as motor fuel, or to be sold to other customers outside of the state. Comparative
capital and unit costs are presented below for alternative liquid fuel technologies.
Table 5: Indicative Capital and Operating Costs for Ethanol Systems versus LNG
Capital Capital Operating
Investment Investment Revenue Cost Margin
Technology ($ Mil.) (per MT product) (per MT) (per MT) (per MT) ROIC
Enzyme Ethanol $650 $1,128 $830 $313 $517 46%
Enzyme Methanol $800 $800 $450 $210 $240 30%
Celanese TCX® $2,500 $2,273 $830 $498 $332 15%
LNG $12,000 $2,000 $832 $546 $286 14%
Notes: MT = metric ton. Source: Enzyme: Costkata corporation; LNG: Platts & CB&I; TCX: Celanese Indonesian coal
to ethanol facility. Information is proprietary to Costkata Corp.
9North American Energy Summit
The marginal cost of production for natural gas-based ethanol is a straightforward calculation.
The capital cost of an ethanol production facility depends upon the cost of site procurement and
construction of the facility. Marginal cost depends almost entirely upon the price of the natural
gas feedstock. Two major companies have access to natural gas conversion technology today,
Coskata, Inc., a privately-held Illinois-based energy corporation, and the Celanese Corporation,
a large publically-held company based in Texas. Each firm uses a slightly different production
technology, but both firms have detailed cost estimates of full-scale facility construction costs and
per-unit production costs, based upon the input price of natural gas.
The Celanese Corporation has provided an estimate for the marginal cost of producing ethanol
by using its TCX process. The cost depends primarily upon the price of the natural gas as a
feedstock (denoted below in dollars per thousand cubic feet [mcf]):
TCX ethanol cost ($/gal) = 1.2691 + 0.1367*NG price ($/mcf)7
The cost function applies to a plant producing 380 million gallons of ethanol per year, enough to
supply E85 fuel to about 290,000 FFVs for a year, assuming 100% reliance on E85.
Table 6 shows a list of ethanol output prices using the TCX process as it relates to natural gas,
and a list of gasoline prices as it relates to crude oil. The price of ethanol appears to be less
sensitive to natural gas than gasoline is to crude oil pricing. A 75% increase in natural gas prices
(from $3.58 to $6.29) causes a 21.6% increase in ethanol prices, whereas a 46% increase in
crude oil prices causes a 24% increase in gasoline prices.
Table 6 : Wholesale Fuel Cost Projections for Ethanol Using the TCX Process, And Gasoline Using
Petroleum (2012–2030)
Natural Gas Based Fuel Petroleum Based Fuel
Gasoline
NG price TCX ethanol cost Average crude oil wholesale prices Difference
Year ($/million Btu) ($/gge) price ($/bbl) ($/gal) ($/gge)
2012 3.58 $2.31 94.73 $2.78 $0.47
2015 4.29 2.44 116.91 3.02 $0.58
2020 4.58 2.49 126.68 3.19 $0.70
2025 5.63 2.68 132.56 3.34 $0.66
2030 6.29 2.80 138.49 3.45 $0.65
Source: RFF Report on Alternative Fuels, Table 2.3, page 12.
Notes: All prices are in 2010 dollars per unit.8
Coskata has reported production costs that are even lower than reported by Celanese
Corporation. For example, Coskata has indicated (informally) that their enzyme-based ethanol
process would yield one gallon of ethanol for a cost of $1.25, if the natural gas feedstock price is
7
For a full functional description of the TCX cost, see Resources for the Future (RFF), Cheaper Fuels for the Light Duty Fleet,
Working Paper, 2013, page 9.
8
Citation below will be updated by using the RFF revised report version from January 2014, which includes a discussion of the
Coskata process and costs. http://www.rff.org/Publications/Pages/PublicationDetails.aspx?PublicationID=22250.
10NATURAL GAS BASED LIQUID FUElS:POTENTIAL INVESTMENT OPPORTUNITIES IN THE UNITED STATES
$4.00/mmbtu. This is much lower than the TCX process estimate of $2.44 per gallon of ethanol
when natural gas prices are $4.29/mmbtu, as shown in Table 6.
An important consideration for the production of ethanol is the forward market price for ethanol
traded on futures exchanges. Although natural gas based ethanol does not qualify as a renewable
fuel, the sales price of ethanol can be seen on futures market exchanges.
Transportation Costs: Most ethanol production is expected to reside relatively near existing
wellheads if possible. A key variable that will be important to developers will be locations
also near population areas. Colorado is a good example of where both objectives can be met,
particularly in the front range of the state.
Natural Gas Supply and availability
The supply of natural gas in the United States is expected to remain high and prices are expected
to remain low for the foreseeable future. The US Energy Information Agency is considered the
best publically-available forecast for long-term energy prices and demand. According to the
Annual Energy Outlook, natural gas prices will slowly increase, from $4.15/mmbtu.
Figure 6: Natural Gas Production by Region
Natural Gas Production
12.00
10.00 Northeast
Gulf Coast
Trillion Cubic Feet
8.00
Midcontinent
6.00
Southwest
4.00 Rocky
Mountain
2.00 West Coast
0.00
2011 2013 2015 2017 2019 2021 2023 2025
The AEO 2014 forecast, as it relates to natural gas and ethanol supply, demand, and price, is
summarized in Figure 7 below. Gulf Coast output will continue climbing, and Rocky Mountain
output remains high. The largest increase will come from the Marcellus shale reserve in
Pennsylvania, which is expected to increase natural gas production in the region by 100% by
2016, and by 200% by 2025, according to the US Energy Information Agency.
The figure can also be viewed in percentage terms.
11North American Energy Summit
Figure 7: Natural Gas Production Forecast – Percentage Change from 2011 by Region
% Change in Supply
%-Change from 2011 Supply 250.0%
200.0%
Lower 48 Onshore
150.0% Northeast
Gulf Coast
100.0%
Midcontinent
50.0% Southwest
Rocky Mountain
0.0% 11
-50.0%
Prices in the Rocky Mountain region are inexorably linked to Henry Hub prices and national
demand. However, due to high levels of production and occasional limited gas pipeline capacity,
prices in the Rocky Mountain region are often lower than in the East and West coasts, where
demand is much higher than supply.
Figure 8: Natural Gas Price Forecast for Industrial Supplies – 2011 to 2025 in Real 2011 Dollars
Natural Gas Price (2011 Dollars)
7.50
7.00
6.50
6.00
Axis Title
5.50 Rocky Mtn
5.00
USA
4.50
4.00 Northeast
3.50
3.00
Source: EIA, Annual Energy Outlook, Reference Case, 2014. Supplemental Tables 13, 15, 10.
Based upon the EIA forecast, an industrial user in the Rocky Mountain region can expect
long-term natural gas prices to lie between $4.00 per mmbtu and $6.10/mmbtu in 2024. This
represents an average delivered price of $5.00/mmbtu.
12NATURAL GAS BASED LIQUID FUElS:POTENTIAL INVESTMENT OPPORTUNITIES IN THE UNITED STATES
ENVIRONMENTAL CONSIDERATIONS
When vehicles use E85 as their primary fuel, there are environmental benefits. Tailpipe emissions
are generally lower for E85 than gasoline, especially in older-vintage vehicles. Using a 2008
model passenger vehicle, Yanowitz and McCormick found emissions of key particulates and
volatile organic compounds were reduced between 20%–36%. Total nitrogen oxides (NOx)
declined by approximately 20%, particulate matter (PM2.5 and PM10) declined by 35%, carbon
monoxide (CO) declined by 20%.
Table 7: Estimated Emissions Benefits of E85 Use in Colorado FFVs
Tailpipe Emissions: Gasoline vs. E85
Grams per mile
Pollutant Vehicle Type Gasoline E85 Difference %
Passenger car 9.4000 7.5200 1.8800 20%
CO
Truck 11.8400 9.4720 2.3680 20%
Passenger car 0.6930 0.5613 0.1317 19%
NOx
Truck 0.9500 0.7695 0.1805 19%
Passenger car 0.0044 0.0029 0.0015 34%
PM2.5
Truck 0.0049 0.0032 0.0017 35%
Passenger car 0.0041 0.0027 0.0014 34%
PM10
Truck 0.0045 0.0029 0.0016 36%
Source: Authors’ calculations. Mtons stands for “Metric Tons”.
These findings indicate that environmental issues are unlikely to become an impediment to large-
scale E85 adoption and that public interest may be served by fuel switching. Potentially large
CO2 benefits emerge when the enzyme production technology is adopted. This occurs because
CO2 is an input to the production process, thereby reducing CO2 emissions. For example, a
typical enzyme production facility absorbs approximately 300,000 tons of CO2 per year, which
is enough CO2 to offset a 40 megawatt coal-fired power plant. Colorado’s new commission
regulations will also reduce problems related to flaring and methane/ethanol emissions.
OBSTACLES AND OPPORTUNITIES – A SUMMARY
As indicated earlier, there exist obstacles to deployment of natural gas liquid fuels – as is
common with new and disruptive technologies. On the consumer side, unfamiliarity with ethanol
fuels suggest that adoption rates will require some time and consumer education. Access in
ethanol to E85 stations currently is not a major limitation. However, easy access to fuel stations
to consumers in most states is difficult given the relatively small number of stations. Large-scale
adoption will require expansion of current supply networks. Finally, pricing at the pump is the
most important determinant for adoption of an alternative fuel type. A low-price fuel marketing
strategy over a long and continuous period will help consumers identify their options more
clearly. From the viewpoint of the retailers and distributors, if E85 fuel prices are low enough,
then fueling franchises and convenience stores will be eager to add ethanol pumps in order
to attract new customers, which then converts price-point challenges into an opportunity for
infrastructure developers and marketers.
13North American Energy Summit As discussed earlier, several ancillary opportunities exist along the market supply chain. For natural gas liquid fuels, this supply chain includes the following areas: • Feedstock supply: marketing and transport of natural gas feedstocks to ethanol producers as an alternative to corn or oil. • Oil and Gas Well Upgrades: development and installation of gas and ethane capture technology onto oil-wells, as part of new state air quality requirements. For example, as of 2014, Colorado State requires ethane and natural gas capture, instead of gas flaring. • Ethanol production facility development: construction and development of medium-scale facilities for enzyme or chemical based production of ethanol liquid fuels • Fuel Blending and distribution: install and upgrade fuel retailers for ethanol sale, as low-cost fuel is utilized by convenience stores as a loss-leader for high margin concessions. Big box stores are adding fuel stations for product bundling. • Vehicle upgrades and conversions: deploy conversion techniques and software upgrades nationally to dealers and repair shops. To summarize, the advent of large-scale natural gas supply is introducing new arbitrage opportunities in the United States transportation market. Energy arbitrage between oil and natural gas liquids appears to be a more direct method compared to other natural gas arbitrage efforts, such as LNG exports or CNG deployment. Among various liquid fuels, ethanol has the highest near-term potential demand. References Colorado Oil and Gas Conservation Commission. Staff Report, December 16, 2013. http://oil-gas.state.co.us/Staff_ Reports/2013/201312_StaffReport.pdf. Credit Suisse, Research Report on Celanese Corporation, February 2, 2014. Fraas, Arthur G., Winston Harrington and Richard D. Morgenstern. 2013. “Cheaper Fuels for the Light-Duty Fleet: Opportunities and Barriers.” Resources for the Future. http://papers.ssrn.com/sol3/papers.cfm?abstract_ id=2328301. Goettemoeller, Jeffrey, and Adrian Goettemoeller. 2007. Sustainable Ethanol: Biofuels, Biorefineries, Cellulosic Biomass, Flex-Fuel Vehicles, and Sustainable Farming for Energy Independence. Prairie Oak Publishing, Maryville, Missouri. pp. 56–61. Massachusetts Institute of Technology. 2013. Study on the Future of Natural Gas, Chapter 6: Natural Gas Infrastructure. http://mitei.mit.edu/system/files/NaturalGas_Report.pdf. United States Department of Energy, Energy Information Administration (2014).“Annual Energy Outlook 2014.” http://www.eia.gov/forecasts/aeo/er/index.cfm. United States Department of Energy, Energy Information Administration. From EIA-191 Montly Underground Storage Report United States Department of Transportation Federal Highway Administration, Office of Highway Policy Information. Highway Statistics, 2012. http://www.fhwa.dot.gov/policyinformation/statistics/2012/. United States Environmental Protect Agency. 2008. Emission Facts: Average Annual Emission and Fuel Consumption for Gasoline-Fueled Passenger Cars and Light Trucks. http://www.epa.gov/otaq/consumer/420f08024.pdf. 14
NATURAL GAS BASED LIQUID FUElS:POTENTIAL INVESTMENT OPPORTUNITIES IN THE UNITED STATES

University of Michigan, Transportation Research Institute (UMTRI), Eco-Driving Index. “Sales Weighted Fuel
 Economy Rating of Purchased New Vehicles, 2007–2013.” http://www.umich.edu/~umtriswt/EDI_sales-weighted-
 mpg.html. Accessed on Feb. 23, 2014.
Yanowitz, J., and R.L. McCormick. 2009. Effect of E85 on Tailpipe Emissions from Light-Duty Vehicles. Journal of
  Air & Waste Management 59: 172–182. http://www.afdc.energy.gov/pdfs/technical_paper_feb09.pdf.
Bromiley, P., T. Gerlach, K. Marczak, M. Taylor, and L. Dobrovolny. “Statistical Analysis of the Subcontract Report
  NREL/SR-540-42984 Factors Influencing Consumer Use of E85,” National Renewable Energy Laboratories,
  Subcontractor Report Number SR-540-42984. July 2008.

Selected Data Sources and Useful Information
Information Sources
1. US Energy Information Agency: Short Term Energy Outlook (STEO), January, 2014. Website Link: http://www.
   eia.gov/forecasts/steo/pdf/steo_full.pdf
2. Ethanol Pricing Website: http://e85prices.com/colorado.html
3. Nebraska Energy Office, Ethanol Division: http://www.neo.ne.gov/statshtml/122.htm
4. EIA Office of Alternative Fuels:
5. National Renewable Energy Laboratories – Alternative Fuels Division: http://www.afdc.energy.gov/data/
6. US Bureau of Transportation Statistics, Vehicles and Highways. http://www.fhwa.dot.gov/policyinformation/
   statistics/2012/
7. US Department of Energy, Alternative Fuels Data Center: http://www.afdc.energy.gov/data/
8. Wikipedia (as resource), http://en.wikipedia.org/wiki/Flexible-fuel_vehicles_in_the_United_States
9. Denver Clean Cities Coalition. http://www.denvercleancities.org/ethanol.html
10. Flexfuel Awareness Campaign: http://www.ffv-awareness.org/
11. Renewable Energy National Laboratory, TransAtlas Data Mapper. http://maps.nrel.gov/transatlas
12. Transportation Statistics Yearbook: http://cta.ornl.gov/data/chapter6.shtml
13. Reuters, Celanese faces U.S. road block on ethanol, by Ernest Scheyder, Houston. Wed Jun 15, 2011.
14. EPA AirData Air Quality Index Summary Report: http://www.epa.gov/airdata/ad_rep_aqi.html

State Incentives to Promote Alternative Fuel Use
•   Alternative Fuel, Advanced Vehicle, and Idle Reduction Technology Tax Credit (http://www.afdc.energy.gov/
    laws/law/CO/5246)
•   Plug-in Electric Vehicle (PEV) and Electric Vehicle Supply Equipment (EVSE) Grants (http://www.afdc.energy.
    gov/laws/law/CO/6578)
•   Biofuels Research Grants (http://www.afdc.energy.gov/laws/law/CO/6290)
•   Ethanol Infrastructure Grants (http://www.afdc.energy.gov/laws/law/CO/8740)
•   Low Emission Vehicle (LEV) Sales Tax Exemption (http://www.afdc.energy.gov/laws/law/CO/202)
•   Hybrid Electric Vehicle (HEV) High Occupancy Vehicle (HOV) Lane Exemption (http://www.afdc.energy.gov/
    laws/law/CO/4273)
•   Alternative Fuel Vehicle (AFV) Weight Limit Exemption (http://www.afdc.energy.gov/laws/law/CO/4272)
•   Natural Gas Fueling Station Air Quality Permit Exemption (http://www.afdc.energy.gov/laws/law/CO/10572)

                                                                                                                  15
North American Energy Summit
State Laws and Regulations to Promote Alternative Fuels
• Alternative Fuel and Advanced Vehicle Tax (http://www.afdc.energy.gov/laws/law/CO/10858)
• Alternative Fuel Resale and Generation Regulations (http://www.afdc.energy.gov/laws/law/CO/10014)
• Alternative Fuel Vehicle (AFV) Registration (http://www.afdc.energy.gov/laws/law/CO/5887)
• Promulgation of Renewable Fuel Storage Tank Regulations (http://www.afdc.energy.gov/laws/law/CO/6293)
• State Agency Alternative Fuel Use and Vehicle Acquisition Requirement (http://www.afdc.energy.gov/laws/law/
CO/5619)
• Alternative Fuel Definition (http://www.afdc.energy.gov/laws/law/CO/6289)
• Gasoline Gallon Equivalent (GGE) Definition (http://www.afdc.energy.gov/laws/law/CO/4274)
16You can also read