NCDA&CS Plant Tissue Analysis Guide
←
→
Page content transcription
If your browser does not render page correctly, please read the page content below

NCDA&CS
  Plant Tissue Analysis Guide

 Plant/Waste/Solution/Media Analysis Section
             Agronomic Division
N.C. Dept. of Agriculture & Consumer Services
               (919) 733-2655

          Michelle McGinnis, Ph.D., Agronomist
        Catherine Stokes, Communication Specialist
             Brenda Cleveland, Section Chief

                      February 2012
                   (updated May 2014)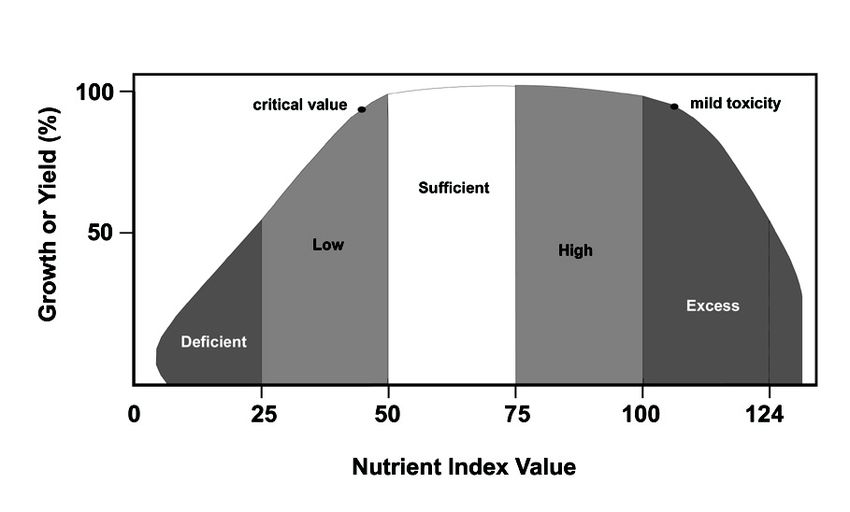
Table of Contents

1. Overview of the Agronomic Division                                                         1

2. Introduction to Plant Tissue Analysis                                                      2

3. Collecting a Good Sample                                                                   2

4. Understanding the Plant Analysis Report                                                    5

5. Summary                                                                                    7

6. References                                                                                 7

Appendix A. Sampling procedures for plant tissue analysis                                   10

Appendix B. NCDA&CS Agronomic Division methods for plant tissue analysis                    21

Figure credits:
All figures were developed by the NCDA&CS Agronomic Division, with the exception of
    a) the corn diagram in Figure 1, which was adapted, with permission, from the University of
        Illinois Cooperative Extension and
    b) the cabbage/lettuce diagram in Figure 1, which was adapted from CorelDRAW® clipart.

May 2014                             NCDA&CS Plant Tissue Analysis Guide                          i
1. OVERVIEW OF THE AGRONOMIC DIVISION The Agronomic Division Mission is to provide N.C. residents with site-specific diagnostic and advisory services to increase agricultural productivity, promote responsible land management and safeguard environmental quality. The Agronomic Division is comprised of four sections: (1) Field Services; (2) Soil Testing; (3) Nematode Assay; and (4) Plant, Waste, Solution and Media Analysis. The Field Services Section has a staff of 13 regional agronomists to advise and educate farmers, agricultural consultants, fertilizer dealers, homeowners and other state residents regarding agronomic sampling techniques, responsible and cost-effective fertilization practices, interpretation of agronomic lab results and the implementation of agronomic recommendations. For further information, see www.ncagr.gov/agronomi/rahome.htm. Soil Testing provides soil nutrient levels as well as weight per volume, pH, acidity, percent humic matter, soil class and soluble salt levels as described in Crop Fertilization Based on North Carolina Soil Tests. The Soil Test Report provides site-specific lime and fertilizer recommendations for specified crops. For further information, see www.ncagr.gov/agronomi/sthome.htm. Nematode Assay identifies plant-parasitic nematodes and estimates population size and relative hazard to the crop. The Nematode Assay Report provides recommendations for management of plant-parasitic nematodes. For further information, see www.ncagr.gov/agronomi/nemhome.htm. Plant Tissue Analysis measures nutrient levels within crop tissue and identifies nutrient deficiencies and toxicities. The Plant Analysis Report provides recommendations for monitoring and adjustment of crop fertilization programs. For further information, see www.ncagr.gov/agronomi/uyrplant.htm. Waste Analysis determines nutrient levels in farm (such as animal manure), industrial, municipal and composted waste materials. The Waste Analysis Report provides estimates of nutrient availability and recommendations for the environmentally sound use of waste material as a plant nutrient source. For further information, see www.ncagr.gov/agronomi/uyrwaste.htm. Solution Analysis measures nutrient concentrations as well as pH, electrical conductivity (soluble salts) and total alkalinity levels of water used in agricultural production, such as irrigation water, nutrient solutions and livestock drinking water. The Solution Analysis Report provides an assessment of potential problems and recommendations for their management. For further information, see www.ncagr.gov/agronomi/uyrsoln.htm. Media Analysis measures nutrient concentrations as well as pH and electrical conductivity (soluble salts) of soilless media used for containerized plant production. The Media Analysis Report helps growers troubleshoot problems and fine-tune fertilization programs. For further information, see www.ncagr.gov/agronomi/uyrmedia.htm. May 2014 NCDA&CS Plant Tissue Analysis Guide 1
2. INTRODUCTION TO PLANT TISSUE ANALYSIS

Plant tissue analysis, or tissue testing, is a chemical measurement of essential plant nutrients
within a sample of plant tissue. It can be used to identify nutrient-related problems (deficiencies,
toxicities or imbalances), rule out nutrition as the source of a problem, monitor nutrient status as
a basis for managing a crop fertility program and/or evaluate the effectiveness of a fertility
program. Additionally, plant analysis can help determine the optimal time for harvest of flue-
cured tobacco.

The following 16 nutrients are essential for a plant to complete its life cycle: carbon (C),
hydrogen (H), oxygen (O), nitrogen (N), phosphorus (P), potassium (K), calcium (Ca),
magnesium (Mg), sulfur (S), iron (Fe), manganese (Mn), copper (Cu), zinc (Zn), boron (B),
molybdenum (Mo) and chloride (Cl-). Carbon, hydrogen and oxygen are obtained from air and
water and are not generally limiting factors. The other nutrients are provided by soil minerals,
soil organic matter, limestone, amendments (such as crop residue, animal manure, compost,
agricultural waste and industrial waste) and/or fertilizer.

The NCDA&CS Agronomic Division lab provides interpretive guidelines for 11 of the essential
nutrients (N, P, K, Ca, Mg, S, Fe, Mn, Zn, Cu, B) as part of its standard plant tissue analysis ($5
per sample). Standard analysis also includes a measurement of sodium (Na) concentration.
Although Na is not a nutrient, it can affect plant growth and may be phytotoxic at concentrations
of 0.25–0.50%.

In addition to standard plant tissue analysis, tests for Mo and Cl- are available, by request, for an
extra fee of $2 per test per sample. For certain crops, measurement of Mo is required because of
its importance to quality. Therefore, tissue tests for samples of poinsettia and Brassica crops
(e.g., broccoli, cabbage, canola, kale, mustard, turnip) always cost $7 per sample, even if the test
for Mo is not requested.

3. COLLECTING A GOOD SAMPLE

Tissue sampling methods depend on the crop and the purpose of the sample. The plant part to
select depends on the crop and sometimes on the stage of growth as well (see Appendix A).
Guidelines for sample collection may differ based on whether you are trying to diagnose a
problem or just monitor nutrient status. In all cases, it is important to collect enough material to
represent the entire area of interest. To receive good interpretations, you must submit a good
sample!

Advisors and growers use tissue analysis to measure concentrations of nutrients in an “indicator”
plant part collected at a specific stage of crop development. Then, they compare those
measurements to established standard values known as sufficiency ranges. Therefore, you must
submit the correct plant part(s) at the correct growth stage to receive valid interpretations and

May 2014                              NCDA&CS Plant Tissue Analysis Guide                               2
recommendations on a Plant Analysis Report. Sampling incorrectly can result in misleading
findings and inappropriate nutrient management decisions.

For most crops, interpretations are based on sampling the most recent mature leaf (MRML). The
MRML is the most fully expanded or mature leaf and is generally the third to fifth leaf below the
growing point (Figure 1). It is neither dull from age nor shiny green from immaturity. Other
possible indicator plant parts include the whole plant, top of the plant, ear leaf, petiole, outermost
undamaged leaf and harvest leaf (Table 1). The correct plant parts to sample for specific crops
are listed in Appendix A, as well as the corresponding codes to enter on the Plant Sample
Information form.

For several crops (small grains, corn, forage grasses), the appropriate indicator plant part varies
with the growth stage. However, when the sampling protocol for a specific crop is unknown,
selection of the MRML will generally provide the best indication of nutritional status. Table 1
provides explanatory information about plant-part code choices available on the Plant Sample
Information form.

In addition to indicator plant part, sufficiency ranges are based on specific growth stage(s).
Interpretations on the Plant Analysis Report will generally be based on established sufficiency
ranges (nutrient levels) for the specific growth stage listed in Appendix A. When samples are
collected at other growth stages, the advisor and/or grower must consider principles of plant
nutrition when reviewing results and interpretations. For example, potassium (K) levels in leaves
of a plant will decrease as the plant moves into reproductive growth, so K sufficiency levels of a
MRML during the early or blooming growth stage will be higher than levels during the fruiting
growth stage.

For the high-value and/or agronomically important crops of strawberry and cotton, criteria have
been developed for the nitrate-nitrogen (NO3-N) concentrations in the petioles associated with
indicator leaf samples (Fig. 1). Petiole analysis provides a snapshot of nutrient uptake from the
soil to the leaves at the time of sampling. Results can be used for fine-tuning in-season nutrient
management. For these crops, an additional $2 per sample is charged for measurement of petiole
NO3-N, even if this test is not requested.

Lab results and interpretations depend on the quality of the sample. A good representative
sample is comprised of tissue obtained randomly from multiple plants within the area of interest.
Although only a very small amount of plant material is required for the test (< 1 gram), each
sample must include material to adequately represent the area of interest. For crops with small
leaves (e.g., azalea), 75–100 leaves make a good sample. For larger-leaved crops (e.g., corn or
tobacco), significantly fewer leaves are needed. See Appendix A for the recommended number
of leaves to sample for a specific crop.

The way that plant tissue samples are handled between time of collection and arrival at the
laboratory greatly affects the quality of analytical results. If delivery time to the laboratory (or to
a drying oven) is expected to exceed 12 hours, then it is best to refrigerate or air-dry the samples.
Refer to the publication Plant tissue sampling: proper handling for more detailed instructions.

May 2014                               NCDA&CS Plant Tissue Analysis Guide                                3
Table 1. Indicator plant-part codes, descriptions and example crops.

             Indicator plant part
                                                                            Example crops
Code1                   Description
M          Most recent mature leaf (MRML)               Most plants, including cotton & strawberry2
           Whole plant (cut ½–1″ above soil
W                                                       Seedling or young plants
           surface)
           Top 3–6 inches or                            Turf; forage grass and small grains prior to
T
           top 2–4 leaves                               reproductive growth stages
E          Ear leaf (opposite and below ear)            Corn (from tasseling through silking)
P          Petiole3 only                                Vinifera grape
O          Outermost undamaged leaf                     Lettuce and other leaf vegetables
H          Harvest leaf                                 Tobacco
1
  This is the code from Appendix A that must be written on the Plant Sample Information form.
2
  Even though cotton and strawberry tissue samples include both leaf blades and petioles (separated),
  the appropriate plant-part code is M.
3
  Petiole is the leaf stem (Fig. 1).

        Figure 1. Some examples of appropriate (indicator) plant parts for tissue sampling.

May 2014                                   NCDA&CS Plant Tissue Analysis Guide                          4
4. UNDERSTANDING THE PLANT ANALYSIS REPORT
Laboratory results are interpreted by comparing nutrient concentrations within a sample to
known nutrient sufficiency ranges for a specific indicator plant part and/or growth stage. The
sufficiency ranges have been developed from research, survey data, field observations and/or
experience. Reliability varies depending on the extent of research conducted on each crop.
Campbell (2000) provides further detail regarding the history, scientific basis and application of
plant analysis.
For each nutrient measured, the NCDA&CS Plant Analysis Report provides an index value
ranging from 0 to 124 and an interpretation category of deficient, low, sufficient, high or excess
(Table 2) in addition to the actual concentrations. The critical value (Figure 2) is the point at
which a nutrient shortage causes a 5 to 10% loss in yield or growth; the point of mild toxicity
indicates the same degree of loss due to nutrient excess.
• Deficient (0–24) and low (25–49) index values indicate that the nutrient concentration is
below the desired level and may be contributing to reduced growth, yield and/or quality.
As the index level decreases, the predicted crop response to nutrient application increases
(Table 2). When nutrient indexes are low or deficient, it is important to determine the
cause before making a corrective action. Causes for low nutrient levels in the indicator
plant part can include low soil nutrient levels or nutrient imbalances in the growing
substrate; low or high soil pH; very wet or dry soils; very low or high soil and air
temperatures; soil compaction; heavy fruit load; insect, disease and/or nematode pressure;
and chemical damage from herbicides or air pollutants (ozone).
• A sufficient (50–74) index indicates that the nutrient concentration is optimum for growth
and yield.
• High (75–99) and excess (100–124) index values indicate the nutrient concentrations are
above the desired level. High concentrations are not normally detrimental to growth or
yield, but the potential to impact crop quality increases as the index approaches 100.
Excess concentrations may cause problems due to plant toxicity or nutrient imbalances.
Nutrient concentrations can be very high due to high levels in the growing substrate;
contamination from a foliar spray of a pesticide or nutrient; soil contamination; very high
or low soil pH; or as a side effect of limited plant growth caused by another problem.
A look at nutrient ratios can also be informative. Plant reports provide values for ratios of
nitrogen to sulfur (N:S), nitrogen to potassium (N:K) and iron to manganese (Fe:Mn) because of
the effects these nutrients have on each other. As a general guideline, the ratio value should be
1.2–2.2 for N:K and >1 for Fe:Mn.
The most important ratio is N:S, which has an acceptable value of 10–15 for most crops. Values
approaching and exceeding 18 indicate that there is not enough sulfur present for the plant to use
nitrogen efficiently. This situation can occur even when sufficient plant tissue concentrations of
both nitrogen and sulfur are present (Campbell 2000).
May 2014 NCDA&CS Plant Tissue Analysis Guide 5Table 2. Predicted response of nutrient application by index value
Index Interpretation Crop Response
00 – 24 Deficient (D) High
25 – 49 Low (L) Medium
50 – 74 Sufficient Low to None
75 – 99 High None
100 – 124 Excess (E) None
Figure 2. Expectation of yield or growth (%) in response to
increasing nutrient concentration and interpretation index
May 2014 NCDA&CS Plant Tissue Analysis Guide 65. SUMMARY
Plant tissue analysis is a tool used to identify problems and manage nutrients in an economically
and environmentally responsible manner. Other factors to be considered in conjunction with
plant analysis include recent soil pH and fertility levels, fertilization history, soil texture,
environmental conditions (such as soil moisture, soil temperature and recent rainfall events),
cropping history, crop age or growth stage, distribution of problem in the field or greenhouse,
disease, insect and nematode pressure, visual appearance of the crop and pesticide use injury.
6. REFERENCES
Bailey D. 1998. Commercial pansy production. Raleigh (NC): NC Cooperative Extension
Service. Horticulture Information Leaflet 521. 8 p.
www.ces.ncsu.edu/depts/hort/floriculture/hils/HIL521.pdf (verified 2011 Sept 20)
Blackmer AM, Mallarino AP. 1996. Cornstalk testing to evaluate nitrogen management. Ames
(IA): Iowa State University Extension. PM 1584 revised. 4 p.
www.extension.iastate.edu/Publications/PM1584.pdf (verified 2011 Aug 5)
Campbell CR, editor. 2000. Reference sufficiency ranges for plant analysis in the southern
region of the United States. Raleigh (NC): NC Department of Agriculture and Consumer
Services. Southern Cooperative Series Bulletin 394.
www.ncagr.gov/agronomi/saaesd/scsb394.pdf (verified 2011 Jun 27).
Cleveland B. 2007. Submitting a diagnostic soil sample with a problem plant sample. Raleigh
(NC): NCDA&CS Agronomic Division. www.ncagr.gov/agronomi/pdffiles/diagnostic.pdf
(verified 2011 Aug 5)
Cleveland B, McGinnis M, Stokes C. 2008. Sampling for plant analysis. Raleigh (NC):
NCDA&CS Agronomic Division. Agronomic Sampling Folder No. 5. 2 p.
www.ncagr.gov/agronomi/pdffiles/sampta.pdf (verified 2011 Aug 5)
Cleveland BR. 2011. Using tissue analysis to monitor cotton nutrition. Raleigh (NC):
NCDA&CS Agronomic Division. 3 p. www.ncagr.gov/agronomi/pdffiles/11cotton.pdf
(verified 2011 Aug 5)
Farrer D. 2011. Tomato production fertilization guide. Raleigh (NC): NCDA&CS Agronomic
Division. 3 p. www.ncagr.gov/agronomi/pdffiles/tomatoguide.pdf (verified 2011 Aug 5)
Heiniger RW, Spears JF, Bowman DT, Carson ML, Crozier CR, Dunphy EJ, Koenning SR,
Payne GA, Marra MC, Naderman GC, Van Duyn JW, York AC, Culpepper AS. 2000. The
North Carolina corn production guide: basic corn production information for North Carolina
growers. Raleigh (NC): NC Cooperative Extension Service, College of Agriculture and Life
Sciences, NC State University. www.ces.ncsu.edu/plymouth/cropsci/cornguide/ (verified
2011 Aug 5)
Kemble JM, editor. 2011. Vegetable crop handbook for southeastern U.S. — 2011 . Lincolnshire
(IL): Southeastern Vegetable Extension Workers. 284 p.
www.ces.ncsu.edu/fletcher/information-handbooks/2011_SEVG.pdf (verified 2011 Aug 5)
May 2014 NCDA&CS Plant Tissue Analysis Guide 7McGinnis MS. 2011. Plant tissue samples: proper handling. Raleigh (NC): NCDA&CS Agronomic Division. www.ncagr.gov/agronomi/pdffiles/tissuehandling.pdf (verified 2011 Oct 14) Mills HA, Jones JB Jr. 1996. Plant analysis handbook II: a practical sampling, preparation, analysis, and interpretation guide (revised). Athens (GA): MicroMacro Publ, Inc. 421 p. NCDA&CS Agronomic Division. 2005. Production tools for tobacco growers: solution & plant analyses. Raleigh (NC): NCDA&CS Agronomic Division. Sampling Folder 8. 2 p. www.ncagr.gov/agronomi/pdffiles/samtob.pdf (verified 2011 Aug 5) NCDA&CS Agronomic Division. 2007. Diagnosing plant growth problems: services available through the NCDA&CS Agronomic Division and N.C. Cooperative Extension. Raleigh (NC): NCDA&CS Agronomic Division. Agronomic Sampling Folder No. 3. 2 p. www.ncagr.gov/agronomi/pdffiles/samprob.pdf (verified 2011 Aug 5) NCDA&CS Agronomic Division. 2009. Agronomic services for Christmas tree growers. Raleigh (NC): NCDA&CS Agronomic Division. 2 p. www.ncagr.gov/agronomi/pdffiles/xmas.pdf (verified 2011 Aug 5) NCDA&CS Agronomic Division. 2009. Agronomic services for grape production. Raleigh (NC): NCDA&CS Agronomic Division. 2 p. www.ncagr.gov/agronomi/pdffiles/grape.pdf (verified 2011 Aug 5) NCDA&CS Agronomic Division. 2009. Agronomic services for turfgrass management. Raleigh (NC): NCDA&CS Agronomic Division. 2 p. www.ncagr.gov/agronomi/pdffiles/turf.pdf (verified 2011 Aug 5) NCDA&CS Agronomic Division. 2009. Harvesting tobacco based on tissue analysis. Raleigh (NC): NCDA&CS Agronomic Division. 2 p. www.ncagr.gov/agronomi/pdffiles/tobaccopta703.pdf (verified 2011 Aug 5) NCDA&CS Agronomic Division. 2009. Strawberry tissue analysis. Raleigh (NC): NCDA&CS Agronomic Division. 2 p. www.ncagr.gov/agronomi/pdffiles/sberrypta.pdf (verified 2011 Aug 5) NCDA&CS Agronomic Division. 2011. Tissue sampling & analysis for greenhouse tomatoes. Raleigh (NC): NCDA&CS Agronomic Division. 2 p. www.ncagr.gov/agronomi/pdffiles/gtomato.pdf (verified 2011 Sept 20) NCDA&CS Agronomic Division. 2011. Understanding the plant analysis report. Raleigh (NC): NCDA&CS Agronomic Division. 2 p. www.ncagr.gov/agronomi/pdffiles/uplant.pdf (verified 2011 Aug 5) Plank CO, editor. 1992. Plant analysis reference procedures for the southern region of the United States. Raleigh (NC): NC Department of Agriculture and Consumer Services. Southern Cooperative Series Bulletin 368. www.ncagr.gov/agronomi/pdffiles/scsb368.pdf (verified 2011 Jun 27). Rideout JW. 2002. SoilFacts—soil and plant analysis for Christmas trees. Raleigh (NC): NC Cooperative Extension. Publication AGW-439-46. 3 p. www.soil.ncsu.edu/publications/Soilfacts/AGW-439-46/AGW-439-46.pdf (verified 2011 Oct 13 May 2014 NCDA&CS Plant Tissue Analysis Guide 8
Whipker B. 1998. Fertility management for geraniums. Raleigh (NC): NC Cooperative
  Extension Service. Horticulture Information Leaflet 504. 4 p.
  www.ces.ncsu.edu/depts/hort/floriculture/hils/HIL504.pdf (verified 2011 Sept 20)
Yarborough B. 2010. Fertilization. In: Ivors K, editor. Commercial production of staked
   tomatoes in the southeast (including Alabama, Georgia, Louisiana, Mississippi, North
   Carolina, and South Carolina). Raleigh (NC): NC Cooperative Extension. Publication AG-
   405 (revision). p 14–6. ipm.ncsu.edu/Production_Guides/Tomatoes/AG-405Web.pdf
   (verified 2011 Aug 5)

May 2014                          NCDA&CS Plant Tissue Analysis Guide                       9
Appendix A. Sampling procedures for plant tissue analysis
                                           Growth Stage 1                              Plant Part 2
                                                                                                                       Leaves: #    Extra
          Crop                                                                                                                              Cost          References
                                                                              Plant part to collect                    to collect   tests
                             When to collect samples        Code                                                Code
                                                                             (Indicator plant part)

African violet        Mature plants of flowering size       B, M   Most recent mature leaf                       M        25         ––     $5                ––

                                                                   Most recent mature trifoliate leaves from
Alfalfa               Prior to or early bloom               E, B                                                 T        30         Mo     $7                ––
                                                                   the top 1/3 (6″) of plants

                                                                   Most recent mature leaf from mid shoot,
                      5 to 10 weeks after full bloom               leaves near base of current year’s growth,
Apple                                                        M                                                   M        50         ––     $5                ––
                      (mid-June to mid-July)                       or leaves from spurs; 4–8 leaves per plant
                                                                   from 20–30 plants

                      Mid-summer                             E     Top 4–6″ of most recent mature fronds         M
Asparagus                                                                                                               20–30        ––     $5     2011 SE Vegetable Handbook
                      Late-summer                            M     Top 18″ of most recent mature fronds          M

Azalea                Prior to flowering                     E     Most recent mature leaf                       M      75–100       ––     $5                ––

Bahiagrass            see Grass (Forage & Pasture)

Barley                see Small Grain

                      Seedlings (less than 12″)              S     All the above-ground portion                  W
Bean                                                                                                                    20–30        ––     $5     2011 SE Vegetable Handbook
                      Prior to, or during initial bloom     E, B   Most recent mature leaf                       M

Beet                  Early to mid-growth                   E, B   Most recent mature leaf                       M      20–30        ––     $5     2011 SE Vegetable Handbook

Begonia                                                            Most recent mature leaf (1st leaf from top
                      Prior to heavy flower formation       E, B                                                 M        20         ––     $5                ––
(Rieger elatior)                                                   that is 2″ wide or greater)

Bentgrass             see Grass (Turf)

Bermuda, coastal
                      see Grass (Forage & Pasture)
(hybrid)

Bermudagrass (turf)   see Grass (Turf)

May 2014                                                           NCDA&CS Plant Tissue Analysis Guide                                                              10
Appendix A. Sampling procedures for plant tissue analysis (continued)
Growth Stage 1 Plant Part 2
Leaves: # Extra
Crop Cost References
Plant part to collect to collect tests
When to collect samples Code Code
(Indicator plant part)
Postharvest Most recent mature leaf on primocane
Blackberry M M 20–40 –– $5 ––
(10 to 14 days after final harvest) (nonfruiting laterals)
Most recent mature leaf from mid-portion
Blueberry Early or during bloom E, B M 50–60 –– $5 ––
of current season's growth
Bluegrass see Grass (Forage & Pasture)
Bluestem, big see Grass (Forage & Pasture)
Boxwood Summer M 2–3″ cuttings from terminal growth M 20 cuttings –– $5 ––
Southern Cooperative
Broccoli Early or prior to head formation E, B Most recent mature leaf M 25–30 Mo $7
Series Bulletin 394
Bromegrass see Grass (Forage & Pasture)
First mature leaf from center of whorl;
Cabbage Early to midgrowth E M 25–30 Mo $7 ––
should be oldest undamaged leaf
Cabbage, Chinese
8-leaf stage E Oldest undamaged leaf M 25–30 Mo $7 ––
(heading types)
Camellia Summer M Most recent mature leaf M 25–30 –– $5 ––
Caneberries see Blackberry or Raspberry
Canola Prior to bloom E Most recent mature leaf M –– $5 ––
Cantaloupe see Melons
May 2014 NCDA&CS Plant Tissue Analysis Guide 11Appendix A. Sampling procedures for plant tissue analysis (continued)
Growth Stage 1 Plant Part 2
Leaves: # Extra
Crop Cost References
Plant part to collect to collect tests
When to collect samples Code Code
(Indicator plant part)
Unpinched plants E 4th or 5th leaf pair from base of plant M
Carnation 20–30 –– $5 ––
5th or 6th leaf pair from top of primary
Pinched plants B, F, M M
laterals
Carrot Early growth (60 days after seeding) E Most recent mature leaf M 20–30 –– $5 2011 SE Vegetable Handbook
Cauliflower Early or prior to head formation E Most recent mature leaf M 25–30 Mo $7 ––
Centipede see Grass (Turf)
Leaves near base of current year’s growth
Cherry 5 to 10 weeks after full bloom M or from spurs; 4–8 leaves per plant from M 50–100 –– $5 ––
20–30 plants
Chinese cabbage
8-leaf stage E Oldest undamaged leaf M 25–30 Mo $7 ––
(heading types)
Chrysanthemum Most recent mature leaf from top of plant or
Prior to or at flowering E, B, F M 20–30 –– $5 ––
upper leaves on flowering stem
Clover Prior to bloom E Top 4–6 inches of the plant T 40–50 –– $5 ––
Collards Early E Oldest undamaged leaf M 25–30 Mo $7 ––
Terminal shoot from upper 1/3 of tree; do
Conifers Summer E M 20–40 –– $5 ––
not sample from leader or top whorl
May 2014 NCDA&CS Plant Tissue Analysis Guide 12Appendix A. Sampling procedures for plant tissue analysis (continued)
Growth Stage 1 Plant Part 2
Leaves: # Extra
Crop Cost References
Plant part to collect to collect tests
When to collect samples Code Code
(Indicator plant part)
Seedling (12″) E M
have developed a sheath (collar) on the NC Corn Production Guide (2000)
stalk. –– $5
10–15
Leaf opposite and below the uppermost
Tasselling & shooting to silking B, F E
developing ear (earleaf)
Leaf opposite and below the uppermost
Maturity M M
developing ear
Sampling after silking is not
–– –– –– ––
recommended
$5
now;
Only
Corn stalk 1–3 weeks after black layer has formed 8″ segment collected at 6–14″ above the Cornstalk Testing to Evaluate
M H 15 test:
(end of season) on 80% of the kernels of most ears soil line $7 Nitrogen Management
NO3-N
July
2014
First fully developed leaf below the whorl;
Corn, sweet Prior to tasselling E This leaf should be totally unrolled and
M
have developed a sheath (collar) on the
stalk. 15–20 –– $5 2011 SE Vegetable Handbook
Leaf opposite and below the uppermost
At tasselling B, F E
developing ear (earleaf)
May 2014 NCDA&CS Plant Tissue Analysis Guide 13Appendix A. Sampling procedures for plant tissue analysis (continued)
Growth Stage 1 Plant Part 2
Leaves: # Extra
Crop Cost References
Plant part to collect to collect tests
When to collect samples Code Code
(Indicator plant part)
S
Seedling: Four weeks following
Cotton Weeks
emergence of 2–3 true leaves
1, 2, 3, 4
Early: Four weeks following seedling E
(S) stage, includes pinhead square Weeks
formation 1, 2, 3, 4 Using Tissue Analysis
to Monitor Cotton Nutrition
Most recent mature leaf and petioles. Petiole
B M 25–30 $7
Bloom: Begins when plants have at Separate petioles in the field. NO3-N
Weeks NC State Cotton Website
least 5 open blooms per 25 row feet
1, 2, 3, 4
F
Fruit: Begins 5th week after beginning
Weeks
of bloom
1, 2, 3, 4
Mature M
Most recent mature leaf (generally 2011 SE Vegetable Handbook
Cucumber Early to early bloom E, B M 15–20 –– $5
4th to 5th leaf from a growing point)
Cucumber, Most recent mature leaf (generally 2011 SE Vegetable Handbook
Early to early bloom E, B M 8–10 –– $5
greenhouse 4th to 5th leaf from a growing point)
Fescue see Grass (Turf or Forage & Pasture)
Agronomic Services for Christmas
Two or three shoots from the upper 1/3 or ½
During dormancy 15–30 Tree Growers
Fir M of 8–12 trees. DO NOT sample from leader M –– $5
(~Sept–Dec) shoots SoilFacts—soil and plant analysis
or top whorl.
for Christmas trees
Daisy, gerber All growth stages E,B,F,M Most recent mature leaf M 25–50 –– $5 ––
Gammagrass see Grass (Forage & Pasture)
Gardenia Summer B Most recent mature leaf M 25 –– $5 ––
May 2014 NCDA&CS Plant Tissue Analysis Guide 14Appendix A. Sampling procedures for plant tissue analysis (continued)
Growth Stage 1 Plant Part 2
Leaves: # Extra
Crop Cost References
Plant part to collect to collect tests
When to collect samples Code Code
(Indicator plant part)
Early growth prior to root/bulb
Garlic E Center mature leaves M 20–30 –– $5 ––
enlargement
Fertility Management for
Geranium All growth stages E,B,F,M Most recent mature leaf M 25–50 –– $5
Geraniums
Grape, muscadine Most recent mature leaf opposite fruit
Mid to late summer but prior to final
(Vitis rotundifolia) clusters from well-exposed shoots
swelling of fruit (end of bloom through B, F M 60–80 –– $5
(generally the 1st or 2nd fruit cluster from
Aug); Best Time – June to early July
the base of the shoot)
Agronomic Services for
Grape Production
Grape, vinifera PETIOLES ONLY from Most recent
Full bloom through veraison (ripening
(Vitis aestivalis, mature leaf opposite fruit clusters from
of fruit) B, F P 80–100 –– $5
labrusca & vinifera) well-exposed shoots (generally the 1st or
2nd fruit cluster from the base of the shoot)
Grass Tillering (Less than 6″ tall) S Entire top of plant cut ½″ above soil T 2 handfuls
(Forage & Pasture)
Greater than 6″ tall and prior to seed
Top 6 inches of plant or the upper half of
head formation (after tillering to E T 20 tops
the plant (top 4 leaves)
before boot stage) –– $5 ––
After seed head formation
Most recent mature leaf 20–30
(recommended only when F M
(leaf below seed head) leaves
troubleshooting)
Grass (Turf) During normal growing season; at Two handfuls of freshly mowed grass (with Agronomic Services for Turfgrass
M T 2 handfuls –– $5 Management
least two days regrowth trash removed)
NCSU TurfFiles Website
Holly Summer M Most recent mature leaf M 30–50 –– $5 ––
Hydrangea Early summer M Most recent mature leaf M 30–50 –– $5 ––
Impatiens All growth stages E,B,F,M Most recent mature leaf M 25–50 –– $5 ––
May 2014 NCDA&CS Plant Tissue Analysis Guide 15Appendix A. Sampling procedures for plant tissue analysis (continued)
Growth Stage 1 Plant Part 2
Leaves: # Extra
Crop Cost References
Plant part to collect to collect tests
When to collect samples Code Code
(Indicator plant part)
Southern Cooperative Series
Kale Early or during bloom E, B Most recent mature leaf M 25–30 Mo $7
Bulletin 394
Lettuce Anytime during growing season E Outermost undamaged leaf M 10–20 –– $5 2011 SE Vegetable Handbook
Lettuce (leaf),
Anytime during growing season E Outermost undamaged leaf M 10–20 –– $5 ––
greenhouse
Lima bean see Bean
Marigold All growth stages E,B,F,M Most recent mature leaf M 25–50 –– $5 ––
Melons
Prior to or during bloom; prior to fruit Most recent mature leaves (generally the
(watermelon, E, B M 12–30 –– $5 2011 SE Vegetable Handbook
set 5th leaf from the growing tip)
muskmelon)
Millet see Grass (Forage & Pasture)
Milo see Sorghum
Mung bean see Bean
Muskmelon see Melons
Mustard greens Early or during bloom E, B Most recent mature leaf M 25–30 Mo $7 ––
Oats see Small Grain
Early growth prior to root/bulb
Onion E Center mature leaves M 20–30 –– $5
enlargement
Orchardgrass see Grass (Forage & Pasture)
May 2014 NCDA&CS Plant Tissue Analysis Guide 16Appendix A. Sampling procedures for plant tissue analysis (continued)
Growth Stage 1 Plant Part 2
Leaves: # Extra
Crop Cost References
Plant part to collect to collect tests
When to collect samples Code Code
(Indicator plant part)
Ornamental shrubs Most recent mature leaf on current year’s
During active growth M M 30–100 –– $5 ––
& trees (not conifers) growth
Pansy All growth stages E,B,F,M Most recent mature leaf M 25–50 –– $5 Commercial Pansy Production
Mid-season; 12 to 14 weeks after Leaves near base of current year’s growth;
Peach F, M M 50–100 –– $5 ––
bloom 4–8 leaves per plant / 20–30 plants
Most recent mature tetrafoliate leaves
Peanut Prior to, or at bloom. E or B M 25–30 –– $5 ––
(about 3rd to 5th leaf from growing point)
Leaves near base of current year’s growth
Pear 5 to 10 weeks after full bloom M or leaves from spurs; 4–8 leaves per plant M 50–100 –– $5 ––
from 20–30 plants
Peas (English, Most recent mature leaf (about the 3rd set
Prior to or during initial flowering E, B M 30–60 –– $5 2011 SE Vegetable Handbook
southern) of leaf from the growing point).
6–8 weeks after bloom; 8–12 weeks Middle pairs of leaflets from a compound
Pecan M M 30–45 –– $5 ––
after catkin fall (July 7 to August 7) leaf on a terminal shoot
Pepper
Prior to bloom E Most recent mature leaf M 20–30 –– $5 2011 SE Vegetable Handbook
(bell, hot, banana)
Petunia All growth stages E,B,F,M Most recent mature leaf M 25–50 –– $5 ––
Needles from upper 1/3 crown; select
dominant trees with good form and crown;
Pine Summer M primary lateral branches from first flush of M 200 needles –– $5 ––
past season’s growth; strip needles (include
sheaths and fascicles)
Poinsettia Prior to or at bloom E, B Most recent mature leaf M 15–20 Mo $7 ––
May 2014 NCDA&CS Plant Tissue Analysis Guide 17Appendix A. Sampling procedures for plant tissue analysis (continued)
Growth Stage 1 Plant Part 2
Leaves: # Extra
Crop Cost References
Plant part to collect to collect tests
When to collect samples Code Code
(Indicator plant part)
Most recent mature leaf (3rd to 6th leaf from
Prior to or during early bloom E, B M
the growing tip)
Potato, Irish 20–30 –– $5 2011 SE Vegetable Handbook
Most recent mature leaf (3rd to 6th leaf from
Early flowering to half-grown tubers M M
the growing tip)
Postharvest Youngest mature leaves on primocane
Raspberry M M 20–40 –– $5 ––
(10 to 14 days after final harvest) (nonfruiting laterals)
Rhododendron Summer M Most recent mature leaf M 20–30 –– $5 ––
Upper leaves on the flowering stem or
Rose During flower production F M 20–30 –– $5 ––
5-leaflet leaf below bud
Rye see Small Grain
Ryegrass see Grass (Forage & Pasture)
Small Grain Seedling stage to early jointing;
GS 3–6 (Feekes) or GS 26–31 S Entire top of plant cut ½″ above soil W 2 handfuls
(Zadoks)
Early jointing to just prior to NCDA&CS Pictorial Guides
heading (ie just prior to boot); to Plant Tissue Sampling
E The 2–4 uppermost leaves (Top 4–6″) T 25–40
GS 7–9 (Feekes) or
–– $5
GS 32–39 (Zadoks) Small Grain Production Guide
Just prior to heading (boot stage);
GS 10–11 (Feekes)
GS 45–100 (Zadoks) B Flag leaf M 30–40
[sampling after heading is not
recommended]
Snap Bean see Bean
May 2014 NCDA&CS Plant Tissue Analysis Guide 18Appendix A. Sampling procedures for plant tissue analysis (continued)
Growth Stage 1 Plant Part 2
Leaves: # Extra
Crop Cost References
Plant part to collect to collect tests
When to collect samples Code Code
(Indicator plant part)
Sorghum (Milo,
If E, first leaf out of the whorl; if B, second
Grain sorghum) Early or Bloom E, B M 20 –– $5 ––
leaf from the top
15–20
Sorghum-Sudan Early or Bloom E, B Top 4″ to 6″ of plant T –– $5 ––
plants
Seedlings (less than 12″) S Entire top of plant cut 1″ above soil W
Soybean Prior to, or during initial bloom; before 20–30 –– $5 ––
pod set [sampling after pods begin to E, B, F Most recent mature leaf M
set is not recommended]
Spinach Mid-growth M Most recent mature leaf M 20 Mo $7 2011 SE Vegetable Handbook
Spinach, greenhouse All growth stages M Most recent mature leaf M 20 Mo $7 ––
Spruce Mid-season to late summer M 2–3″ terminal cuttings M 25 cuttings –– $5 ––
Most recent mature leaf (about 5th leaf
Squash Summer B, F, M M 15–20 –– $5 2011 SE Vegetable Handbook
from the growing point)
E
Most recent mature leaf and petioles. Petiole
Strawberry, field Early Weeks M 20–25 $7
Separate petiole in the field NO3-N
1–8
Bloom/Fruit: Initiated when there are
B/F
5–10 blooms on >75% of the plants or Most recent mature leaf and petioles. Petiole
Weeks M 20–25 $7 Strawberry Tissue Analysis
2–3 blooms on most plants; Harvest Separate petiole in the field NO3-N
1–12
usually begins at B/F week 5 or 6
M
Most recent mature leaf and petioles. Petiole
Mature Weeks M 20–25 $7
Separate petiole in the field NO3-N
1–4
May 2014 NCDA&CS Plant Tissue Analysis Guide 19Appendix A. Sampling procedures for plant tissue analysis (continued)
Growth Stage 1 Plant Part 2
Leaves: # Extra
Crop Cost References
Plant part to collect to collect tests
When to collect samples Code Code
(Indicator plant part)
Strawberry, Most recent mature leaf and petioles. Petiole
All growth stages E,B,F,M M 20–25 $7
high tunnel Separate petiole in the field NO3-N
Strawberry Tissue Analysis
Strawberry, Most recent mature leaf and petioles. Petiole
All growth stages E,B,F,M M 20–25 $7
greenhouse Separate petiole in the field NO3-N
Most recent mature leaf (generally the 4th to
Sweetpotato Midgrowth; prior to root enlargement E M 20–30 –– $5 2011 SE Vegetable Handbook
5th leaf)
Seedling S Entire top of plant cut 1″ above soil W
Tobacco,
burley Production Tools for Tobacco
Prior to bloom E M
Growers: Solution & Plant
8–12 –– $5
Most recent mature leaf (about 4th leaf from Analyses
During bloom B, F M
growing point)
Maturity M M
Seedling (greenhouse transplants) S Entire top of plant cut 1″ above soil M 1 tray
Tobacco,
flue-cured Before bloom E M
During early bloom B M $5
Most recent mature leaf
Production Tools for Tobacco
(about 4th leaf from growing point)
During late bloom F M Growers: Solution & Plant
Analyses
Mature M M ––
Harvesting Tobacco
8–12 Based on Tissue Analysis
Upper leaves (tips) (Position U)
Harvest leaf M H $5
(~21st to 30th nodes from the bottom)
Middle leaves (smoking) (Position M)
Harvest leaf M H $5
(~11th to 20th nodes from the bottom)
Lower leaves (lugs & cutters) (Position L)
Harvest leaf M H $5
(~1st to 10th node from the bottom)
May 2014 NCDA&CS Plant Tissue Analysis Guide 20Appendix A. Sampling procedures for plant tissue analysis (continued)
Growth Stage 1 Plant Part 2
Leaves: # Extra
Crop Cost References
Plant part to collect to collect tests
When to collect samples Code Code
(Indicator plant part)
Early growth (5-leaf stage through first Most recent mature leaf
S, E M
Tomato, flower) (4rd to 5th compound leaf back from the 2011 SE Vegetable Handbook
field growing point)
Early flower through first fruit set 8–10 –– $5 Tomato Production
B M Fertilization Guide
(golf-ball-sized fruit)
First fruit set through harvest F, M M
Early growth through first fruit set S, E, B Most recent mature leaf (4rd to 5th
Tomato, compound leaf back from the growing Tissue Sampling & Analysis for
M 8–10 –– $5
greenhouse point) Greenhouse Tomatoes
First fruit set through harvest F, M
Triticale see Small grains
Turnip greens Early or during bloom E, B Most recent mature leaf M 25–30 Mo $7 ––
Middle pairs of leaflets from a compound
Walnut 6 to 8 weeks after bloom M M 30–35 –– $5 ––
leaf on a mature shoot
Watermelon see Melons
Wheat see Small grains
Zucchini see Squash
1
Growth-stage codes: S = Seedling, E = Early, B = Bloom (prior to first fruit), F = Fruiting, M = Mature. To receive meaningful recommendations on a plant analysis report, you must collect and submit
tissue samples from the growth stage indicated in this table and write the associated code on the Plant Sample Information form. Analysis of tissue collected at other growth stages may still provide useful
information even though there are insufficient data for the lab to issue recommendations.
2
Plant -part codes: W = Whole plant, T = Top, E = Ear leaf, M = Most recent mature leaf (MRML), O = Outermost undamaged leaf, P = Petiole, H = Harvest leaf. To receive meaningful recommendations
on a plant analysis report, you must collect and submit the plant tissue part indicated in this table for the crop you are sampling and write the associated code on the Plant Sample Information form.
Samples of other tissue may still provide useful information even though there are insufficient data for the lab to issue recommendations based on it.
May 2014 NCDA&CS Plant Tissue Analysis Guide 21Appendix B. NCDA&CS Agronomic Division methods for plant tissue analysis Sample handling Prior to analysis, samples are dried overnight (12–24 hr) at 80 oC, then processed through a stainless steel grinder (Wiley Mini-Mill; Thomas Scientific; Swedesboro, NJ) with a 20-mesh (1-mm) screen (Campbell and Plank 1992). Nitrogen Total nitrogen concentration is determined by oxygen combustion gas chromatography with an elemental analyzer (NA1500; CE Elantech Instruments; Lakewood, NJ) (AOAC 1990b; Campbell 1992) on a 10-mg aliquot of the dried and ground sample. Results are expressed in percent (%) on a dry-weight basis. Phosphorus (P), potassium (K), calcium (Ca), sulfur (S), magnesium (Mg), boron (B), copper (Cu), iron (Fe), manganese (Mn), zinc (Zn), sodium (Na), nickel* (Ni), cadmium* (Cd), lead* (Pb) [*analyzed for research, by special request only] Total concentrations of P, K, Ca, Mg, S, Fe, Mn, Zn, Cu, B, Na, Ni, Cd and Pb are determined with an inductively-coupled-plasma (ICP) spectrophotometer (Optima 3300 DV ICP emission spectrophotometer; Perkin Elmer Corporation; Shelton, CT) (Donohue and Aho 1992; adapted USEPA 2001), after open-vessel HNO3 digestion in a microwave digestion system (MARS & MDS2100 microwaves; CEM Corp.; Matthews, NC) (Campbell and Plank 1992). A 0.5- or 1.0-g dried and ground aliquot is digested in 10 mL 15.6N HNO3 for 5–30 minutes in a microwave, and the prepared sample volume is brought to 50 mL with deionized water prior to measurement. Elements are measured at wavelengths listed in Table B-1. Results are expressed either as a percentage (%) or in parts per million (ppm) [as milligrams per kilogram (mg/kg)] on a dry- weight basis. Table B-1. Wavelengths to quantify total elemental concentrations in Plant Analysis Lab Element Wavelength (nm) Element Wavelength (nm) Boron (B) 249.772 Manganese (Mn) 257.610 Cadmium (Cd) 214.440 Nickel (Ni) 231.604 Calcium (Ca) 317.933 Phosphorus (P) 178.221 Copper (Cu) 324.752 Potassium (K) 766.490 Iron (Fe) 259.939 Sodium (Na) 589.592 Lead (Pb) 220.353 Sulfur (S) 181.975 Magnesium (Mg) 285.213 Zinc (Zn) 213.857 May 2014 NCDA&CS Plant Tissue Analysis Guide 23
Appendix B. NCDA&CS Agronomic Division methods for plant tissue analysis (continued)

Nitrate nitrogen
Nitrate-nitrogen concentration is determined with an ion-sensitive electrode (ISE) (Orion Model
93-07; Thermo Fisher Scientific Inc., Waltham, MA) following a 0.25-M Al2(SO4)3 extraction
(25 mL) (Baker and Smith 1969) on a 0.25-g, dried and ground aliquot of sample. Results are
expressed in parts per million (ppm) [as milligrams per kilogram (mg/kg)] on a dry-weight basis.
Nitrate nitrogen will be analyzed on all strawberry and cotton samples for an addition cost of $2
(total cost of $7 per sample). Nitrate nitrogen can also be analyzed on any sample per request for
an additional cost of $2 (total cost of $7 per sample).
Molybdenum
Molybdenum is measured colorimetrically at 600 nm with a fiber-optic, colorimetric probe
(Brinkmann PC 900; Brinkmann Instruments, Westbury, NY), following a muffle-furnace ashing
(Barnstead Thermolyne 6000, Dubuque, IA) and Rhodamine-B (5 mL) digestion (Haddad and
others 1974) on a 1.0-g aliquot of dried and ground sample. Results are expressed in parts per
million (ppm) [as milligrams per kilogram (mg/kg)] on a dry-weight basis. Molybdenum will be
analyzed on all Brassica crop, poinsettia and spinach samples for an additional cost of $2 (total
cost of $7 per sample). Molybdenum can also be analyzed on any sample per request for an
additional cost of $2 (total cost of $7 per sample).
Chloride
Chloride is measured colorimetrically at 510 nm with a fiber-optic, colorimetric probe
(Brinkmann PC 900; Brinkmann Instruments, Westbury, NY), following a muffle-furnace ashing
(Barnstead Thermolyne 6000, Dubuque, IA) and silver-nitrate (2 mL) digestion (AOAC 1990a)
on a 0.25-g aliquot of dried and ground sample. Chloride analysis can be performed, by request,
on any sample for an additional cost of $2 (total cost of $7 per sample).

References
[AOAC] Association of Official Analytical Chemists. 1990a. AOAC modified method 963.05:
     chlorides in tobacco. In: Official methods of analysis. 15th ed. Arlington (VA): AOAC
     International. p 64.
[AOAC] Association of Official Analytical Chemists. 1990b. AOAC official method 972.43:
    microchemical determination of carbon, hydrogen, and nitrogen. In: Official methods of
    analysis. 15th ed. Arlington (VA): AOAC International. p 341.
Baker AS, Smith R. 1969. Extracting solution for potentiometric determination of nitrate in plant
     tissue. J Agric Food Chem 17:1284–7.
Campbell CR. 1992. Determination of total nitrogen in plant tissue by combustion. In: Plank CO,
    editor. Plant analysis reference procedures for the southern region of the United States.
    Athens (GA): Georgia Cooperative Extension Service. p 20–2. Southern Cooperative
    Series Bulletin 368. Available at www.ncagr.gov/agronomi/pdffiles/sera368.pdf (verified
    2011 Aug 24).

May 2014                             NCDA&CS Plant Tissue Analysis Guide                             24
Appendix B. NCDA&CS Agronomic Division methods for plant tissue analysis (continued)
Campbell CR, Plank CO. 1992. Sample preparation. In: Plank CO, editor. Plant analysis
reference procedures for the southern region of the United States. Athens (GA): Georgia
Cooperative Extension Service. p 1–12. Southern Cooperative Series Bulletin 368.
Available at www.ncagr.gov/agronomi/pdffiles/sera368.pdf (verified 2011 Aug 24).
Donohue SJ, Aho DW. 1992. Determination of P, K, Ca, Mg, Mn, Fe, Al, B, Cu, and Zn in plant
tissue by inductively coupled plasma (ICP) emission spectroscopy. In: Plank CO, editor.
Plant analysis reference procedures for the southern region of the United States. Athens
(GA): Georgia Cooperative Extension Service. p 34–7. Southern Cooperative Series
Bulletin 368. Available at www.ncagr.gov/agronomi/pdffiles/sera368.pdf (verified 2011
Aug 24).
Haddad PR, Alexander PW, Smythe LE. 1975. Spectrophotometric and fluorometric
determination of traces of molybdenum in soils and plants. Talanta 22:60–9.
[USEPA] US Environmental Protection Agency. 2001. Method 200.7. Trace elements in water,
solids, and biosolids by inductively coupled plasma–atomic spectrometry, revision 4.4.
Cincinnati (OH): USEPA Office of Research and Development. EPA-821-R-01-010.
Available at nepis.epa.gov/EPA/ (verified 2011 Sep 12).
May 2014 NCDA&CS Plant Tissue Analysis Guide 25You can also read