Neighbourhood-based evidence of tree diversity promotion by beech in an old-growth deciduous-coniferous mixed forest (Eastern Carpathians)
←
→
Page content transcription
If your browser does not render page correctly, please read the page content below
Ann. For. Res. 64(1): 13-30, 2021                                         ANNALS OF FOREST RESEARCH
https://doi.org/10.15287/afr.2021.2143				                                www.afrjournal.org

Neighbourhood-based evidence of tree diversity
promotion by beech in an old-growth deciduous-
coniferous mixed forest (Eastern Carpathians)

Dan Gafta1 , Annik Schnitzler2, Déborah Closset-Kopp3, Vasile Cristea1
           @

                       Gafta D., Schnitzler A., Closset-Kopp D., Cristea V., 2021. Neighbourhood-based
                       evidence of tree diversity promotion by beech in an old-growth deciduous-coniferous
                       mixed forest (Eastern Carpathians). Ann. For. Res. 64(1): 13-30.
                       Abstract Neighbourhood models are useful tools for understanding the role
                       of positive and negative interactions in maintaining the tree species diversity
                       in mixed forests. Under such a presumption, we aimed at testing several
                       hypotheses concerning the mechanisms of autogenic species coexistence in
                       an old-growth, beech-fir-spruce stand, which is part of the Slătioara forest
                       reserve (Eastern Carpathians). Univariate/bivariate spatial point pattern
                       analyses, the individual tree species-area relationship, the species mingling
                       analysis and generalised linear mixed models of neighbour interference
                       were applied on data concerning the position and allometry of all saplings
                       and trees occurring within a 0.24 ha plot.
                       The monospecific distribution of either beech or spruce saplings did
                       not support the spatial segregation hypothesis. There was no evidence
                       of conspecific negative distance dependence, as no spatial segregation
                       was detected between the saplings and trees of any species. Within 4
                       m-neighbourhood, the beech saplings appeared as diversity accumulators,
                       which might be indicative of indirect facilitation (e.g., herd protection
                       hypothesis). At tree stage, none of the three species showed either
                       accumulator or repeller patterns in their neighbourhood with respect to
                       sapling species richness. Signals of positive and negative interspecific
                       association were found in tree-sized beech (at scales of 10 to 20 m) and
                       spruce (at scales of 4 to 17 m), respectively. The former, highly interspersed
                       pattern is in accordance with the hypothesis of positive complementary
                       effects, whereas the latter, poorly intermingled pattern is probably linked
                       to the unexpected, positive neighbouring effect of spruce trees on the stem
                       growth of their conspecific saplings. Such self-favouring process might
                       be due to a facilitative below-ground mechanism. Conversely, the beech
                       saplings were suppressed through interference from the neighbouring
                       conspecific trees.
                       The beech appears to be the key promoter of tree species coexistence in
                       the study forest stand, in contrast to the low interspersion of spruce in the
                       overstorey leading to lower local tree diversity.
                       Keywords: auto-facilitation, beech-fir-spruce mixed forest, diversity
                       accumulator, neighbourhood effect, null models, self-competitor, spatial
                       point pattern, tree species mingling.

                                                                                                       13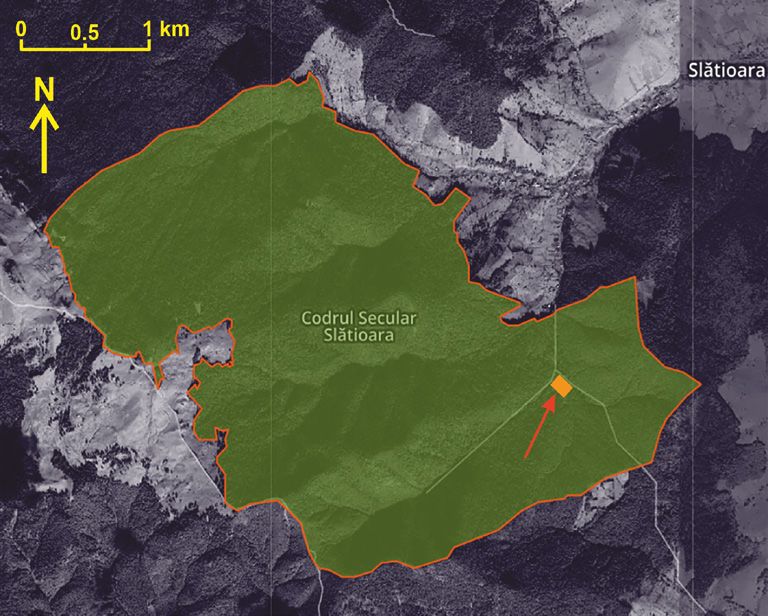
Ann. For. Res. 64(1): 13-30, 2021 Research article
Addresses: 1Department of Taxonomy and Ecology, Centre 3B, Babeș-Bolyai
University, Romania| 2Laboratoire Interdisciplinaire des Environnements
Continentaux, Université de Lorraine, Metz, France| 3 Unité Ecologie et Dynamique
des Systèmes Anthropisés, Université de Picardie Jules Verne, Amiens, France.
@
Corresponding Author: Dan Gafta (dan.gafta@ubbcluj.ro).
Manuscript received February 8, 2021; revised May 14, 2021; accepted May 26, 2021.
Introduction their close neighbours. Such interactions
may lead to either negative or positive net
Along with propagule availability and effects, mainly depending on the balance
environmental filters, niche-based interactions between asymmetric competition for limiting
have been widely considered as the main resources (light, nutrients) and facilitation
drivers of species coexistence and community (nursering), i.e. either resource limitation or
assembly (Wilson 2011, Kraft et al. 2015). In diversification (Chi et al. 2015, Bulleri et al.
forest communities, a number of mechanisms 2016). Other possible mechanisms underlying
have been proposed to explain the local scale- the negative and positive interactions between
coexistence of tree species: different patterns neighbouring plants may include shared pests
in seed dispersal and persistence (Harms et al. (e.g., pathogens, herbivores) and respectively,
2001, Wright 2002, Hou et al. 2004, Punchi- shared mutualists - like mycorrhizae and seed
Manage et al. 2015); habitat heterogeneity dispersers (Punchi-Manage et al. 2015).
(Koukoulas & Blackburn 2005, King et al. In temperate mixed forests composed of more
2006, Getzin et al. 2008, Chen et al. 2010, or less shade-tolerant tree species, dominance
Piao et al. 2013); autogenic alternation can easily change from one species to another
(reciprocal replacement) of species between between consecutive generations (Woods
ontogenetic cycles (Fox 1977, Woods 1979); 1984, Arii & Lechowicz 2002). Negative
allogenic formation of canopy gaps by natural spatial association between conspecifics by
disturbance (Canham 1988, Poulson & Platt means of reciprocal replacement were reported
1996) and demographic stochasticity (Gravel in mixed deciduous-coniferous forests from
et al. 2008). Recent studies have suggested different geographic regions (Bândiu 1977,
that niche structuring is a major determinant Nakashizuka & Kohyama 1995, Akashi
of species diversity in temperate mixed forests 1996, Kuninaga et al. 2015). The autogenic
(Gilbert & Lechowicz 2004, Laliberté et al. coexistence through reciprocal replacement
2009, Zhang et al. 2010). Two different classes of tree species can originate from various
of biotic mechanisms mediate coexistence by processes like, direct facilitation (e.g., light
preventing competitive exclusion (Chesson spectral filtering), intraspecific inhibition (e.g.,
2000): equalising mechanisms, which reduce auto-allelopathy) or indirect facilitation (e.g.,
the relative fitness difference between species ‘escape’ and ‘herd immunity’ hypotheses).
(e.g., facilitation or symmetric competition) As a necessary but not sufficient condition, it
and stabilising mechanisms, which reduce seems that coexistence requires interspecific
niche overlap (e.g., specialisation or self- differences in light transmissivity through the
inhibition). crowns of adult trees (Cammarano 2011). For
The niche-based mechanisms related to instance, fir regenerates better under beech
spatial processes are especially important for canopy due to the greater transmission of blue
plant species coexistence because they are and red light (Bândiu 1977, Dobrowolska
sessile organisms that interact mainly with 1998). On the contrary, the self-inhibition of
14Gafta et al. Neighbourhood-based evidence of tree diversity ...
fir saplings through auto-intoxication has been interactions can cause local maxima and
documented in pure silver fir stands (Becker & respectively, minima in species richness, the
Drapier 1984, 1985). analysis of individual species-area relationship
The ‘escape hypothesis’ or ‘conspecific (ISAR) may reveal the taxonomic identity of
negative density/distance-dependence’ (CNDD) the so-called diversity ‘accumulators’ and
assumes that, because the dispersed seed density respectively, ‘repellers’ (Wiegand et al. 2009).
is typically highest near the parent tree, specialised Finally, the third category includes the so-
enemies (pathogens, herbivores) accumulate and called ‘neutral species’, which do not display
reduce seedling establishment near conspecific patterns (peaks or saddles) in neighbourhood
trees, resulting in lower intraspecific aggregation species richness and are presumably related
(Comita et al. 2014). Recent studies brought to stochastic assorting (Wiegand et al.
evidence of CNDD as being an important 2007). Species displaying high-diversity
driver of species coexistence in temperate old- neighbourhoods may indicate a preponderance
growth forests (Getzin et al. 2008, Johnson et of positive interspecific interactions or strong
al. 2014, Kuang et al. 2017), including mixed CNDD, while species with low-diversity
coniferous-deciduous forests (Nakashizuka neighbourhoods may indicate dominance of
& Kohyama 1995, Hiura & Fujiwara 1999, inhibitory effects on heterospecific neighbours
Kotanen 2007, Bai et al. 2012, Piao et al. 2013). or strong conspecific positive density-
The ‘herd immunity hypothesis’ gives a similar dependence. As a consequence, the proportion
explanation of the reciprocal replacement of diversity ‘repellers’ and ‘accumulators’
of trees species but from a different angle: it within a community could shed light on
predicts that high local species diversity confers the mechanisms ruling coexistence in tree
protection from natural enemies by rendering communities (Espinosa et al. 2015).
it more difficult for specialist natural enemies The ‘spatial segregation hypothesis’, which
to locate the target plants (Wills et al. 1997). involves negative spatial association between
If both the escape and herd immunity theories heterospecific individuals, can also be related
hold, there should be a tendency toward high to species coexistence (Pacala & Levin 1997).
spatial mingling of tree species and ultimately, Intraspecific aggregation of juveniles (due to
a high local species diversity (Blundell & Peart limited seed dispersal or gap-based regeneration
2004, Volkov et al. 2005, Swamy et al. 2011, niche) leads to interspecific segregation, which
Pommerening & Uria-Diez 2017). in turn prevents the exclusion of competitively
The approach based on distance-dependent inferior species (Stoll & Prati 2001), thereby
analyses can be also employed to assess promoting species diversity. At later life
the performance of a focal tree based on the stages, stable coexistence of tree species can
characteristics of its nearest neighbours. be achieved by ‘positive complementary
Usually, the target tree growth and/or survival effects’ that arise owing to great niche
is analysed as a function of the size and differentiation (Cavard et al. 2011, Lasky et
distance from the neighbours (Wagner & al. 2014, Forrester & Bauhus 2016). Several
Radosevich 1998, Canham et al. 2004, Kunstler mechanisms may be responsible for such
et al. 2016), but the taxonomic identity of the effects, like reduction in crown interference
latter has been shown to be equally important due to spatial stratification (Pretzsch 2014)
(Uriarte et al. 2004). If the net effect of the or improved nutrient availability by virtue of
nearest neighbours on the focal trees is not null, more efficient exploitation of soil resources
then spatial structure in local species richness (Rothe & Binkley 2001).
may emerge (Lieberman & Lieberman 2007). The main goal of this study was to search
Since positive and negative interspecific for spatial dependence and neighbourhood
15Ann. For. Res. 64(1): 13-30, 2021 Research article
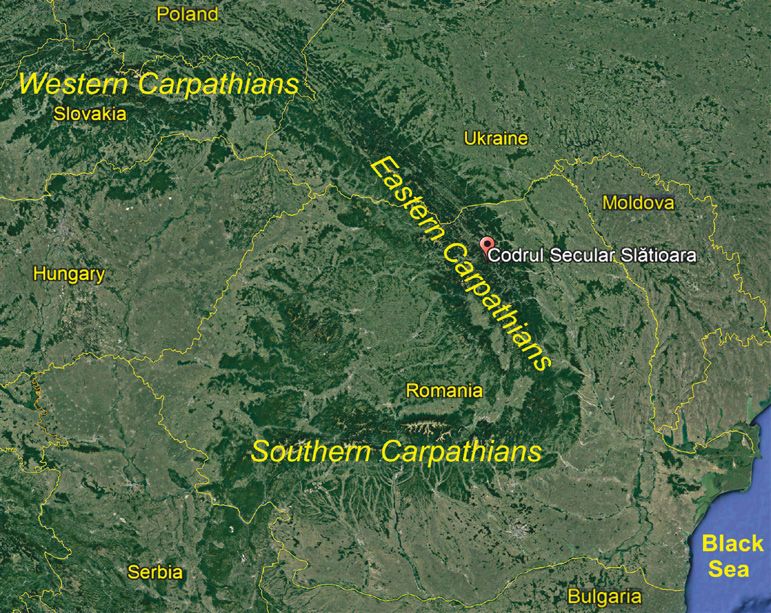
patterns across/within tree species and size (Eastern Carpathians, Romania) between 800
classes in an old-growth, mixed beech-fir- and 1510 m above sea level (Fig. 1). The
spruce forest, in order to test hypotheses about climate is temperate-continental with mean
the underlying mechanisms of autogenic annual temperatures between 3.9 and 5.8°C
species coexistence. We hypothesized that and mean annual precipitation ranging from
local tree species diversity could be promoted 700 to 810 mm (Duduman et al. 2014). The
and maintained by: i) facilitative interactions forest reserve was created in 1941 and covered
between heterospecific saplings in the shaded an area of 854.3 ha until in 2006, when it
understorey; ii) effects of conspecific negative was extended to 1064.2 ha. The mixed forest
distance-dependence, self-inhibition and canopy is formed of European beech (Fagus
positive interspecific interactions between trees sylvatica), silver-fir (Abies alba) and Norway
and saplings; iii) positive complementarity spruce (Picea abies), except in the upper
effects between canopy trees. montane stands (over 1350 m of elevation) that
Assuming that such deterministic are beyond the beech altitudinal range.
mechanisms of autogenic species coexistence The investigations were undertaken on a
exert stronger effects than negative mild (25%) north-western slope covered by
interspecific interactions in self-regenerating, rendzina soils, at an elevation of about 830
stable, old-growth mixed forests, we expected m a.s.l. By reference to living plants only,
to observe (at small spatial scales) patterns of the beech was by far the most abundant tree
aggregation/segregation or positive/negative species in both over- and under-storey (67%),
association between heterospecific/conspecific followed by spruce (24%) that rarely reached
individuals, and negative neighbourhood the uppermost level of the forest canopy (Table
effects of trees on the growth of conspecific 1). The fir had a modest share of 9% and was
saplings. By reference to appropriate null poorly represented in the understorey, in spite
models of spatial point pattern, we analysed: of the fir trees having cumulated the largest
i) the distribution of conspecific saplings for basal area and being on average the tallest
testing the spatial segregation hypothesis; ii) among the three species (Table 1). In terms
the distribution of saplings of each species of proportion of dead standing individuals in
with respect to their conspecific/heterospecific each species population, spruce was ranked
trees for testing the reciprocal replacement first (22.7%), followed by fir (9.8%) and beech
hypothesis, and iii) the individual tree species- (only 4.8%). Overall, the tree population
area relationship and tree species mingling structure was uneven but also heterogeneous
for testing the diversity accumulator/repeller throughout the Slătioara forest (Cenușă et
hypothesis and respectively, the positive al. 2002), and in particular, the study stand
complementarity effects. In addition, we featured a low number of trees in the middle
estimated the effect of the nearest conspecific/ size classes (Schnitzler et al. 2004). According
heterospecific tree size on the height of to the forest classification on ecosystemic
focal saplings for testing the hypothesis of bases by Doniță et al. (1990), the study stand
asymmetric competition. can be assigned to the forest ecosystem type
2316, characterised by highly to moderately
Materials and Methods productive spruce-beech-fir stands, developed
on eu-mesobasic brown or rendzinic soils, well
Study area balanced in terms of water supply, featuring
a mull-moder humus type and a herbaceous
The Codrul Secular Slătioara forest reserve layer of Oxalis-Dentaria-Asperula type.
(47°27′N; 25°37′E) lies in the Rarău Mountains
16Gafta et al. Neighbourhood-based evidence of tree diversity ...
Figure 1 Geographic location of the Codrul Secular Slătioara forest reserve (left) and the approximative
placement of the inventoried plot within the protected area (right).
Table 1 Summary statistics of the population size and allometry of the living plants (seedlings excluded) by
tree species in the study forest stand.
Variable Statistics Fir Beech Spruce
Density (N/ha) Sum 154 1154 413
Basal area (m2/ha) Sum 31.9 17.8 8.2
Range (min - max) 3.2 - 114.5 3.2 - 79.3 3.2 - 116.8
Diameter (cm) Median 28.1 4.8 6.3
Mean ± SD 42.9 ± 38.2 13.5 ± 16.9 10.3 ± 17.4
Range (min - max) 1.0 - 48.0 0.1 - 38.0 0.9 - 51.5
Height (m) Median 12.5 3.7 2.9
Mean ± SD 18.0 ± 16.9 6.4 ± 8.3 4.4 ± 7.2
Data collection clinometer and respectively, a tape ruler. In
addition, the stem girth at breast height (1.30
The field work was carried out in 2001 within m) was measured on all individuals that
a 40 x 60 m rectangular plot circumscribed were at least 1.50 m tall. Two size classes
to a relatively homogeneous area in terms of were distinguished based on trunk thickness,
site conditions and stand physiognomy, and i.e. individuals displaying a stem girth of at
located (at that time) within the buffer zone of least 10 cm (DBH ≥ 3.2 cm) were considered
the forest reserve. The long sides of the plot trees, whereas all others were included in the
were placed along the steepest slope path, i.e. category of saplings.
perpendicular to the contour lines.
The height and Cartesian coordinates Data analysis
(with respect to one plot corner) of all living
and dead standing tree species individuals We used point pattern analyses of fully
(except seedlings) were measured using a mapped plant locations to explore the
17Ann. For. Res. 64(1): 13-30, 2021 Research article univariate and bivariate spatial patterns in distributions or statistics (i.e., g(r), ISAR the distribution of individuals (Wiegand & and M) was assessed through simulations of Moloney 2014). The univariate analysis was (density constrained) random distribution of employed on conspecific saplings to test the trees or saplings, in order to account for possible spatial segregation hypothesis. The bivariate (undesirable) effects of habitat patchiness, analysis was performed on saplings relative stand history and dispersal limitation that can to their conspecific or heterospecific trees, in induce non-random patterns in the spatial order to test the auto-inhibition or the CNDD disposal of individuals, irrespective of biotic hypothesis, respectively. In the spatial point interactions (Wiegand et al. 2007, Rayburn & pattern analysis we used the pair-correlation Wiegand 2012, Baddeley et al. 2014, Espinosa function g(r), which is a second-order statistic et al. 2015, Tsai et al. 2015). To account that employs the probability of observing for large variation in tree density within the a pair of points separated by a distance r plot, we only used inhomogeneous Poisson (Illian et al. 2008). We computed the g(r) processes along with the Ripley’s isotropic distributions applying a lag distance of 0.5 m edge correction in simulating the null models over a maximum range of 20 m (i.e., half the of spatial independence. The tree or sapling minimum side of the plot). density throughout the plot was computed non- Neighbourhood effects on tree species parametrically by employing the Epanechnikov richness and mingling were tested using kernel estimators of the intensity function with species-by-all-species analyses, which integrate the option for Jones-Diggle improved edge across all species around a focal species correction (Diggle 2010, Wiegand & Moloney and are more likely to detect effects of biotic 2014). interactions than species-by-species analyses In the univariate g(r) analysis, the null (Punchi-Manage et al. 2015). The individual hypothesis was simulated through the random species-area relationship (ISAR) estimates the (but density-constrained) spatial disposal change in species richness with increasing area of conspecific saplings (Baddeley et al. and distance from heterospecific neighbours 2015). The null model used for testing the to target species individuals by integrating the significance of the bivariate g(r) and ISAR spatial structure of individuals (Wiegand et al. was the independence of the two spatial 2007, Wiegand & Moloney 2014). Depending point pattern types (across size classes and/ on the occurrence or absence of local minima or or species), i.e. no spatial interaction between maxima of species richness with respect to a null them (Baddeley et al. 2015). The simulations model, the ISAR approach allows the grouping corresponding to the last null model were of target species in (diversity) accumulators, performed by randomly reallocating the repellers and neutrals (Wiegand et al. 2007). The spatial position of neighbouring saplings mingling index (M) is a measure of interspersion with punctual probabilities derived from the of trees of different species and is defined as the estimated density (intensity), while keeping proportion of the n nearest neighbours that do the spatial arrangement of saplings or trees not belong to the same species as the reference of focal species fixed (Wiegand & Moloney tree (Pommerening & Grabarnik 2019). If the 2014). Finally, the significance of the observed nearest neighbours and the target tree always M index values was tested through the null share the same species, then M = 0 (minimum model of random labelling (independence intermingling), else if all neighbours are always between marks and points), that is by shuffling taxonomically different from the target tree the taxonomic identity of trees while keeping species, then M = 1 (maximum intermingling). the number and spatial position of trees in The significance of all previously mentioned each species constant (Baddeley et al. 2015). 18
Gafta et al.                                          Neighbourhood-based evidence of tree diversity ...

Two-sided, pointwise envelopes for the             analyses, as the allometric measures were not
observed g(r), ISAR and M distributions were       involved in computations. On the contrary,
generated from 999 Monte Carlo simulations         only living individuals were considered in the
and an overall goodness-of-fit (GoF) test was      neighbourhood interference analysis through
performed (Loosmore & Ford 2006).                  GLMMs.
  To describe the neighbourhood interference         Because the total number of fir saplings was
of trees on the target sapling, we employed the    too low (seven living and one dead), the results
Weiner’s (1984) measure (W):                       of analyses involving their spatial point pattern
                      n                            exclusively or their allometric characteristics
                            si
               W                                 were either incomplete or biased, and hence
                     i 1   di2                    were not reported.
where n is the total number of neighbours, di        All numerical analyses were performed in R
is the distance from the target sapling to the     v3.6.3 environment (R Core Team 2020) using
i-th neighbouring tree and si is the size of the   the packages ‘spatstat’ (Baddeley et al. 2020),
i-th neighbouring tree. The size of trees was      ‘idar’ (de la Cruz 2019) and ‘spatialsegregation’
roughly estimated by reference to the volume       (Rajala 2019), except for GLMMs that were
of a cone whose dimensions were equal to the       run in SAS/STAT 9.4 (SAS Institute Inc. 2014).
tree’s diameter and height. We calculated the
W values for each neighbouring tree species        Results
separately by considering only the nearest
conspecific and heterospecific trees (n=1). In     A weak but significant aggregation of beech
the rare cases in which the focal sapling was      saplings was detected only at 1 m-scale (Fig.
taller than one of the neighbouring tree, the      2a). At larger scales, the distribution of beech
corresponding W measure was equalled to            saplings was not significantly different from the
zero.                                              null model. The spruce saplings were randomly
   Generalised     linear    mixed       models    distributed at all scales (Fig. 2b).
(GLMMs) were employed to analyse the                  Saplings of any species did not show
sapling height in each species as a function       significant spatial patterns with respect to their
of the interference from each of the nearest       conspecific (Fig. 3a-c) or heterospecific trees
neighbouring, conspecific and heterospecific       (Fig. 3d-i).
trees, while controlling the influence of             Within 4 m-neighbourhood of beech saplings,
spatial autocorrelation (Bolker et al. 2009).      a higher taxonomic sapling richness than
The latter was handled through a residual          expected under the null hypothesis was detected
random component with an anisotropic power         (Fig. 4a). Instead, the individual species-area
covariance structure, which provided the best      relationships (ISARs) corresponding to the
fitting results and could account for possible     fir and spruce saplings were not significantly
differences induced by the terrain slope. The      different from their simulated counterparts
negative binomial distribution along with a log-   (Fig. 4b-c). When the trees and saplings were
link was employed in GLMMs for adjusting           considered as focal and respectively, target
the conditional probability distribution of the    individuals, the ISARs built for the three species
response variable (i.e., sapling height). The      (beech, fir and spruce) were all fully embedded
goodness-of-fit of each model was assessed         within the corresponding simulation envelopes
through the generalised chi-square divided by      (Fig. 4d-f).
the degrees of freedom (Gen. Chi-sq/DF).              A significant, positive, spatial association
   Both living and dead individuals were           between trees species was detected at scales
considered in g(r), ISAR and species mingling      larger than 10 m around the beech trees, as indicated

                                                                                                     19
Ann. For. Res. 64(1): 13-30, 2021 Research article
by the large observed values of the mingling Table 2 Standardised coefficients associated with
index compared to the simulated values (Fig. the (fixed) interference effects (W) of the
5a). An opposite pattern was detected within nearest neighbour beech, fir and spruce
a radius of 4 to 17 m around the spruce trees, tree on the height of beech (n=156) and
that is a significant, negative, spatial association spruce (n=37) saplings. The goodness-
between the three species (Fig. 5b). Finally, no of-fit of each GLMM is reported in the
significant spatial association between the three last row
species was observed in the neighbourhood of
fir trees (Fig. 5c). Response Sapling height
The height of beech saplings was significantly,
negatively affected by the interference from the Predictors Beech Spruce
nearest conspecific tree, whereas the negative
W (beech trees) -1.282 ** -0.372 ns
effects of the nearest fir and spruce tree were not
significant (Table 2). On the contrary, the nearest W (fir trees) -0.522 ns -0.006 ns
spruce tree displayed a significant, positive W (spruce trees) 0.084 ns 0.494 *
effect on the height of conspecific saplings
Intercept 0.992 0.446
(Table 2). The nearest beech exerted a non-
significant, negative effect on the spruce sapling Gen. Chi-sq/DF 1.00 1.10
height, whereas the neighbourhood effect of the ** 0.001Gafta et al. Neighbourhood-based evidence of tree diversity ...
10
b Fir saplings
4
c Spruce saplings vs Spruce trees
3.0
a Beech saplings vs Beech trees vs
Fir trees
8
2.5
3
g12(r)
6
2.0
2
4
1.5
1
2
1.0
0
0.5
0
0 5 10 15 20 0 5 10 15 20 0 5 10 15 20
Scale radius (m) Scale radius (m) Scale radius (m)
d Fir saplings e Fir saplings vs Spruce trees
vs
5
Beech trees
8
4
g12(r)
6
3
4
2
2
1
0
0
0 5 10 15 20 0 5 10 15 20
f Beech saplings
g Beech saplings vs Spruce trees
1.5
vs
8
Fir trees
6
g12(r)
1.0
4
0.5
2
0
0
0 5 10 15 20 0 5 10 15 20
h Spruce saplings
8
i Spruce saplings vs Beech trees
3.0
vs
Fir trees
2.5
6
g12(r)
2.0
4
1.5
1.0
2
0.5
0
0
0 5 10 15 20 0 5 10 15 20
Scale radius (m) Scale radius (m)
Figure 3 Empirical distribution of the bivariate pair-correlation function g12(r) associated with the
spatial distribution of beech, fir and spruce saplings with respect to their conspecific (a-c) and
respectively, heterospecific (d-i) trees. Simulation envelopes (in grey) as in Fig. 1.
21Ann. For. Res. 64(1): 13-30, 2021 Research article
3
u = 0.0602
3
3
p = 0.001
Number of species
a Focal beech saplings
2
2
2
b Focal fir saplings c Focal spruce saplings
1
1
1
0
0
0
0 5 10 15 20 0 5 10 15 20 0 5 10 15 20
4
4
3
Number of species
d Focal beech trees
3
3
f Focal spruce trees
e Focal fir trees
2
2
2
1
1
1
0
0
0
0 5 10 15 20 0 5 10 15 20 0 5 10 15 20
Neighbourhood radius (m) Neighbourhood radius (m) Neighbourhood radius (m)
Figure 4 Observed individual species-area relationships (ISARs) built within-saplings (a-c) and across-
size classes (d-f) by using every possible focal species. The number of species on the Y axis
includes the focal species (size class). The statistics (u) of the goodness-of-fit test is displayed for
significance validation. Simulation envelopes (in grey) as in Fig. 1.
1.0
c Focal spruce trees
1.0
b Focal fir trees
0.6
0.9
Mingling index
0.8
0.9
0.5
0.7
0.8
u = 0.1457
0.6
p = 0.002
0.4
0.5
u = 0.2559
0.7
p = 0.002
0.4
a Focal beech trees
0.3
0.3
0.6
0 5 10 15 20 0 5 10 15 20 0 5 10 15 20
Neighbourhood radius (m) Neighbourhood radius (m) Neighbourhood radius (m)
Figure 5 Empirical distribution of the mingling index (M) by neighbourhood radius built for trees only by
using the beech (a), fir (b) and spruce (c) as focal species. The statistics (u) of the goodness-of-fit
test is displayed for significance validation. The grey area represents a 99.9% simulation envelope
based on the null model of random labelling. The envelopes are truncated at large scales because
of the null variance (equal observed and simulated values of the mingling index).
22Gafta et al. Neighbourhood-based evidence of tree diversity ...
Discussion In spite of the well-documented process
of reciprocal replacement between beech
The monospecific distribution of either beech and fir in mixed forests (Bândiu 1977, Heiri
or spruce saplings did not support the spatial et al. 2009, Vrška et al. 2009, Diaci et al.
segregation hypothesis, which was found to 2010, Nagel et al. 2010), we did not observe
explain the tree species coexistence in other advance regeneration of beech/fir saplings in
temperate mixed forests (e.g., Wang et al. the neighbourhood of fir/beech trees, which is
2010, Zhou et al. 2019). Our results are, to in accordance with the findings from southern
some extent, unexpected as both beech and Carpathians (Petrițan et al. 2015). Similar
spruce are known to regenerate regularly independent spatial distributions between trees
within canopy gaps (Nagel et al. 2006, Paluch and saplings were also revealed at the other two
et al. 2019). Beech is a typical gap-filler pairs of species: spruce/beech and fir/spruce.
capable of rapid crown enlargement (Nagel et Possibly, the demographic heterogeneity and
al. 2010, Janík et al. 2016), whereas spruce is stochasticity may have distorted the ecological
an early and competitive coloniser of canopy response at species level (Hurtt & Pacala
openings (Jonášová & Prach 2004). 1995) and may have diluted the spatial patterns
We did not find evidence of conspecific in tree species distribution making them weak
negative distance/density dependence (CNDD) or undetectable (Gravel et al. 2008). On the
as no spatial segregation was detected between other hand, a number of studies documented
saplings and trees of any species. However, the positive effects of beech trees on fir
Janík et al. (2014) and Petrițan et al. (2015) regeneration (Dobrowolska & Veblen 2008,
reported spatial segregation between juvenile Vrška et al. 2009, Paluch et al. 2016, Paluch et
and mature beech individuals in old-growth al. 2019).
beech-fir forests in western and southern At sapling stage, only beech displayed
Carpathians, respectively. Likewise, Kuninaga significant diversity patterns in its
et al. (2015) and Ramage & Mangana (2017) neighbourhood. The apparent role of diversity
found evidence of CNDD in Fagus crenata accumulator of beech saplings cannot be
growing in mixed conifer-hardwood forests and attributable to segregation as such a pattern
respectively, in Fagus grandifolia-dominated, was not revealed in the distribution of beech
mixed hardwoods. Unfortunately, we could recruits. Higher than expected tree species
not test for CNDD in fir distribution because richness in the neighbourhood of beech saplings
of the low number of saplings. Many studies is in accordance with the positive, although
reported the decline of fir populations in mixed weak, correlations between seedling densities
stands due to poor seedling recruitment and in the beech-fir and beech-spruce mixtures, as
sapling survival (Diaci et al. 2011, Szwagrzyk reported by Paluch et al. (2019), and might
et al. 2012, Paluch & Jastrzębski 2013, Janík be indicative of net positive interactions or
et al. 2014, Keren et al. 2014, Parobeková favourable microsites (e.g., gaps) for multiple
et al. 2018). It seems that not plant-plant species regeneration (Wiegand et al. 2007,
interactions are responsible for the regression Espinosa et al. 2015). Due to their relatively
of fir in mixed stands, but rather a series of small size, it is unlikely that the beech saplings
other factors among which high accumulation have acted as nurse plants (direct facilitation)
of beech litter (Simon et al. 2011, Janík et al. with respect to fir and spruce saplings, but
2014) and damage by ungulates (Vrška et al. some sort of indirect facilitation cannot be
2009, Klopcic et al. 2010). However, none of excluded. For instance, a plausible explanation
these factors seemed to have been acting in the could be the herd protection (immunity) theory,
study forest area. i.e. enhanced survival linked to a reduced risk
23Ann. For. Res. 64(1): 13-30, 2021 Research article of transmission of species-specific pests and Bolte et al. (2013) demonstrated that beech pathogens because of the reduced intraspecific can adopt a flexible root foraging strategy density in more diverse assemblages (Peters to access soil resources less exploited by 2003, Comita et al. 2010). spruce, which instead maintains a conservative At tree stage, none of the three species strategy by keeping a shallow vertical fine root showed either accumulator or repeller patterns distribution. Such positive complementary in their neighbourhood with respect to sapling effects are partly responsible for the tendency species richness. The fact that beech trees of large trees towards high species mingling, do not act as diversity accumulators, like as revealed in several mixed forests across their juveniles, may be caused by the shift in Europe (Pommerening & Uria-Diez 2017). habitat preferences during their ontogenetic Nevertheless, we found evidence of avoidance development (e.g., large individuals require effects in spruce trees due to negative more resources and are more competitive) and/ association patterns with respect to the other or by the different environmental conditions two species. Several mechanisms may have under which the recruitment of trees and led to such a poor species interspersion. First, saplings occurred (Espinosa et al. 2015). The the spruce trees displayed a positive effect on predominance of neutral diversity patterns in the growth of their conspecific saplings (see the ISAR analyses points to several possible the next paragraph). Second, the spruce roots explanations: existence of environmental and litter deteriorate the edaphic conditions filters, i.e. species responding to some kind of under which the beech and fir saplings could environmental heterogeneity (Espinosa et al. grow sustainably, i.e. by water and base cation 2015); contrasting interactions that average depletion, and raw humus accumulation from each other out, i.e. null balance of positive and and respectively, in the topsoil (Thelin et al. negative interactions (Wiegand et al. 2007, 2002, Paluch & Gruba 2012, Paluch et al. Punchi-Manage et al. 2015); demographic 2016). Third, despite being less shade-tolerant, stochasticity due to local disturbance, like spruce possesses some eco-physiological traits those produced by herbivores, pathogens or that translate in competitive advantages with weather extremes (Wiegand et al. 2007, Gravel respect to beech and fir: priority effects gained et al. 2008). Various authors claimed that, in by the early colonisation of canopy openings accordance with the neutral theory (no species (Jonášová & Prach 2004); best establishment interactions), the ecological drift, dispersal on thick humus layers and coarse woody limitation and speciation alone can explain the debris (Szewczyk & Szwagrzyk 1996, Orman maintenance of tree diversity at local scales, & Szewczyk 2015); highest rates of height independent of species functional traits (Chave growth (Stăncioiu & O’Hara 2006). et al. 2002, Hubbell 2006). Only neutral neighbouring effects of trees on Signals of positive and negative interspecific the vertical growth of heterospecific saplings association were found in tree-sized beech and were detected in the study stand. On the spruce, respectively. The relatively high values contrary, significant interactions were revealed of mingling index observed in overstorey between saplings and their nearest parent beech trees is very likely linked to the status trees. Like other studies performed in similar of diversity accumulator revealed in beech mixed forests from central Europe (Bosela saplings. Niche complementarity in root et al. 2015, Mina et al. 2018), we observed foraging, shade-tolerance, leaf persistence and a suppression in vertical growth of beech crown growth architecture may also explain saplings in the neighbourhood of conspecific the positive association between beech and trees. Many studies demonstrated the low the two conifer species in the forest canopy. self-tolerance of beech (being a strong self- 24
Gafta et al.                                         Neighbourhood-based evidence of tree diversity ...

competitor for both above-ground and below-        been induced by habitat microheterogeneity
ground resources) and its severe intraspecific     and/or small-scale disturbance, if the latter two
asymmetric competition due to high lateral         factors had acted at the same spatial scales. The
expansion (Pretzsch 2014, Pretzsch & Schutze       ecological response of tree species revealed
2016). Besides, beech performs better when         in this study are only valid in the range of
growing in mixtures with conifers thanks to        submontane-lower montane belt (800-1200
reduced intraspecific competition (Bosela          m) where the climatic conditions are optimal
et al. 2015, Pretzsch et al. 2010, Mina et al.     for the growth of beech and fir. Therefore, our
2018). On the other side, the unexpected           findings should be further validated through
positive effect (instead of interference) of the   replicated studies in similar old-growth, (sub)
nearest spruce trees on conspecific saplings       montane mixed forests.
could only arise by the greater benefit from          Both as juvenile and adult, the beech seems
parent nursing than the energetic loss due to      to be the main player in the equalising and
the asymmetric intraspecific competition. A        stabilising mechanisms of coexistence and
possible explanation for this self-favouring       diversity maintenance in the study forest stand.
process could be a facilitative below-ground       The dominant role of beech in mixture with fir
mechanism, like mutualist soil organisms           and spruce is also sustained by the unbalanced
(e.g., mycorrhizae) that enhance the growth of     pair-wise competitive interactions, since the
saplings (Das et al. 2008, Bennett et al. 2017).   negative effects of beech size-symmetric
As mentioned above, such a process may be          competition on the growth of fir and spruce
also responsible for the observed negative         is much stronger than the effect of fir and
spatial association between spruce and the         spruce size-symmetric competition on beech
other two species in the tree-size class. The      growth (Mina et al. 2018). Conversely, the
detected auto-facilitation is not necessary        low intermingling of spruce in the overstorey
in contradiction with the findings reported        leads to lower local tree diversity. This poor
from the same forest reserve by Duduman et         interspersion is supported by the segregated
al. (2010), who revealed an opposite effect        regeneration niche of spruce (e.g., on
(interference) on spruce saplings but in           deadwood) relative to beech and fir (Šebková
terms of their radial growth and considering       et al. 2012, Orman & Szewczyk 2015). The fir
neighbouring trees of any species. A similar       seems to occupy an intermediate rank between
example of auto-facilitation was documented        beech and spruce in terms of its contribution
in hemlock trees (Tsuga canadensis) growing        to maintaining the local tree diversity, but
in mixed coniferous-deciduous forests in           this outcome might be partly influenced
eastern North America (Woods 1984, Catovsky        by the low numeric share of fir, given the
& Bazzaz 2002).                                    strong dependency of association strength on
                                                   abundance (Vázquez et al. 2007). Based on
Limitations and concluding remarks                 similar processes observed in many similar
                                                   forest stands from western Carpathians (Paluch
Our findings are circumscribed to a (relatively    et al. 2019), we suppose that strong reduction
small) extent of 0.24 ha and the distance range    in stand density due to intensive exploitations
of 20 m (i.e., half of the smallest side of the    prior to reserve foundation has promoted the
plot), which might have prevented the detection    establishment of spruce regeneration (even at
of spatial patterns beyond that scale, namely      the lower limit of its altitudinal range) and has
signals of interactions between the large          decreased the recruitment of fir saplings.
trees. Also, the spatial-related patterns that
we attributed to biotic interactions could have

                                                                                                    25
Ann. For. Res. 64(1): 13-30, 2021 Research article
References Bosela M., Tobin B., Seben V., Petras R., Larocque G.R.,
2015. Different mixtures of Norway spruce, silver fir,
and European beech modify competitive interactions
Akashi N., 1996. The spatial pattern and canopy- in central European mature mixed forests. Canadian
understory association of trees in a cool temperate, Journal of Forest Research 45: 1577-1586. https://doi.
mixed forest in western Japan. Ecological Research 11: org/10.1139/cjfr-2015-0219
311-319. https://doi.org/10.1007/BF02347788 Bulleri F., Bruno J., Silliman B.R., Stachowicz J.J., 2016.
Arii K., Lechowicz M.J., 2002. The influence of overstory Facilitation and the niche: implications for coexistence,
trees and abiotic factors on the sapling community in an range shifts, and ecosystem functioning. Functional
old-growth Fagus-Acer forest. Ecoscience 9: 386-396. Ecology 30: 70-78. https://doi.org/10.1111/1365-
https://doi.org/10.1080/11956860.2002.11682726 2435.12528
Baddeley A., Diggle P.J., Hardegen A., Lawrence T., Cammarano M., 2011. Co-dominance and succession in
Milne R.K., Nair G., 2014. On tests of spatial pattern forest dynamics: the role of interspecific differences in
based on simulation envelopes. Ecological Monographs crown transmissivity. Journal of Theoretical Biology
84: 477-489. https://doi.org/10.1890/13-2042.1 285: 46-57. https://doi.org/10.1016/j.jtbi.2011.06.031
Baddeley A., Rubak E., Turner R., 2015. Spatial point Canham C.D., 1988. Growth and canopy architecture of
patterns: methodology and applications with R. shade-tolerant trees: the response of Acer saccharum
Chapman and Hall/CRC Press, Boca Raton. and Fagus grandifolia to canopy gaps. Ecology 69:
Baddeley A., Rubak E., Turner R., 2020. Spatial point 786-795. https://doi.org/10.2307/1941027
pattern analysis, model-fitting, simulation, tests. R Canham C.D., Le Page P.T., Dave C.K., 2004. A
package ‘spatstat’ v1.64-1. https://cran.r-project.org/ neighborhood analysis of canopy tree competition:
web/packages/spatstat/spatstat.pdf effects of shading versus crowding. Canadian Journal of
Bai X., Queenborough S.A., Wang X., Zhang J., Li B., Forest Research 34: 778-787. https://doi.org/10.1139/
Yuan Z., Xing D., Lin F., Ye J., Hao Z., 2012. Effects x03-232
of local biotic neighbors and habitat heterogeneity Catovsky S., Bazzaz F.A., 2002. Feedbacks between
on tree and shrub seedling survival in an old-growth canopy composition and seedling regeneration in
temperate forest. Oecologia 170: 755-765. https://doi. mixed conifer broad-leaved forests. Oikos 98: 403-420.
org/10.1007/s00442-012-2348-2 https://doi.org/10.1034/j.1600-0706.2002.980305.x
Bândiu C., 1977. Lumina ca factor stabilizator al Cavard X., Bergeron Y., Chen H.Y.H., Pare D., Laganiere
compoziției ecosistemelor de amestec de brad cu fag. J., Brassard B., 2011. Competition and facilitation
In: Preda V. (ed.), Pădurea și spațiile verzi în actualitate between tree species change with stand development.
și perspectivă. Academia RSR, Cluj-Napoca, pp. 73-82. Oikos 120: 1683-1695. https://doi.org/10.1111/j.1600-
Becker M., Drapier J., 1984. Rôle de l’allélopathie dans les 0706.2011.19294.x
difficultés de régénération du sapin (Abies alba Mill.). I Cenușă R., Popa C., Teodosiu M., 2002. Cercetări privind
Propriétés phytotoxiques des hydrosolubles d’aiguilles relaţia structură-funcţie şi evoluţia ecosistemelor
de sapin. Acta Oecologica 5: 347-356. forestiere naturale din nordul ţării. Analele ICAS 45:
Becker M., Drapier J., 1985. Rôle de l’allélopathie dans 9-19.
les difficultés de régénération du sapin (Abies alba Chave J., Muller-Landau H.C., Levin S.A., 2002.
Mill.). II Étude des lessivats naturels de feuillage, de Comparing classical community models: theoretical
litière et d’humus. Acta Oecologica 6: 31-40. consequences for patterns of diversity. American
Bennett J.A., Maherali H., Reinhart K.O., Lekberg Y., Naturalist 159: 1-23. https://doi.org/10.1086/324112
Hart M.M., Klironomos J., 2017. Plant-soil feedbacks Chen L., Mi X.C., Comita L.S., Zhang L.W., Ren H.B., Ma
and mycorrhizal type influence temperate forest K.P., 2010. Community-level consequences of density
population dynamics. Science 355: 181-184. https://doi. dependence and habitat heterogeneity in a subtropical
org/10.1126/science.aai8212 broad-leaved forest. Ecology Letters 13: 695-704.
Blundell A.G., Peart D.R., 2004. Density-dependent https://doi.org/10.1111/j.1461-0248.2010.01468.x
population dynamics of a dominant rain forest canopy Chesson P., 2000. Mechanisms of maintenance of species
tree. Ecology 85: 704-715. https://doi.org/10.1890/01- diversity. Annual Review of Ecology and Systematics
4101 31: 343-366.
Bolker B.M., Brooks M.E., Clark C.J., Geange S.W., Chi X., Tang Z., Xie Z., Guo Q., Zhang M., Ge J., Xiong
Poulsen J.R., Stevens M.H.H., White J.S.S., 2009. G., Fang J., 2015. Effects of size, neighbors, and site
Generalized linear mixed models: a practical guide for condition on tree growth in a subtropical evergreen and
ecology and evolution. Trends in Ecology and Evolution deciduous broadleaved mixed forest, China. Ecology
24: 127-135. https://doi.org/10.1016/j.tree.2008.10.008 and Evolution 5: 5149-5161. https://doi.org/10.1002/
Bolte A., Kampf F., Hilbrig L., 2013. Space sequestration ece3.1665
below ground in old-growth spruce-beech forests – Comita L.S., Muller-Landau H.C., Aguilar S., Hubbell S.P.,
signs for facilitation? Frontiers in Plant Science 4: 322. 2010. Asymmetric density dependence shapes species
https://doi.org/10.3389/fpls.2013.00322 abundances in a tropical tree community. Science 329:
26Gafta et al. Neighbourhood-based evidence of tree diversity ...
330-332. https://doi.org/10.1126/science.1190772 org/10.1007/s40725-016-0031-2
Comita L.S., Queenborough S.A., Murphy S.J., Eck Fox J.F., 1977. Alternation and coexistence of tree
J.L., Xu K.Y., Krishnadas M., Beckman N., Zhu species. American Naturalist 111: 69-89. https://doi.
Y., 2014. Testing predictions of the Janzen-Connell org/10.1086/283138
hypothesis: a meta-analysis of experimental evidence Getzin S., Wiegand T., Wiegand K., He F.L., 2008.
for distance- and density-dependent seed and seedling Heterogeneity influences spatial patterns and
survival. Journal of Ecology 102: 845-856. https://doi. demographics in forest stands. Journal of Ecology
org/10.1111/1365-2745.12232 96: 807-820. https://doi.org/10.1111/j.1365-
Das A.J., Battles J.J., van Mantgem P.J., Stephenson 2745.2008.01377.x
N.L., 2008. Spatial elements of mortality risk in old- Gilbert B., Lechowicz M.J., 2004. Neutrality, niches, and
growth forests. Ecology 89: 1744-1756. https://doi. dispersal in a temperate forest understory. Proceedings
org/10.1890/07-0524.1 of the National Academy of Sciences USA 101: 7651-
de la Cruz M., 2020. Individual diversity-area relationships. 7656. https://doi.org/10.1073/pnas.0400814101
R package ‘idar’ v1.1. https://cran.r-project.org/web/ Gravel D., Beaudet M., Messier C., 2008. Partitioning
packages/idar/idar.pdf the factors of spatial variation in regeneration density
Diaci J., Rozenbergar D., Anic I., Mikac S., Saniga M., of shade-tolerant tree species. Ecology 89: 2879-2888.
Kucbel S., Visnjic C., Ballian D., 2011. Structural https://doi.org/10.1890/07-1596.1
dynamics and synchronous silver fir decline in Harms K.E., Condit R., Hubbell S.P., Foster R.B., 2001.
mixed old-growth mountain forests in Eastern and Habitat associations of trees and shrubs in a 50-ha
Southeastern Europe. Forestry 84: 479-491. https://doi. neotropical forest plot. Journal of Ecology 89: 947-959.
org/10.1093/forestry/cpr030 https://doi.org/10.1111/j.1365-2745.2001.00615.x
Diaci J., Rozenbergar D., Boncina A., 2010. Stand dynamics Heiri C., Wolf A., Rohreb L., Bugmann H., 2009. Forty
of Dinaric old-growth forest in Slovenia: are indirect years of natural dynamics in Swiss beech forests:
human influences relevant? Plant Biosystems 144: 194- structure, composition, and the influence of former
201. https://doi.org/10.1080/11263500903560785 management. Ecological Applications 19: 1920-1934.
Diggle P.J., 2010. Nonparametric methods. In: Gelfand https://doi.org/10.1890/08-0516.1
A.E., Diggle P.J., Fuentes M., Guttorp P. (eds.), Hiura T., Fujiwara K., 1999. Density-dependence and
Handbook of spatial statistics. CRC Press, Boca Raton, co-existence of conifer and broad-leaved trees in a
pp. 299-316. Japanese northern mixed forest. Journal of Vegetation
Dobrowolska D, 1998. Structure of silver fir (Abies alba Science 10: 843-850. https://doi.org/10.2307/3237309
Mill.) natural regeneration in the ‘Jata’ reserve in Hou J., Mi X., Liu C., Ma K., 2004. Spatial patterns and
Poland. Forest Ecology and Management 110: 237-247. associations in a Quercus-Betula forest in northern
https://doi.org/10.1016/S0378-1127(98)00286-2 China. Journal of Vegetation Science 15: 407-414.
Dobrowolska D., Veblen T.T., 2008. Treefall-gap structure https://doi.org/10.1111/j.1654-1103.2004.tb02278.x
and regeneration in mixed Abies alba stands in central Hubbell S.P., 2006. Neutral theory and the evolution of
Poland. Forest Ecology and Management 255: 34-69. ecological equivalence. Ecology 87: 1387-1398. https://
https://doi.org/10.1016/j.foreco.2008.02.025 doi.org/10.1890/0012-9658(2006)87[1387:NTATEO]2
Doniță N., Chiriță C., Stănescu V. (eds.), 1990. Tipuri de .0.CO;2
ecosisteme forestiere din România. Centrul de Material Hurtt G.C., Pacala S.W., 1995. The consequences of
Didactic și Propagandă Agricolă, București. recruitment limitation: reconciling chance, history
Duduman G., Roibu C.C., Duduman M.L., Miron- and competitive differences between plants. Journal of
Onciul M., 2010. The influence of competition and Theoretical Biology 176: 1-12. https://doi.org/10.1006/
dimensional-spatial characteristics of trees on their jtbi.1995.0170
radial growth in old-growth Slătioara forest, Romania. Illian J.B., Penttinen A., Stoyan H., Stoyan D., 2008.
AES Bioflux 2: 215-230. Statistical analysis and modelling of spatial point
Duduman G., Tomescu C., Drăgoi M., Palaghianu patterns. John Wiley & Sons, Chichester.
C., 2014. Variabilitatea dimensională a arborilor şi Janík D., Adam D., Hort L., Král K., Šamonil P., Unar P.,
diversitatea florei vasculare în amestecuri de răşinoase Vrška T., 2014. Tree spatial patterns of Abies alba and
cu fag din rezervaţia Codrul secular Slătioara. Bucovina Fagus sylvatica in the Western Carpathians over 30
Forestieră 14: 135-147. years. European Journal of Forest Research 133: 1015-
Espinosa C., Cruz M., Jara-Guerrero A., Gusmán E., 1028. https://doi.org/10.1007/s10342-014-0819-1
Escudero A., 2015. The effects of individual tree Janík D., Král K., Adam D., Hort L., Šamonil P., Unar
species on species diversity in a tropical dry forest P., Vrška T., McMahon S., 2016. Tree spatial patterns
change throughout ontogeny. Ecography 39: 329-337. of Fagus sylvatica expansion over 37 years. Forest
https://doi.org/10.1111/ecog.01328 Ecology and Management 375: 134-145. https://doi.
Forrester D.I., Bauhus J., 2016. A review of processes org/10.1016/j.foreco.2016.05.017
behind diversity-productivity relationships in forests. Johnson D.J., Bourg N.A., Howe R., McShea W.J., Wolf A.,
Current Forestry Reports 2: 45-61. https://doi. Clay K., 2014. Conspecific negative density-dependent
27Ann. For. Res. 64(1): 13-30, 2021 Research article mortality and the structure of temperate forests. Ecology Assessing the scale-specific importance of niches and 95: 2493-2503. https://doi.org/10.1890/13-2098.1 other spatial processes on beta diversity: a case study Jonášová M., Prach K., 2004. Central-European mountain from a temperate forest. Oecologia 159: 377-388. spruce (Picea abies (L.) Karst.) forests: regeneration https://doi.org/10.1007/s00442-008-1214-8 of tree species after a bark beetle outbreak. Ecological Lasky J.R., Uriarte M., Boukili V.K., Chazdon R.L., 2014. Engineering 23: 15-27. https://doi.org/10.1016/j. Trait-mediated assembly processes predict successional ecoleng.2004.06.010 changes in community diversity of tropical forests. Keren S., Motta R., Govedar Z., Lucic R., Medarevic M., Proceedings of the National Academy of Sciences Diaci J., 2014. Comparative structural dynamics of USA 111: 5616-5621. https://doi.org/10.1073/ the Janj mixed old-growth mountain forest in Bosnia pnas.1319342111 and Herzegovina: are conifers in a long-term decline? Lieberman M., Lieberman D., 2007. Nearest-neighbor Forests 5: 1243-1266. https://doi.org/10.3390/f5061243 tree species combinations in tropical forest: the role of King D.A., Wright S.J., Connell J.H., 2006. The chance, and some consequences of high diversity. Oikos contribution of interspecific variation in maximum tree 116: 377-386. https://doi.org/10.1111/j.2006.0030- height to tropical and temperate diversity. Journal of 1299.15370.x Tropical Ecology 22: 11-24. https://doi.org/10.1017/ Loosmore N.B., Ford E.D., 2006. Statistical inference S0266467405002774 using the G or K point pattern spatial statistics. Klopcic M., Jerina K., Boncina A., 2010. Long-term Ecology 87: 1925-1931. https://doi.org/10.1890/0012- changes of structure and tree species composition in 9658(2006)87[1925:SIUTGO]2.0.CO;2 Dinaric uneven-aged forests: are red deer an important Mina M., del Río M., Huber M.O., Thürig E., Rohner factor? European Journal of Forest Research 129: 277- B., 2018. The symmetry of competitive interactions in 288. https://doi.org/10.1007/s10342-009-0325-z mixed Norway spruce, silver fir and European beech Kotanen P.M., 2007. Effects of fungal seed pathogens forests. Journal of Vegetation Science 29: 775-787. under conspecific and heterospecific trees in a temperate https://doi.org/10.1111/jvs.12664 forest. Canadian Journal of Botany 85: 918-925. https:// Nagel T., Svoboda M., Diaci J., 2006. Regeneration doi.org/10.1139/B07-088 patterns after intermediate wind disturbance in an old- Koukoulas S., Blackburn G.A., 2005. Spatial relationships growth Fagus-Abies forest in southeastern Slovenia. between tree species and gap characteristics in broad- Forest Ecology and Management 226: 268-278. https:// leaved deciduous woodland. Journal of Vegetation doi.org/10.1016/j.foreco.2006.01.039 Science 16: 587-596. Nagel T.A., Svoboda M., Rugani T., Diaci J., 2010. Gap Kraft N., Adler P., Godoy O., James E., Fuller S., Levine regeneration and replacement patterns in an old-growth J.M., 2015. Community assembly, coexistence, and the Fagus-Abies forest of Bosnia-Herzegovina. Plant environmental filtering metaphor. Functional Ecology Ecology 208: 307-318. https://doi.org/10.1007/s11258- 29: 592-599. https://doi.org/10.1111/1365-2435.12345 009-9707-z Kuang X., Yuan Z., Lin F., Ye J., Wang X., Wang Y., Hao Z., Nakashizuka T., Kohyama T., 1995. The significance of 2017. Conspecific density dependence and community the asymmetric effect of crowding for coexistence in a structure: insights from 11 years of monitoring in an old- mixed temperate forest. Journal of Vegetation Science growth temperate forest in Northeast China. Ecology 6: 509-516. https://doi.org/10.2307/3236349 and Evolution 7: 5191-5200. https://doi.org/10.1002/ Orman O., Szewczyk J., 2015. European beech, silver ece3.3050 fir, and Norway spruce differ in establishment, height Kuninaga T., Hirayama K., Sakimoto M., 2015. Negative growth, and mortality rates on coarse woody debris and canopy-understorey interaction shapes the sapling forest floor - a study from a mixed beech forest in the bank of Fagus crenata in a cool-temperate, conifer- Western Carpathians. Annals of Forest Science 72: 955- hardwood mixed forest. Plant Ecology 216: 1191-1202. 965. https://doi.org/10.1007/s13595-015-0492-7 https://doi.org/10.1007/s11258-015-0501-9 Pacala S.W., Levin S.A., 1997. Biologically generated Kunstler G., Falster D., Coomes D.A., Hui F., Kooyman spatial pattern and the coexistence of competing species. R.M., Laughlin D.C., Poorter L., Vanderwel M., In: Tilman D., Kareiva P. (eds.), Spatial ecology: the Vieilledent G., Wright S.J., Aiba M., Baraloto C., role of space in population dynamics and interspecific Caspersen J., Cornelissen J.H.C., Gourlet-Fleury S., interactions. Princeton University Press, Princeton, pp. Hanewinkel M., Herault B., Kattge J., Kurokawa 204-232. H., Onoda Y., Peñuelas J., Poorter H., Uriarte M., Paluch J., Bartkowicz L., Moser W.K., 2019. Interspecific Richardson S., Ruiz-Benito P., Sun I.-F., Ståhl G., effects between overstorey and regeneration in small- Swenson N.G., Thompson J., Westerlund B., Wirth C., scale mixtures of three late-successional species in Zavala M.A., Zeng H., Zimmerman J.K., Zimmermann the Western Carpathians (southern Poland). European N.E., Westoby M., 2016. Plant functional traits have Journal of Forest Research 138: 889-905. https://doi. globally consistent effects on competition. Nature 529: org/10.1007/s10342-019-01209-y 204-207. https://doi.org/10.1038/nature16476 Paluch J., Gruba P., 2012. Effect of local species Laliberté E., Paquette A., Legendre P., Bouchard A., 2009. composition on topsoil properties in mixed stands 28
You can also read