NEODYMIUM AND PRASEODYMIUM 'NDPR' BIGGEST BLIND SPOT IN THE GLOBAL COMMODITY MARKET

Page created by Kevin Munoz
 
CONTINUE READING
NEODYMIUM AND PRASEODYMIUM 'NDPR' BIGGEST BLIND SPOT IN THE GLOBAL COMMODITY MARKET
Neodymium and Praseodymium ‘NdPr’
Biggest Blind Spot in the Global Commodity Market

the number
     you need to remember

PRESENTATION 8th NOVEMBER 2018
Metal Events 15th int. Rare Earth Conference HK 2018 November
Michael Prassas, GM Marketing, Sales and Business Development
NEODYMIUM AND PRASEODYMIUM 'NDPR' BIGGEST BLIND SPOT IN THE GLOBAL COMMODITY MARKET
Disclaimer

The information in this document has been prepared as at Novemeber 2018. The document is for information purposes only and has been extracted entirely from documents or materials publicly filed with the
Australian Stock Exchange and/or the Australian Securities and Investments Commission. This presentation is not an offer or invitation to subscribe for or purchase securities in the Company. The release,
publication or distribution of this presentation in certain jurisdictions may be restricted by law and therefore persons in such jurisdictions into which this presentation is released, published or distributed should
inform themselves about and observe such restrictions.

Certain statements contained in this document constitute “forward-looking statements” within the meaning of the United States Private Securities Litigation Reform Act of 1995 and forward looking information
under the provisions of Canadian provincial securities laws. When used in this document, the words “anticipate”, “expect”, “estimate”, “forecast”, “will”, “planned”, and similar expressions are intended to
identify forward-looking statements or information. Such statements include without limitation: statements regarding timing and amounts of capital expenditures and other assumptions; estimates of future
reserves, resources, mineral production, optimization efforts and sales; estimates of mine life; estimates of future internal rates of return, mining costs, cash costs, mine site costs and other expenses; estimates of
future capital expenditures and other cash needs, and expectations as to the funding thereof; statements and information as to the projected development of certain ore deposits, including estimates of
exploration, development and production and other capital costs, and estimates of the timing of such exploration, development and production or decisions with respect to such exploration, development and
production; estimates of reserves and resources, and statements and information regarding anticipated future exploration; the anticipated timing of events with respect to the Company’s mine sites and
statements and information regarding the sufficiency of the Company’s cash resources. Such statements and information reflect the Company’s views as at the date of this document and are subject to certain
risks, uncertainties and assumptions, and undue reliance should not be placed on such statements and information. Many factors, known and unknown could cause the actual results to be materially different
from those expressed or implied by such forward looking statements and information. Such risks include, but are not limited to: the volatility of prices of gold and other metals; uncertainty of mineral reserves,
mineral resources, mineral grades and mineral recovery estimates; uncertainty of future production, capital expenditures, and other costs; currency fluctuations; financing of additional capital requirements; cost
of exploration and development programs; mining risks; community protests; risks associated with foreign operations; governmental and environmental regulation; the volatility of the Company’s stock price; and
risks associated with the Company’s by-product metal derivative strategies. For a more detailed discussion of such risks and other factors that may affect the Company’s ability to achieve the expectations set
forth in the forward looking statements contained in this document, see the Company’s Annual Report for the year ended 30 June 2017, as well as the Company’s other filings with the Australian Securities
Exchange. The Company does not intend, and does not assume any obligation, to update these forward-looking statements and information.

Compliance Statement

Information relating to Infrastructure, project execution, cost estimating, metallurgical test work, exploration results, Mineral Resource estimates and Ore Reserve estimates is extracted from the report entitled
“Lower price deck delivers similar BFS results for Ngualla” created on the 12th of October 2017 and is available to view on http://www.peakresources.com.au/asx-announcements/ . The company confirms that it
is not aware of any new information or data that materially affects the information included in the original market announcement and, in the case of estimates of Mineral Resources or Ore Reserves, that all
material assumptions and technical parameters underpinning the estimates in the relevant market announcement continue to apply and have not materially changed. The company confirms that the form and
context in which the Competent Person’s findings are presented have not been materially modified from the original market announcement.

                                                                                                                                                                                                                            2
NEODYMIUM AND PRASEODYMIUM 'NDPR' BIGGEST BLIND SPOT IN THE GLOBAL COMMODITY MARKET
Peak Resources - Who We Are

               Peak to become one of the world’s lowest cost rare earth producers. With a CAPEX of only
               US$ 365 million incl. 15% contingency, OPEX of US$ 91 million p.a.* and a 26 year LOM.
                                      UK Tees Valley the location of Peak’s Rare Earth Refinery
                                       Capex: US$ 165 million incl. 15% contingency plus 5% owners costs Opex: US$ 40million p.a.
                                       Location: Top logistics infrastructure + skilled labour + sustainable waste management facilities
                                       Annual Production: 9,290 tpa of oxide equivalent = Oxide 2,810 tpa NdPr 2N; Carbonate = 12,095tpa = 7,995 tpa La; 3,475 tpa Ce & 625 tpa SEG/HRE
                                       32.24 US$/kg NdPr - The breakeven point for positive cash flow considering total OPEX divided with only the 2,810 tpa NdPr oxide production

                                                                                                                                                                                                                                                                                                         32.24
                                                                                                                                                  UK
                                                                        USA                                                                           EU                                                                         Korea
                   Key markets
                                                                                                                                                                                                                      China                  Japan
                                                                                                                                                                                                   India                                                                                                  US$/ kg NdPr#
                                                                                                                                                                                                                                                                                                    # OCBRITDA = Operating cost before royalties,
                                                                                                                                                                                                                                                                                                      interest, tax, depreciation and amortization

                                                                                                                                                       Ngualla                   Dar es Salaam
                                                                                                                                                                                                                                                                                Australia HQ.

                                                                                                                                                                                                                              Perth

                                                                                                                                                                                                                                                       Sydney

                                      Tanzania Ngualla Project, one of the largest and highest grade undeveloped NdPr deposits worldwide
                                       Ore Resource: 214.4 mt at 2.15% REO; Ore Reserve: 18.5 mt at 4.8% REO; 22% of the total Mineral Resource, approx. 887,000 t REO
                                       Capex: US$ 200 million incl. 15% contingency plus 5% owners costs; Opex: US$ 51 million; Life of mine: 26 year ; Mill feed rate 711,000 tpa; Strip
                                        ratio 1.77; Rare earth concentrate: 32,700 tpa of 45%

*See ASX Announcement “Higher grade Resource for Ngualla nearly 1 million “and ASX Announcement “Ngualla Rare Earth Project – Updated Ore Reserve” as of 12 April 2017 and : “BFS positions Ngualla one of worlds lowest cost RE Projects”as of 12 April 2017 and: “BFS Update - Lower price deck delivers similar BFS results for Ngualla” as of October 2017

                                                                                                                                                                                                                                                                                                                                                                 3
NEODYMIUM AND PRASEODYMIUM 'NDPR' BIGGEST BLIND SPOT IN THE GLOBAL COMMODITY MARKET
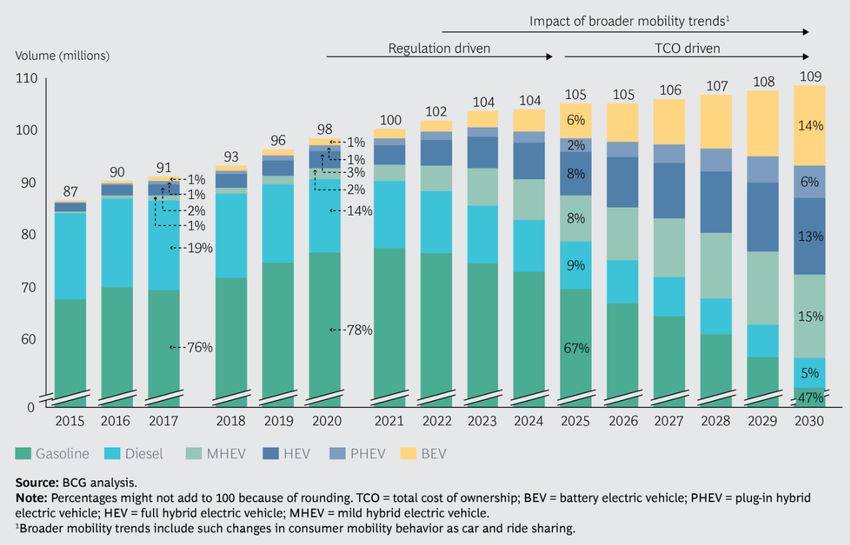
Automotive - EVs On the Verge of Mass Production

BEHIND EACH BATTERY IS A MOTOR
Over 90% of all new energy vehicles will be equipped with an NdFeB permanent magnet motor.
0.5-1kg per is the incremental demand for neodymium (Nd) and praseodymium (Pr)
for each internal combustion vehicle (ICV) which gets replaced by an new energy electric vehicle (48v mild Hybrid, HEV, PHEV, BEV)

                                                                                                                                     4
NEODYMIUM AND PRASEODYMIUM 'NDPR' BIGGEST BLIND SPOT IN THE GLOBAL COMMODITY MARKET
Key Enabler - Governmental Legislation Underpins NdPr Demand

    Major vehicle markets C02 emission regulation                                                                                                           What does this mean? Required powertrain portfolios:
    Country    2012    2013   2014   2015   2016   2017   2018   2019   2020   2021   2022   2023   2024   2025    2026   2027   2028   2029   2030
                                                                                                                                                            •      World of today – above 100g CO2/km
                                                                                                                                                                   a portfolio of ICE, mild-hybrids and less than 10% electrification can
     China       180 g/km                          168 g/km                     117 g/km = ~5L                              unknown                                meet the target

        EU       140 g/km                          130 g/km                       95 g/km = ~4 L                  80 g/km                      62g/km
                                                                                                                                                            •      Mix of powertrains – below 100g CO2/km
                                                                                                                                                                   a “portfolio game” with equal importance of ICE, PHEV & BEV & 48v
       USA       180 g/km                          160 g/km                                                       103 g/km       unknown                           mild hybrids can meet the requirements
                                                                                                                                                            •      EV World – below 50g CO2/km
      Japan       110 g/km                         125 g/km                     105 g/km                                         unknown                           achieving the target only possible with a portfolio mainly consisting of
                                                                                                                                                                   EV’s and PHEVs

    Energy efficiency regulation worldwide for electric motor and generators
    According to a recent IEA study electric motors are responsible for 53% of global electricity use. Industry standards IE1-IE4/IE5 + further alignment on test procedures will support the continuous growth PM motors/ generators

              2018                                        2021                                  2025                                           2030                           2035                                     2040
              China:
              - NEV quota = 10% and 12% for 2019+2020; max points with +350km reach                                                                     India: Only sales of NEV by 2030
              - By 2020 OEM’s need to meet 5l/100km
              - Biggest single car market 2017 with 25.8m (EMEA 21m & NA=20.9m)
              - Target 5m NEV stock by 2020.                                                                                                            Ireland: Sales ban of ICE by 2030
              - Target 20% of production + sales in 2025 = ~ 5-7m p.a.
              - ICE ban pending                                                                                                                                                                                       France: Sales ban of ICE by 2040
                                                                                                                                                        Netherlands: Sales ban of ICE by 2030
              10th October 2018: EU Countries - EU commission (-15%/-35% based on 2021
              values) and the EU Parliament (-20%/-40%) are in discussions to determine the new                                                         Slovenia: Sales ban of ICE by 2030                            UK: Sales ban of ICE by 2040
              standards for 2025 and 2030. VW CEO Mr. Dies commented: In case the 40% target
              get implemented 50% of the new vehicle sales needs to be electrified by 2030.                                                                                                                           Sri Lanka: Fleet w/o ICEs by 2040
                                                                                                                                                        Norway: Sales ban of ICE by 2030

              Japan: County goal 30% NEVs of sales in 2030;                                                                                                                                                           Sweden: Fleet w/o ICEs by 2045
                                                                                                                                                        Scotland: Sales ban of ICE by 2032

              US: 8 states have set targets = 3.3m cars by 2025;                                                            Fossil Free Street Declaration Auckland, Barcelona, Cape Town, Copenhagen,
                                                                                                                            London, Los Angeles, Mexico City, Milan, Oxford, Paris, Quito, Seattle, Vancouver,
                                                                                                                                                                                        Source: ICCT; national industry bodies, transportenvironment.org, Mckinsey , Gov. announcements

                                                                                                                                                                                                                                                                                  5
NEODYMIUM AND PRASEODYMIUM 'NDPR' BIGGEST BLIND SPOT IN THE GLOBAL COMMODITY MARKET
Automotive - Behind each Battery is a Motor!

                      •   China leads the way with their quota system & 2025 target = 20% electrification
                      •   Followed by EU, establishing an indirect EV quota with 2025/ 2030 legislation
                      •   2025 EU - Emission targets translate to ~15-20% electrification
                      •   2030 EU - Emission target translates ~30-40% electrification

                      •   Best in class technology! NdFeB magnet motors offer greater torque than competing
                          technologies, the same values of current and voltage and more power by weight
                      •    ~90% of all electric vehicles have a NdFeB permanent magnet motor
                      •   Each electric vehicle represents approx. 1 kg incremental NdPr demand

                                                                                                              6
Automotive - NdFeB Permanent Magnet Motor - Best in class!

   Synchronous Permanent Magnet Motors (PMM) - Best in class!
                                                                                                                                                                                 Electric Motor Types
   Technology:             Enabling OEMs to design a more cost optimized, lightweight (up                                                                     Synchronous                                              Asynchronous
                           to 20% smaller and lighter) vehicle and more efficient powertrain
                           solutions with a 15-20% smaller battery at the same driving reach.        current-excited SM               Permanent magnet*                          Reluctance                                Unipolar
                           The battery represent ~30% of a BEV vehicle manufacturing cost!
                                                                                                                                          Surface PM*                                                              Induction double fed
   Price sensitivity:      Rare earth minerals represent between                                                                            Inset PM*                          Single Salient                       Ind. Wound Rotor
                           0.23%* - 0.47% of the total vehicle (42k US$) cost or
                           8%* -15% of total Driveline (1200 US$) cost or                                                                 Interior PM*                        Double Salient                       Ind. Alu. Coper Rotor
                           12%* - 25% of the total electric motor (800 US$) cost
                           *NdPr oxide 42 US$/kg & Dy 180 US$/kg                                                                                         PM-Reluctance Hybrid*

   Market share:           ~90% of all EVs (PHEV, BEV, HV) have a PMM today                                                       * Contain NdPr / NdFeB magnets
   NdPr demand:            Each NEV represents approx. 0.5-1 kg incremental NdPr demand

  Core technology dev. & platform decisions

               2018                                    2021                                   2025                 2030                                     2035                                   2040

       1.                                                 ~5 Year development                  SOP         ~4-6 years in production                                          Legal obligation 10 year minimum - Spare part business
   Standard
    Vehicle         ~5 Year development          SOP               ~4-6 years in production                   Legal obligation 10 years minimum - Spare part business
   Lifecycle
                         6-12 m volume ramp-up

      2.                        48v mild Hybrids
  Technology                                                               48v/ PHEV + BEV
   Roadmap
                                                                                                      PHEV + BEV
                                                                                                                                                                                     BEV

       3.
    Vehicle
   weight vs                                                                      KG
     cost
                                                                                                                                                                    Source: Mckinsey + others; image Pm & Ind Image Courtesy of New Energy and Fuel.com

                                                                                                                                                                                                                                                  7
Automotive - Multibillion US$ Committed in Investment

                      •   China leads the way with their quota system & 2025 target = 20% electrification
                      •   Followed by EU, establishing an indirect EV quota with 2025/ 2030 legislation
                      •   2025 EU - Emission targets translate to ~20% electrification
                      •   2030 EU - Emission target translates ~40% electrification

                      •   NdFeB magnet motors offer greater torque than competing technologies, the same
                          values of current and voltage and more power by weight
                      •   ~90% of all electric vehicles have a NdFeB permanent magnet motor
                      •   Each electric vehicle represents approx. 1 kg incremental NdPr demand

                      •   The global automotive industry committed ~ US $400 b investment in EVs
                      •   E-mobility represents a total new, incremental demand source for NdPr operating in
                          a multi million unit sales mass market.

                                                                                                               8
Automotive - Industrial Capacity Has Been Deployed

                                     Car manufacturers have announced 200 new EV model launches
                                     by 2019* and ~700** by 2030
                                     *Source Mc Kinsey & Company ** car manufacturer and market announcements

                                     Available industrial lithium battery manufacturing capacity:
                                       YEAR             Installed Industrial capacity                  PHEV with 20kWh   Or BEV with 100KWh
                                       2020             ~350GWh                                        17.5 million      3.5 million

                                       2022             ~500GWh                                        25 million        5 million

                                       2025             ~800GWh                                        40 million        8 million
                                     Source: Industry information + individual company announcements

                                                                                                                                              9
Automotive - US$ ~400b Invest* & ~700 New NEV 2018-30

                                                                            Ford: 40 NEV = 16 BEV+ 24                                                            BMW: Mass production by 2020;
                                                                                                                                                                                                                                 Estimated invest of US$ ~100b across all Chinese
                                                                          PHEV by 2022; US$ 28b invest                                                           25 NEV = 13 PHEV + 12 BEV by
                                                                                                                                                                                                                                 brands and through the Chinese supply chain.
                                                                                                                                                                 2025; 15-25% ; US$ 47b invest
                                                                                                                                                                                                                                 The Chinese government perceives E-mobility as one
        YTD Oct. 2018: 423 NEV in the market                                                        GM: 20 new
                                                                                                                                                                VW Group: (12 brands): 3m                                        of the core pillars of their industrial transformation
        • 224 BEV= 63 ROW + 161 China                                                              BEV by 2023,
                                                                                                                                                                units sales + 50 BEV+30 PHEV                                     strategy, see “China 2025”. China is now the biggest
        • 68 PHV                                                                                and a significant
                                                                                                                                                                by 2025 and 20-25% of sales;                                     single automotive market worldwide with market
        • 131 HV/48v                                                                             ramp up of Bolt
                                                                                                                                                                300 BEV+PHEV models by                                           2017 with 25.8m (EMEA 21m NA=20.9m). Within the
        • 2018 Beijing Auto Show = 174 new EV                                                        production
                                                                                                                                                                2030; US$ 84b invest. 2017 =                                     top 50 of the global list of car manufacturers 24 are
                                                                                                                                                                10.7m units of which 4.2m in                                     Chinese!
                                                                                Daimler: complete line                                                          China
        Tesla Launched Model 3                                                                                                                                                                                                   Latest and future Chinese legislation will be the key
                                                                              up will be electrified ~130                                                       PSA: By 2025, the full lineup                                    influencing drivers for future portfolio decision of all
        First mass market BEV car with a
                                                                               NEV (48v+PHEV+BEV) by                                                            will be electrified for the four                                 global car manufacturers!
        PMM; weekly output since Sep18 =
                                                                                  2022; US$ 13 b invest                                                         brands min 40 BEV+PHEV
        5,300 UNITS per week , price range
        `35-52k USD; US$ 14b invest                                                                                                                             [Peugeot, Citroen, DS, Opel/
                                                                                                                                                                Vauxhall].

          2018                        2019                                      2020                                       2022 2025                                                2030                               China                        Startup’s                        l

                               Hyundai-Kia: 28 NEV by
                                                                                                                                        Fiat Chrysler: by 2022 33                                  Honda: 30% of new car sales
                             2020; in total 38 new NEV
                                                                                                                                        NEVs = Maserati 4 BEV+8                                    NEV FC + EV + PHEV by 2030.
                              by 2025; 40% of sales by                                                                                                                                                                                                            US$ 3.3b invest
                                                                                                                                        PHEV; Jeep 4 BEV and 10
                                 2025; US$ 23b invest
                                                                                                                                        PHEV; Alfa Romeo: 7 PHEV                                                                                                  US$ 2.5b invest
                                                                                                                                        and FIAT = TBA ; US$ 9b                                    Toyota: 10 new BEV by 2020s;
                                 JLR: by 2020 complete line                                                                             Invest                                                     5.5m with NEV = 4.5m by                                        US$ 1.13b invest
                                    up will have a 13 NEV =                                                                             Nissan: 8 new BEV by 2022,                                 PHEV+EHV &, Rest BEV; ~50% of
                                             48v+PHEV+BEV                                                                               ~20% of total sales = 1m sales                             annual sales by 2030;
                                                                                                                                                                                                                                                                  US$ 0.79b invest
                                                                                                                                        of NEVs by 2022; 35-45% sales                              US$ 10b invest.
                                                                                                                                        by 2025; Nissan Leaf
Volvo: All new models = 8 NEV (48v mild hybrid,                                                                                                                                                                                                                   US$ 0.7b invest
PHEV + BEV) by 2019; 50% of sales NEV by 2025;                                                                                                                                                     Mazda: to electrify all IC
                                                                                                                                        Renault: 8 BEV and 12
                                                                                                                                                                                                   engines by 2030
    Gelly: 90% of sales to be with NEV by 2020;                                                                                         PHEV by 2022; 50% of
                                                                                                                                        sales should be BEV or                                                                                                    US$ 0.6b invest
                      65% PHEV and 35% BEVs;
Target to launch 30 NEV by 2025; US$ 41b invest                                                                                         PHEV by 2022; US$ RNM
                                                                                                                                        12b invest                                                                                                                US$ 0.2b invest
Source: Individual company announcements, Bloomberg & Peak Resources estimations & others, Investment number incl. Battery inv. + vehicle R&D + industrial manuf. Invest

                                                                                                                                                                                                                                                                                            10
Automotive - Additional Models Will Accelerate Adoption

                                                   For the Model 3, Tesla made the decision to use
                                                   a NdFeB Permanent Magnet Motor representing
                                                   sales of 500k per year, an annual incremental
                                                   demand of 500-600 tpa NdPr.

                                                    Adoption curves are accelerating year by year
                                                    outpacing all expectations.

                                                    We believe the automotive landscape will
                                                    transform fundamentally in the next 5 years
                                                    starting with the urban areas.

                                                                                                    11
Automotive - Forecast, Cost prediction & TCO impact

            Powertrain cost comparison for 60kwh/500km range (w/o subsidies) cost of an ex battery power train for an EV is estimated at 2.000 US$ / Source: Bernstein s
              EV leaders cost crossover 2021-2022         EV mainstream cost crossover 2023-2024                 ICE game over 2029 – BEV cheaper than ICE

            2018 TCO = LeasePlan announced that in Norway and Netherlands EVs became cheaper than ICE. Belgium and UK are close

                                                                                                                                                                           12
NdPr - Facts That Matters - connecting the Dots …

             Lithium battery                                                                                                              NdPr oxide                                                     2017 global
                                                                         NEV Model
             manufacturing                                                                                 Market share                  incremental                                                      legal NdPr
                                                                       announcements
                 capacity                                                                                                                  demand                                                        production
                                                                                                                  ~90%
                                                                          2020 = ~+59 NEV*                 NdFeB motors - No1          1 NEV = 1kg
                 2020 = 350GWh                                           2022 = ~+271 NEV*                                                                                                              27,000 tpa NdPr#
                 2023 = 500GWh                                                                             leading technology        1m NEVs = 1000t
                                                                         2025 = ~+365 NEV*                                         27m NEVs = 27,000t =
                 2025 = 800GWh
                                                                                                                                    25% of 105m vehicles p.a.

                                                      All these facts indicate that the NdPr supply risk increases as electric vehicle sales rise!

                    NEVs are just one of the NdFeB megatrends – Just think what happens when you factor in developments in wind energy,
                                 mobile robotic solutions, Drones + E-planes, E-bikes, E- bicycles and consumer electronics etc.

*New   Models numbers without Chinese's OEM except Geely; PEAK estimate +30% on global numbers for China                        #2017   = China 105k quota = 21k NdPr + Lynas ‘17 = 5,223 tpa NdPr; Peak estimation incl. Illegal production = 45kt pa

                                                                                                                                                                                                                                                13
E-Mobility - The Future - Connecting the Dots

             Learn more about the market and the individual dynamics and enablers.
                   Download our recently published white paper of 115 Pages:

                “NdPr: The Biggest Blind Spot in the Global Commodity Market”

                        http://www.peakresources.com.au/whitepaper/

                                                                                     14
PEAK RESOURCES - Best in Class

The Right Investment Proposition                                             The Right Team
One of the Highest Grade, Lowest Cost NdPr                                   Experienced Board and Management with
Projects Globally                                                            track record of delivery. Extensive industry
                                                                             experience with:
•    Significant potential investment upside with a clear
     strategy to become a near term fully integrated                         •   Rocky Smith (CEO) ex-MD of Molycorp’s
     NdPr producer                                                               Mountain Pass Rare Earth Complex,
•    Total Opex/kg NdPr = US $32.24                                          •   Michael Prassas (GM Sales), ex-Global Sales
•    CAPEX of US $365m; OPEX of US $91m pa                                       Account Manager Solvay/Rhodia Catalysis
•    NdPr Oxide production 2,810 tpa                                         •   Peter Meurer (Chairman), current Non-
•    Post-tax NPV8 of US $612m                                                   Executive Chairman of Nomura Australia and
•    IRR 22% at NdPr price of US $77.50/kg                                       former Vice Chairman of Citi and Merrill Lynch
•    BFS completed
•    UK+ Tanzanian Environmental permits received

The Right Market                                                             The Right Assets
Considerable leverage to forecast increase
                                                                             Tanzania Ngualla - Simple Geology and Mining
NdPr prices resulting from EV revolution and
                                                                             •   JORC Reserve: 18.5 mt, high grade 4.8% = 887,000 t
transition to sustainable energy                                                 REO; 21.3% NdPr, 22% of the Resource
•    NdPr is a key ingredient in NdFeB Permanent                             •   Life of Mine 26 years (only Reserve)
     Magnet Motors which are widely used in                                  •   Soft bastnasite ore body, open pit, strip ratio 1.77:1
     electric vehicle motors and direct drive wind
                                                                             Peak’s UK refinery is a key differentiator
     turbines
                                                                             •   The BFS covers a SX-Refinery to assure that Peak
•    The market is projected to double in volume
                                                                                 will be becoming a fully integrated producer from
     by 2025 with approximately 50% price
                                                                                 Mine to NdPr oxide outside of China. Enabling Peak
     increase over the same period
                                                                                 to capture the full value of the material compared
                                                                                 to other developers its peers who aim for
                                                                                 concentrate/ mix carbonate only sales operation

NGUALLA RARE EARTH PROJECT: UNDERSTOOD – DE-RISKED – COMPETETIVE – MANAGABLE – READY TO BE DELIVERED

                                                                                                                                   15
PEAK RESOURCES - Glossary

   CAPEX = Capital Expenditure                                    kg     = Kilogram
   OPEX = Operation Expenditure                                   tpa    = tonnes per annum/ per year
   REO = Rare Earth Oxide                                         b      = Billion
   p.a. = per annum/ per year                                     km     = Kilometre
   NdPr = Neodymium Praseodymium oxide                            m      = Million
                                                                  K      = Thousands
   ICV    = Internal Combustion Vehicle                           US$    = United States Dollar
   ICE    = Internal Combustion Engine
   EV     = Electric Vehicle                                      EU     = European Union
   HEV    = Hybrid Electric Vehicle                               ROW    = Rest of the World
   PHEV   = Plug-in Electric Vehicle                              NA     = North America
   BEV    = Battery Electric Vehicle                              EMEA   = Europe Middle East Africa
   48v    = 48v or MHEV = mild hybrid electric vehicle
   NEV    = New Energy Electric Vehicle (48v/MHEV,HEV,PHEV,BEV)
                                                                  g      = Gram
   SOP = Start Of Production of a new vehicle model               w/o    = without
   NdFeB = Neodymium-Iron-Boron permanent magnets                 TCO    = Total Cost Of Ownership
   PM    = Permanent Magnet                                       KWh    = Kilowatt hour
   PMM = Permanent Magnet Motor                                   GWh    = Gigawatt hour

NGUALLA RARE EARTH PROJECT: UNDERSTOOD – DE-RISKED – COMPETETIVE – MANAGABLE – READY TO BE DELIVERED

                                                                                                        16
Peak Resources Limited
Ground Floor,
5 Ord Street,
West Perth,
Western Australia 6005
PO Box 603, West Perth 6872.
ASX: PEK ACN 112 546 700
Telephone: +61 8 9200 5360
info@peakresources.com.au
Company Secretary:
Graeme Scott
Chief Executive Officer:
Rocky Smith
Non-Executive Chairman:
Peter Meurer
Non-Executive Directors:
Darren Townsend, John Jetter, Jonathan
Murray; Tony Pearson
You can also read