Network based Fake News Detection: A Pattern driven Approach
←
→
Page content transcription
If your browser does not render page correctly, please read the page content below
Network-based Fake News Detection:
                                                                      A Pattern-driven Approach

                                                                                       Xinyi Zhou and Reza Zafarani
                                                                               Data Lab, EECS Department, Syracuse University
                                                                                       {zhouxinyi,reza}@data.syr.edu
arXiv:1906.04210v1 [cs.SI] 10 Jun 2019

                                         ABSTRACT                                                            periments [27]. Various manual fact-checking websites and
                                                                                                             platforms (e.g., PolitiFact1 and Snopes2 ) have emerged to
                                         Fake news gains has gained significant momentum, strongly
                                                                                                             serve the public on this matter. Nevertheless, manual fact-
                                         motivating the need for fake news research. Many fake news
                                                                                                             checking does not scale well with the volume of newly cre-
                                         detection approaches have thus been proposed, where most
                                                                                                             ated information, especially on social media, hence motivat-
                                         of them heavily rely on news content. However, network-
                                                                                                             ing the need for automatic fake news detection.
                                         based clues revealed when analyzing news propagation on
                                         social networks is an information that has hardly been com-         Current research on automatic fake news detection heavily
                                         prehensively explored or used for fake news detection. We           relies on news content [22]. These studies have significantly
                                         bridge this gap by proposing a network-based pattern-driven         contributed to fake news detection (see “Related Work” in
                                         fake news detection approach. We aim to study the patterns          Section 2) while often face multiple challenges.
                                         of fake news in social networks, which refer to the news being      First, the traditional approach to detect fake news is to use
                                         spread, spreaders of the news and relationships among the           a knowledge-based fact-checking system [5; 32]. The system
                                         spreaders. Empirical evidence and interpretations on the            compares relational knowledge extracted from to-be-verified
                                         existence of such patterns are provided based on social psy-        news content with that stored in a knowledge graph, often a
                                         chological theories. These patterns are then represented at         ground truth dataset collected from the Web [6; 25]. How-
                                         various network levels (i.e., node-level, ego-level, triad-level,   ever, the most serious issue by using such system is that it
                                         community-level and the overall network) for being further          can only detect false news instead of fake news (i.e., inten-
                                         utilized to detect fake news. The proposed approach en-             tionally false news) [41]. Second, another common approach
                                         hances the explainability in fake news feature engineering.         is to use a style-based fake news detection system by assum-
                                         Experiments conducted on real-world data demonstrate that           ing that fake news exhibits a distinguishable writing style
                                         the proposed approach can outperform the state of the arts.         from that of the truth [43], where malicious entities can
                                                                                                             disguise the writing style to bypass these linguistic mod-
                                                                                                             els. Recently, neural networks and deep learning techniques
                                         1.   INTRODUCTION                                                   have been well developed to detect fake news by incorporat-
                                         With “post-truth” named as the Word of the Year in 2016             ing multi-modal or social-network data, e.g., images within
                                         by the Oxford Dictionary, discussion around fake news has           news content [37; 40] and users (news spreaders) [15; 29;
                                         sparked, especially in the period around the 2016 U.S. pres-        42]; nevertheless, these models often face the problems with
                                         idential election and the U.K. Brexit referendum [44]. The          computational efficiency or interpretability [44].
                                         rise of social media and its popularity play an indispensable
                                         role in this surge of interest. Social media breaks the phys-       Present Work: Considering that social-network data re-
                                         ical distance barrier among individuals, and provides rich          lated to news propagation and spreaders has hardly been
                                         platforms for users to participate and discuss online news,         comprehensively explored (across network levels) and used
                                         where the most popular story during the critical months of          in an explainable way for fake news detection, we propose
                                         the 2016 U.S. presidential election campaign (“Pope Fran-           a network-based pattern-driven fake news detection model,
                                         cis Shocks World, Endorses Donald Trump for President,              robust against manipulations by malicious entities on news
                                         Releases Statement”, which was fake news) can generate              content. To that end, our work aims to utilize patterns in
                                         960,000 shares, reactions, and comments on Facebook [34].           fake news dissemination on social networks, which reveal
                                                                                                             that compared to the truth, fake news can (i) spread farther
                                         The situation becomes worse with the existence of an echo
                                                                                                             and (ii) attract more spreaders, where these spreaders are of-
                                         chamber effect on social media, where the biased informa-
                                                                                                             ten (iii) more strongly engaged with the news and (iv) more
                                         tion can be amplified and reinforced [10]. Meanwhile, stud-
                                                                                                             densely connected within the network. Machine learning
                                         ies have shown that humans can be irrational and vulnerable
                                                                                                             features representing these patterns are designed at differ-
                                         differentiating between truth and falsehood when overloaded
                                                                                                             ent levels of a network (i.e., node-, ego-, triad-, community-,
                                         with deceptive information; studies in social psychology and
                                                                                                             and network-level), which will be further used within a su-
                                         communications have demonstrated that human ability to
                                                                                                             pervised learning framework to detect fake news. Overall,
                                         detect deception is only slightly better than chance - with a
                                                                                                             the specific contributions of this paper are as follows:
                                         mean accuracy of 54% over 1,000 participants in over 100 ex-
                                                                                                             1
                                                                                                                 https://www.politifact.com/
                                                                                                             2
                                                                                                                 https://www.snopes.com/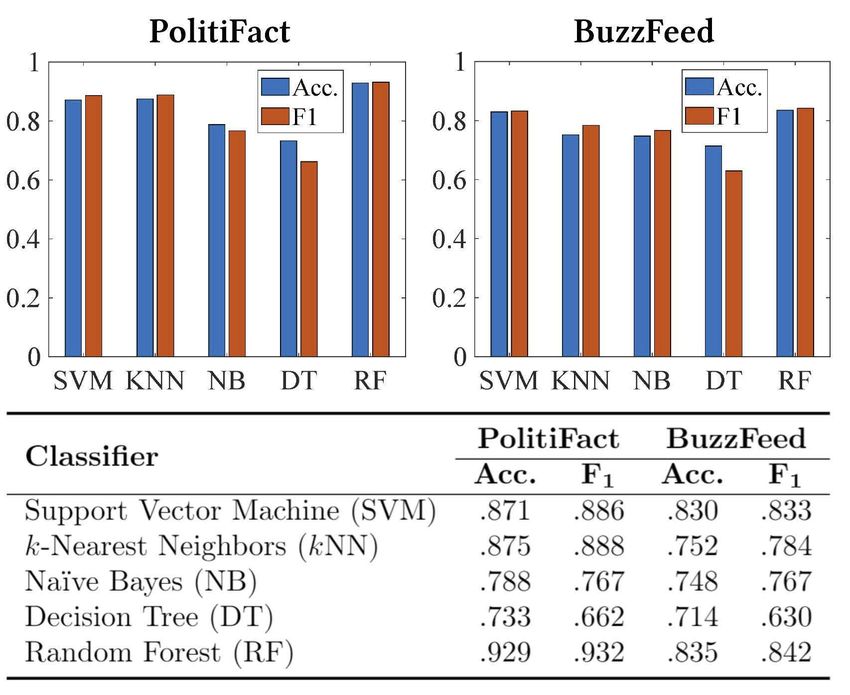
1. A network-based pattern-driven approach is proposed,         While content-based approaches can detect fake news by
   which can detect fake news in an explainable way. Exper-     analyzing news content from various perspectives, auxiliary
   iments conducted on real-world data demonstrate that         information revealed in news propagation, e.g., news spread-
   the proposed approach can perform comparatively well         ers, is not considered. In addition, approaches can be sensi-
   compared to the state of the art.                            tive to news content when heavily relying on it, where ma-
                                                                licious entities might manipulate the results of detection by
2. Fake news patterns in social networks are investigated
                                                                disguising their writing styles. Hence, network-based fake
   and summarized, which relate to the news being spread,
                                                                news detection has been emerged recently.
   spreaders of the news, and relationships among the news
   spreaders. Empirical studies and social psychological        Network-based Fake News Detection. Network-based
   theories are provided to validate and interpret the ex-      fake news detection utilizes social context information re-
   istence of these patterns;                                   vealed in news propagation. In general, it investigates two
                                                                types of networks: homogeneous and heterogeneous networks.
3. Fake news patterns are represented and quantified across
                                                                Homogeneous networks contain single type of nodes and
   multiple network levels, i.e., node, ego, triad, commu-
                                                                edges. A typical example is the stance network, which rep-
   nity, and the overall network level. Experimental results
                                                                resents the stance (e.g., for or against) similarity among
   indicate that the proposed approach can perform stably
                                                                news or posts of news. Based on such network, Jin et al.
   with limited available network information, which makes
                                                                evaluate news credibility by mining the stance correlations
   it suitable for fake news early detection.
                                                                within a graph optimization framework [11]. Another typ-
The rest of this paper is organized as follows. Section 2       ical example of homogeneous networks is the propagation
reviews current fake news detection research. Fake news         graph (tree), which presents post-repost relationships for
patterns in social networks are summarized and represented      each news article on social media, e.g., tweets and retweets
in Section 3. Experiments are conducted and presented in        on Twitter [38; 17]. Using propagation trees, for instance,
Section 4. Section 5 concludes the paper.                       Vosoughi et al. discover that fake news spreads faster, far-
                                                                ther and more broadly than the truth [36].
2.   RELATED WORK                                               Heterogeneous networks have multiple types of nodes or
As an emerging topic, the development of fake news detec-       edges. By exploring relationships among entities such as
tion is in its early stages, where the existing research can    news articles, publishers, users (spreaders) and user posts,
be generally grouped into content-based and network-based       PageRank-like algorithm [7], matrix/tensor factorization [8;
fake news detection.                                            33], and Recurrent Neural Networks (RNN) [29; 42] have
                                                                been developed for fake news detection.
Content-based Fake News Detection. Content-based                In general, our work is a complement of the current [network-
fake news detection investigates news content. One tradi-       based] studies. Compared to current studies, our work in-
tional way of detection is based on knowledge, often repre-     vestigates a homogeneous network, the friendship network.
sented as a set of (Subject, Predicate, Object) triples [6;     To our best knowledge, studying fake news with respect to
21]. Knowledge-based approaches aim to assess news au-          the friendship network is yet to be explored, which allows
thenticity by comparing the knowledge extracted from to-        one to better understand news spreaders and their social re-
be-verified news content with true knowledge (i.e., ground      lationships on various network levels. Additionally, we aim
truth) [5; 32]. Such ground truth is generally provided in a    to detect fake news in an explainable way - by utilizing its
knowledge graph such as Knowledge Vault [6], which con-         propagation characteristics on social networks, which will be
tains massive manually processed relational knowledge from      detailed in the next section.
the open Web. However, the timeliness and completeness
of knowledge graphs are still open issues, and importantly,
such approaches developed can only detect false news rather     3. FAKE NEWS PATTERNS AND REPRE-
than fake news (intentionally false news) [44].                    SENTATION IN NETWORKS
Another common way is based on writing style, a set of self-    Fake news dissemination in networks exhibits distinguish-
defined [non-latent] features well representing news writing    able patterns from the diffusion of true news. In this section,
style. Style features can be those capturing content struc-     we summarize these patterns and discuss social psychologi-
ture at various language levels such as discourse level by      cal theories that can explain the existence of these patterns.
employing rhetorical structure theory [28; 12]; or those cap-   In terms of fake news patterns, we demonstrate ways to rep-
turing specific attributes in the content such as sentiment     resent news articles as a set of features across network levels
and readability [24; 23; 43], which can be supported by         (i.e., node-, triad-, community- and network-level), which
forensic psychological theories such as Undeutsch hypothesis    can be further utilized to detect fake news within a super-
[35]. Such fundamental theories are a double-edged sword        vised machine learning framework.
for content-based fake news detection: features inspired can    Broadly speaking, fake news patterns involved in this study
help achieve explainable fake news detection, while some        relate to (1) the news being spread (Section 3.1 and Sec-
linguistic cues that they reveal might not be applicable for    tion 3.2), (2) spreaders of the news (Section 3.3), and (3)
news articles (e.g, non-immediacy) [44].                        relationships among the news spreaders (Section 3.4). Be-
In addition to non-latent features, fake news detection based   fore further elaboration, we first define Fake News Network
on latent representation of news content has been well devel-   (FNN) in Definition 1.
oped recently, where neural networks such as Convolutional
Neural Network (CNN) [37] have been utilized to automat-          Definition 1 (Fake News Network, FNN). Fake
ically select content features. Nevertheless, these features    News Network (FNN) is a subgraph GF = (VF , EF ) of the
are often difficult to be comprehended.                         social network G = (V, E), where VF ∈ V are the users that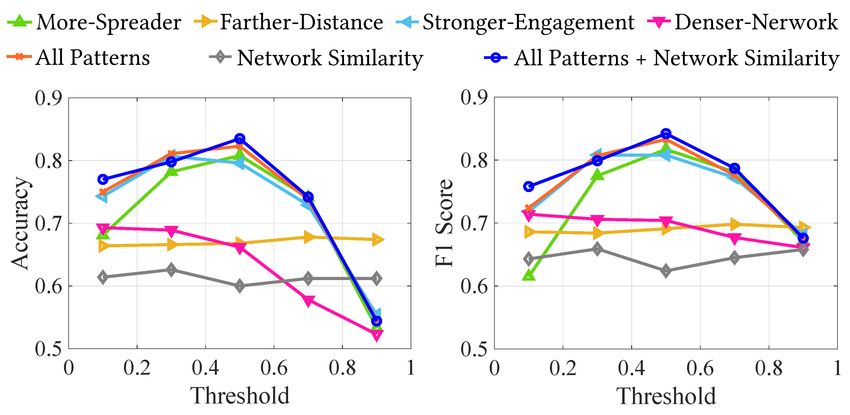
Table 1: Key Notations
          Notation            Description
              F; T            Fake news events; True news events
          G = (V, E)          Social (friendship) network
        GX = (VX , EX )       X = F: Fake news network; X = T : True news network
              ENS             Relationships from a normal user to a susceptible user
       E△>0 ; E△=0 ; E△ 0; S(vi ) − S(vj ) = 0; S(vi ) − S(vj ) < 0
         VX ; TrX ; MX        Nodes (Spreaders); Triads; Communities within GX
              B(∗)            B = 1 if ∗ is true; otherwise, B = 0
              C(v)            Influence (centrality) of user v
              S(v)            Susceptibility of user v
               θ              Threshold of user susceptibility, S(v) < θ (S(v) > θ) indicates a normal (susceptible) user
           T(v, X)            Spreading frequency of user v for news event X

have engaged with fake news F, and EF ∈ E represents the            II. Specific (Attributed) Spreaders. Principles like ho-
relationships among these users.                                    mophily [18] and social validation theory [4] suggest that in a
                                                                    social network, users with similar characteristics tend to be-
True News Network (TNN) is similarly defined, which is              come connected or form groups and exhibit similar behavior.
denoted as GT = (VT , ET ) for a true news event T . The            These observations imply that spreaders of fake (true) news
key notations in this section are presented in Table 1.             stories may also share some similar attributes; hence, allow-
                                                                    ing one to distinguish fake news from true news by studying
3.1 More-Spreader Pattern                                           specific users (i.e., with specific attributes) participated in
Evidence has been provided that fake news is in general             news dissemination. Here we consider (a) user susceptibil-
more “popular” than true news within the same population            ity [to fake news] and (b) user influence, both of which are
of users. For instance, during the critical months of the 2016      attributes that can be computed with information provided
U.S. presidential election campaign, top twenty frequently-         by FNNs and TNNs.
discussed fake election stories generated 8,711,000 shares,         a. User Susceptibility. We investigate user susceptibility to
reactions, and comments on Facebook, ironically, greater            fake news based on (i ) the number of involvements in the
than the total of 7,367,000 for the top twenty most-discussed       propagation of different fake news and (ii ) the frequency of
election stories posted by nineteen major news medium [34].         such involvements.
Fake news popularity can be attributed to two reasons. First,
as stated by information gap theory [16], rather than telling        i. Number of Involvements. Susceptibility in terms of in-
the truth, fake news creators make great efforts to produce             volvements is defined as the proportion of fake news
an information gap between the news content and individu-               among all news that user vi has participated in spread-
als’ knowledge. Such information gap produces the feeling of            ing, which is denoted as S(vi ):
deprivation labeled curiosity, which motivates individuals to                                  P
obtain the missing information to reduce such feeling. Sec-                                      j B(vi ∈ VFj )
ondly, to greatly influence online users, those who can bene-                S(vi ) = P                  P                , (1)
                                                                                        k B(vi ∈ VTk ) +   j B(vi ∈ VFj )
fit from fake news often create or recruit malicious accounts
(e.g., bots [30]) to spread or discuss the fake content. For            where B(vi ∈ VX ) = 1 if vi ∈ VX , otherwise B(vi ∈
example, millions of malicious accounts have participated in            VX ) = 0. S(vi ) = 1 (S(vi ) = 0) indicates that all news
2016 U.S. presidential election online discussions.3                    stories spread through vi are fake (true), i.e., vi is com-
News popularity can be characterized in terms of the number             pletely susceptible (immune) to fake news.
of users that spread such news, where Vosoughi et al. [36]           ii. Frequency of Involvements. Consider the special case
have empirically validated that:                                         where a user spreads a true news story once and a fake
                                                                         news story multiple times, this user may need to be con-
  Pattern 1 (More-Spreader Pattern). More users                          sidered more susceptible than a user who posts each
spread fake news than true news.                                         story once. Hence, as an alternative way, we define
                                                                         user susceptibility as the ratio between the spreading fre-
                                                                         quency of fake news stories and that of all news stories
To capture the number of news spreaders, we investigate the              a user has spread. Mathematically,
number and proportion of (I) general (i.e., non-attributed )                                P
spreaders and (II) specific (i.e., attributed ) spreaders in news                               j   B(vi ∈ VFj )T(vi , Fj )
                                                                     S(vi ) = P                              P                            ,
propagation.                                                                    k B(vi ∈ VTk )T(vi , Tk ) +     j B(vi ∈ VFj )T(vi , Fj )
                                                                                                                                      (2)
I. General (Non-Attributed) Spreaders. In general,
                                                                        where T(vi , X) is the number of times that vi has spread
the More-Spreaders Pattern can be quantified by the
                                                                        news story X.
number of users involved in spreading each fake or true news
story. This number is basically the number of nodes within
                                                                    Being assigned with a susceptibility score S(vi ), users can
each FNN and TNN, which we use as a feature.
                                                                    be further labeled as susceptible (S(vi ) > θ) or normal
3                                                                   (S(vi ) < θ) based on a fixed threshold value θ ∈ [0, 1]. Such
  https://comprop.oii.ox.ac.uk/research/public-
scholarship/resource-for-understanding-political-bots/              labeling allows us to represent More-Spreaders Pattern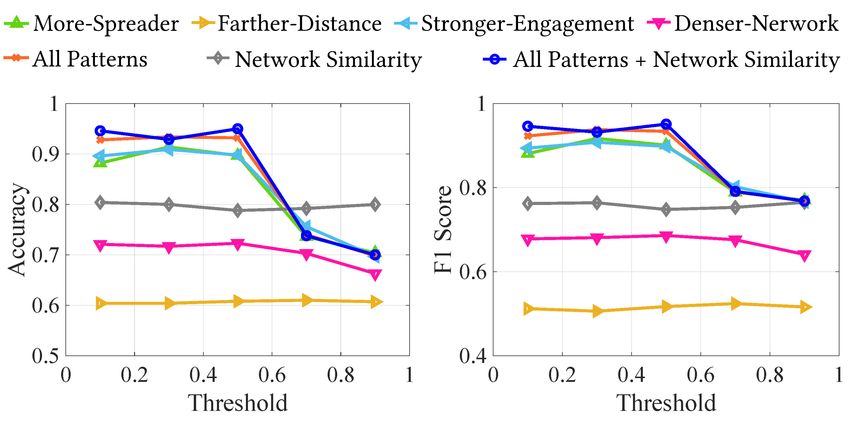
by recording the (i) number and (ii) proportion of suscepti-       from node i to node j is defined as
ble spreaders (nodes) in each FNN or TNN, as well as the                                                     Fij
(iii) number and (iv) proportion of normal spreaders within                           dEff (i, j) = 1 − log P       ,         (3)
each FNN and TNN. We include (i-iv) as features represent-                                                    l Flj

ing the pattern. Without such labeling one can represent           where dEff (i, j) satisfies dEff(i,j) ≥ 1.
spreaders involved in each FNN or TNN in terms of their
mean and median of susceptibility scores, which are also           Information flow has been defined differently in various net-
considered into our feature set.                                   works. For instance, it can be the passenger flux in global
b. User Influence. An approximation of a node (user) in-           mobility networks or the transport flow in transportation
fluence can be computed via a centrality score within the          networks [2]. In FNNs and TNNs it is the news flow among
network. One can consider the following well-established           nodes (users) in the network which can be defined as (i) the
criteria for computing centrality: (i) [in-, out-] degrees, (ii)   total number
                                                                          P       of news stories both users have spread, i.e.,
[in-, out-] closeness, (iii) betweenness, (iv) PageRank score,     Fij = X B(eij ∈ EX ), or (ii) the overall number of times
(v) hub and authority score, all of which use the connections      both users
                                                                         P have at least spread the same news stories, i.e.,
among nodes to identify their positions within the network.        Fij = X B(eij ∈ EX ) × min{T(ui , X), T(uj , X)}. The di-
We avoid grouping users into influential and non-influential       ameter of each FNN and TNN based on effective distance is
users as many parameters will be introduced (each central-         then equivalent to the minimum [sum of] effective distance
ity measure requires a threshold value), which in turn can         between the two most distant spreaders within the network.
affect the performance of fake news detection. Therefore,          We include diameters computed using geodesic and effec-
based on each centrality measure, we directly calculate the        tive distances as features representing Farther-Distance
mean and median user influence within each FNN and TNN,            Pattern.
and include both as features.
                                                                   3.3 Stronger-Engagement Pattern
                                                                   The statistics in [34] have revealed that fake news stories can
3.2 Farther-Distance Pattern                                       engage users more compared to true news stories. Note that
In addition to the number of users that spread news articles,      a user may decide to engage with a fake news story (e.g., post
news popularity can be also characterized by how far the           it) more than one time, such “more engagements” can be
news can spread, which leads to the corresponding pattern:         attributed to the number of users engaging with fake news,
                                                                   which has been summarized as More-Spreader Pattern
  Pattern 2 (Farther-Distance Pattern). Fake news                  investigated in Section 3.1, and/or to the number of times
spreads farther than true news.                                    each user engages with a fake news story, leading to the
                                                                   following pattern:
This pattern has been observed and validated by Vosoughi
et al. [36]; they found that the propagation trees of fake news       Pattern 3 (Stronger-Engagement Pattern).
are generally deeper than that of truth, i.e., an original post    Spreaders engage more strongly with fake news than with
referring to a fake news event is often more iteratively for-      true news.
warded than a true news event. On the other hand, given a
news story, how far it spreads can be approximated by com-         To quantify the “engagements” of users for each news story,
puting the shortest “distance” between the two most distant        one can concentrate on (I) group level engagements, i.e.,
spreaders (nodes) within the corresponding FNN or TNN              the engagements of all spreaders, and (II) individual level
(i.e., network diameter). To represent Farther-Distance            engagements, i.e., the engagements of a single spreader.
Pattern and calculate such “distance”, we investigate (I)
shortest (geodesic) distance which refers to the paths ex-         I. Group Engagements. On a group level, quantifying
isting between two nodes, and (II) effective distance which        spreader engagements for a certain news story can be equiv-
considers the information flow between two nodes [2].              alent to counting the total number of times that the news
                                                                   story has been spread. With specific user attributes (suscep-
I. Geodesic Distance. Based on geodesic distance, the              tible or normal), such engagements can be further quantified
diameter of each FNN and TNN is equivalent to the shortest         as the (i) number or (ii) proportion of times that the news
path length between the two most distant spreaders within          story has been spread by susceptible users, as well as (iii)
the network.                                                       number or (iv) proportion of times that the news story has
II. Effective Distance. Besides conventional shortest dis-         been spread by normal users.
tance, we introduce effective distance to help assess the net-     II. Individual Engagements. Individual engagements of
work diameter, which was initially proposed by Brockmann           a news story can be evaluated by the average spreading fre-
and Helbing [2]. The initial binary (unweighted) FNNs and          quencies of (susceptible, normal, all) users who have partic-
TNNs is hence transformed into weighted networks, where            ipated in the news propagation. In this case, the impact of
the weights are determined by the volume of information            the number of such news spreaders (i.e., More-Spreaders
flow among nodes. Given a network, the effective distance          Pattern) is divided and removed.
among nodes is defined as follows.
                                                                   All above ways of representing fake news patterns are on the
                                                                   level of nodes, e.g., individual engagement, and the whole
   Definition 2 (Effective Distance). Given a network              network, e.g., network diameter. Next we will specify how
G, we assume F denotes the flow matrix whose entities Fij          to represent Denser-Networks Pattern for fake news de-
represent the volume of information flow from node i to node       tection, which will be represented at different network levels:
j. Based on the flow matrix, the effective distance dEff (i, j)    ego, triad and community.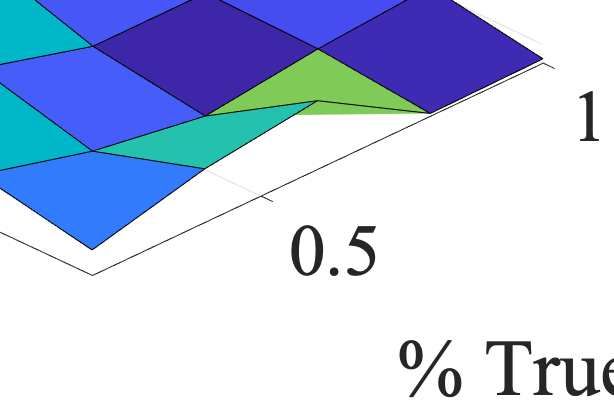
3.4 Denser-Network Pattern
Research in social psychology such as homophily [18] and
social validation theory [4] suggests that connected users in
social networks share similar attributes, interests and behav-
iors, e.g., sharing the same news article. On the other hand,
malicious users often form cohesive groups, taking collective
action that are more purposeful than normal users [20; 39].
These fundamental theories suggest the possibility to as-
sume that fake and true news articles can be distinguished
by the relationships among their corresponding spreaders,
which can be summarized as:

  Pattern 4 (Denser-Network Pattern). Fake news
spreaders form denser networks compared to truth spreaders.
                                                                 Figure 1: Specific Triads. N indicates normal users and S
To capture the “density” of connections among news spread-       indicates susceptible users. A → B denotes A follows B.
ers, we analyze news networks at different levels: (I) ego,
(II) triad and (III) community levels.                           ii. Specific Triads. Regarding each user as either a sus-
                                                                 ceptible or normal user, we can have twelve different triads
I. Ego Level. At the ego level, to compute density of net-       to be further explored (shown in Figure 1). We include as
works formed by users that have engaged with a certain news      features the number and proportion of every type of triads
story, we look at the numbers and proportions of connections     within each FNN and TNN.
that these users (spreaders) have (i ) generally formed with
other spreaders, and (ii ) specifically with other normal or     III. Community Level. In networks, a community struc-
susceptible spreaders.                                           ture refers to the occurrence of groups of nodes in a network
                                                                 that are more densely connected internally than with the
i. General Ego Relations. We include as a feature the to-        rest of the network. Therefore, the number and proportion
tal number of ego relationships among spreaders for each         of communities within each FNN and TNN can be used to
news story, i.e., the number of edges within each FNN and        represent Denser-Networks Pattern and, broadly speak-
TNN (|EX |). To eliminate the impact of the number of news       ing, should be negatively correlated to the network density.
spreaders (i.e., More-Spreaders Pattern), for each FNN           As features, we include the number of communities |MX |
or TNN GX we also record |EX |/|VX | and |EX |/ |V2X | ,

                                                                 within each FNN and TNN, and the proportion of commu-
which calculate the average number of ego relationships per      nities (assuming in the worst case each node is its own com-
spreader and network density, respectively. Here, |VX | is       munity) which removes the impact of the number of news
the number of spreaders (nodes) in GX and |V2X | is the

                                                                 spreaders, i.e., the value of |MX |/|VX |. Note that |MX | can
number of edges within a fully connected version of GX .         be obtained either from (i) global or (ii) local perspective.
ii. Specific Ego Relations. Labeling users as susceptible or     From a global perspective, communities that nodes (spread-
normal allows one to group all directed ego relationships into   ers) belong to within a FNN or TNN, as a subgraph of the
four subsets: (1) ENN containing relationships from a nor-       social network, are based on the structure of the overall so-
mal user to a normal user, (2) ENS containing relationships      cial network. From a local perspective, communities can
from a normal user to a susceptible one, (3) ESN contain-        be detected within a FNN or TNN. We include counts and
ing relationships from a susceptible user to a normal one,       proportion features for both types of communities.
(4) ESS containing relationships from a susceptible user to      Integrated Representation of Patterns. To represent
a susceptible one. We include the number and proportion of       each fake news pattern, we have used network information
each type of edges within a FNN or TNN as features being         such as network diameters, the number of news spreaders
used for fake news detection. In addition, each edge eij can     (size), and the number of relationships among the spreaders
be also classified into one of the following set: (1) E△>0 if    (density). Networks with various diameters, sizes and den-
△ = S(vi ) − S(vj ) > 0, (2) E△=0 if S(vi ) − S(vj ) = 0, (3)    sities exhibit various overall structures. Hence, the overall
E△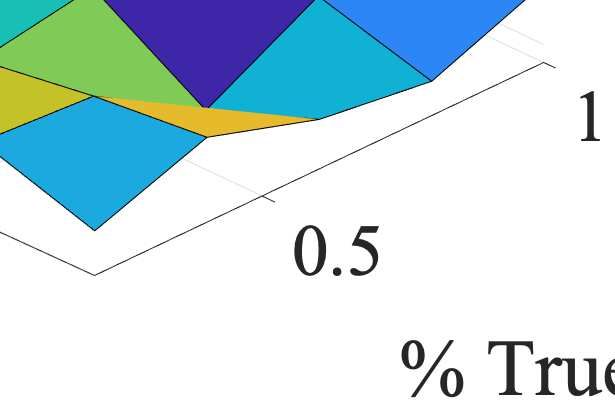
Table 2: Network-based Pattern-driven Feature Set for Fake News Detection
Pattern No. Feature(s) Formulation(s)
1 # News Spreaders |VX |
# Normal Spreaders, where user susceptibility, a.k.a., S(v), is based on Equa- P
| B(S(vj ) ≤ θ)|
tion (1) (#news) or Equation (2) (frequency) vj ∈VX
P
2-9 # Susceptible Spreaders, where S(v) is based on #news or frequency | vj ∈VX B(S(vj ) ≥ θ)|
P
| vj ∈VX B(S(vj )≤θ)|
% Normal Spreaders, where S(v) is based on #news or frequency |VX |
P
Spreaders
Pattern
| vj ∈VX B(S(vj )≥θ)|
% Susceptible Spreaders, where S(v) is based on #news or frequency
More-
P |VX |
v ∈V S(vj )
j X
Average Spreader Susceptibility, where S(v) is based on #news or frequency |VX |
10-13
P(S(vj ) ≤ MSS) = 0.5
Median Spreader Susceptibility, where S(v) is based on #news or frequency
for vj ∈ VX
P
Average Spreader Influence, where influence is based on (in-, out-) degree, (in-, vj ∈VX C(vj )
14-29 out-) closeness, betweenness, PageRank score, hub and authority score |VX |
Median Spreader Influence, where influence is based on (in-, out-) degree, (in-, P(C(vj ) ≤ MSI) = 0.5
out-) closeness, betweenness, PageRank score, hub and authority score for vj ∈ VX
Distance
Pattern
Farther-
30-32 Maximum, Average, and Median Geodesic Distance -
Maximum, Average, and Median Effective Distance, information flow is based
33-38 on #news and frequency See Definition 2
P
39 # User Engagements vj ∈VX T(vj , X)
P
# Normal User Engagements, where S(v) is based on #news or frequency vj ∈VX ;S(vj )≤θ T(vj , X)
P
# Susceptible User Engagements, where S(v) is based on #news or frequency vj ∈VX ;S(vj )≥θ T(vj , X)
P
T(vj ,X)
Engagement
40-47 % Normal User Engagements, where S(v) is based on #news or frequency
vj ∈VX ;S(vj )≤θ
P
Stronger-
Pattern
vj ∈VX T(vj ,X)
P
vj ∈VX ;S(vj )≥θ T(vj ,X)
% Susceptible User Engagements, where S(v) is based on #news or frequency P
vj ∈VX T(vj ,X)
P
vj ∈VX T(vj ,X)
48 Average User Engagements |VX |
P
vj ∈VX ;S(vj )≤θ T(vj ,X)
Avg. Normal User Engagements, where S(v) is based on #news or frequency P
| vj ∈VX B(S(vj )≤θ)|
P
49-52 vj ∈VX ;S(vj )≥θ
P
T(vj ,X)
Avg. Susceptible User Engagements, S(v) is based on #news or frequency | B(S(vj )≥θ)|
vj ∈VX
53 # Relationships among Spreaders |EX |
54 Average # Relationships of Spreaders |EX |/|VX |
|EX |/ |V2X |
55 Ego Density
|EN N ∩EX |
#/% N → N , where S(v) is based on #news and frequency |ENN ∩ EX |; |EX |
|EN S ∩EX |
#/% N → S, where S(v) is based on #news and frequency |ENS ∩ EX |; |EX |
56-71
|ESN ∩EX |
#/% S → N , where S(v) is based on #news and frequency |ESN ∩ EX |; |EX |
|ESS ∩EX |
#/% S → S, where S(v) is based on #news and frequency |ESS ∩ EX |; |EX |
|E△>0 ∩EX |
#/% S(vi ) > S(vj ), where S(v) is based on #news and frequency |E△>0 ∩ EX |; |EX |
Networks
|E△=0 ∩EX |
72-83
Pattern
#/% S(vi ) = S(vj ), where S(v) is based on #news and frequency |E△=0 ∩ EX |;
Denser-
|EX |
|E△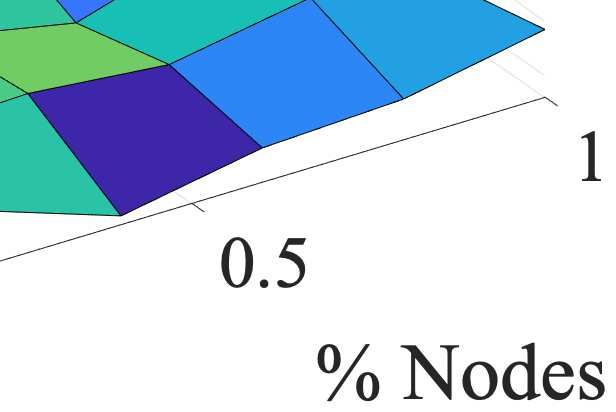
4.1.3 Baselines
                 Table 3: Data Statistics
                                                                  The performance of the proposed method is compared with
        Data              PolitiFact BuzzFeed
                                                                  several benchmark fake news detection methods on the same
        # Users               23,865         15,257
                                                                  datasets. These methods include (1) content-based (linguis-
        # News–Users          32,791         22,779
                                                                  tic) models, which rely on non-latent ([23; 43]) or latent
        # Users–Users        574,744        634,750               representation ([19; 14]) of news content, (2) network-based
        # News Stories           240            182               models ([3]), which investigate information revealed in news
        # True News              120             91
                                                                  propagation, and hybrid models ([33]), which utilize both
        # Fake News              120             91
                                                                  content and network information to detect fake news.
        # Triads           6,972,189      6,885,951
        # Communities            163             46               I. Pérez-Rosas et al. [23] propose a comprehensive lin-
                                                                  guistic model for fake news detection, involving the following
                                                                  features: (i) n-grams (i.e., uni-grams and bi-grams) and (ii)
                                                                  CFGs based on TF-IDF encoding; (iii) word and phrase pro-
4.   EXPERIMENTS                                                  portions referring to all categories provided by LIWC; and
Fake news patterns in networks have been specified as well        (iv) readability. Features are computed and used to predict
as how they can be represented as a set of quantifiable and       fake news within a supervised machine learning framework.
meaningful features. In this section, various experiments
are conducted to verify the effectiveness of the proposed ap-     II. Zhou et al. [43]. In our previous study, forensic psy-
proach in detecting fake news. We first present the experi-       chological theories are studied and used to detect fake news
mental setup in Section 4.1, followed by the evaluations of       in a supervised learning framework, which provide the evi-
experimental results in Section 4.2.                              dence of distinguishing fake news in content style from the
                                                                  truth. Such content style is captured by the frequency of
4.1 Experimental Setup                                            (i) lexicons relying on Bag-Of-Words (BOW) model, (ii)
                                                                  Part-Of-Speech (POS) tags and Context Free Grammers
We detail data used in experiments in Section 4.1.1, fol-
                                                                  (CFGs) at syntax-level, (iii) Rhetorical Relationships (RRs)
lowed by how data is prepared for experiments in Section
                                                                  at discourse-level, and by assessing a set of theory-driven (iv)
4.1.2, and the baselines which the proposed approach is
                                                                  DisInformation-related Attributes (DIAs) and (v) ClickBait-
compared with in Section 4.1.3.
                                                                  related Attributes (CBAs) at semantic-level.
4.1.1 Datasets                                                    III. Castillo et al. [3] design features that exploit infor-
Our experiments are conducted on two public benchmark             mation from user profiles, tweets and propagation trees to
datasets of fake news detection [33]. News articles in these      evaluate news credibility within a supervised learning frame-
datasets are collected from PolitiFact and BuzzFeed, respec-      work. Specifically, these features are based on (i) quantity,
tively. Ground truth labels (true or fake) of news articles       sentiment, hash-tag and URL information from user tweets,
in both datasets are provided by fact-checking experts. In        (ii) user profiles such as registration age, (iii) news topics
addition to (i) news content and labels, both datasets also       through mining tweets of users, and (iv) propagation trees
provide information on (ii) social network of Twitter which       (e.g., the number of propagation trees for each news topic).
contains Twitter users and their following relationships, i.e.,   IV. Shu et al. [33] detect fake news by exploring and em-
user-user relationships, and (iii) how the news has prop-         bedding the relationships among news articles, publishers
agated (tweeted/re-tweeted) by users, i.e., news-user rela-       and spreaders on social media. Such embedding involves
tionships. Based on the original datasets, we further iden-       (i) news content by using non-negative matrix factorization,
tify triads and communities in the social network. Com-           (ii) users on social media, (iii) news-user relationships (i.e.,
munities are detected using Louvain algorithm, a fast and         user engagements in spreading news articles), and (iv) news-
widely-accepted modularity-based community detection al-          publisher relationships (i.e., publisher engagements in pub-
gorithm [1]. Statistics of two datasets are shown in Table 3.     lishing news articles). Fake news detection is then conducted
                                                                  within a semi-supervised machine learning framework.
4.1.2 Data Preparation
                                                                  Additionally, fake news detection based on latent represen-
Following dataset collection, feature values are computed for     tation of news articles is also investigated in comparative
both datasets, which will be utilized in a supervised learn-      studies, where we consider as baselines supervised classi-
ing framework for fake news detection. However, an extra          fiers with features being (V) Word2Vec [19] and (VI)
step is necessary to take when computing user susceptibility      Doc2Vec [14] embedding of news articles.
scores. In Section 3, two ways are defined for determining
user susceptibility [to fake news] (see Equation (1) and (2),
respectively). Both ways rely on the historical information       4.2 Performance Evaluation
of users on how they previously engaged in fake news dissem-      Various supervised learners with 5-fold cross-validation were
ination, where the news labels (true or fake) are necessary in    used in our experiments. The performance is evaluated us-
the calculation. To avoid information leakage (i.e., features     ing accuracy and F1 score. In the following, we will first
having an unfair prior knowledge of labels), when dividing        present the general performance of the proposed approach
a dataset into the training and testing one, we dynamically       in Section 4.2.1. Based on that, the importance of patterns
calculate user susceptibility by using the historical infor-      (see Section 4.2.2) and features (see Section 4.2.3) in fake
mation provided in training dataset, rather than the whole        news detection is further assessed. The sensitivity of the
dataset. For users with no historical information in training     proposed approach is evaluated to the threshold and calcu-
dataset, we treat their susceptibility as the threshold value,    lation of user susceptibility in Section 4.2.4, as well as its
indicating that their susceptibility to fake news is unknown.     sensitivity to how much labeled news articles are available
Table 4: General Performance of Fake News Detection
                                                                Methods. The proposed network-based approach can per-
                                                                form relatively well compared to the content-based ([23; 43;
                                                                19; 14]) and network-based approaches ([3]) among base-
                                                                lines. Compared to the hybrid one ([33]), the proposed ap-
                                                                proach can be comparable with it and can outperform it
                                                                when introducing the linguistic features in the proposed ap-
                                                                proach (“Our Approach + [43]”).
                                                                                              PolitiFact     BuzzFeed
                                                                   Method
                                                                                              Acc. F1        Acc. F1
                                                                   Pérez-Rosas et al. [23]   .811 .811      .755 .757
                                                                   Zhou et al. [43]           .865 .865      .855 .856
                                                                   • BOWs                     .856 .858      .823 .823
                                                                   • POS Tags                 .755 .755      .745 .745
                                                                   • CFGs                     .877 .877      .778 .778
                                                                   • DIAs                     .729 .735      .667 .647
                                                                   • CBAs                     .604 .612      .638 .628
                                                                   • RRs                      .621 .621      .658 .658
                                                                   Word2Vec-based [19]        .688 .667      .703 .718
Figure 2: General Performance of Fake News Detection by            Doc2Vec-based [14]         .698 .698      .615 .615
Using Different Classifiers, where random forests perform          Castillo et al. [3]        .794 .822      .789 .794
best among all on both datasets.                                   Shu et al. [33]            .878 .880      .864 .870
                                                                   Our Approach               .929 .932      .835 .842
                                                                   Our Approach + [43]        .933 .939      .865 .884
and what proportion between two labels (true vs. fake) in
Section 4.2.5. The performance of our approach on fake
news early detection is finally examined in Section 4.2.6.      higher network view, which is a positive sign for our sum-
                                                                marized fake news patterns and defined representations of
4.2.1 General Performance Evaluation                            patterns in networks. Fourth, network similarity features
We experimented with various classifiers to detect fake news    can slightly improve the performance of the combination of
using our features, including Support Vector Machine (SVM),     four fake news propagation patterns, which finally achieves
k-Nearest Neighbors (k-NN), Naı̈ve Bayes (NB), Decision         an accuracy and F1 score of around 93% (84%) on PolitiFact
Trees (DT) and Random Forests (RF). The results obtained        (BuzzFeed).
are all provided in Figure 2. It can be observed from the
Figure 2 that RF performs best on both datasets, achieving      4.2.3 Feature Importance Analysis
an accuracy and F1 score of around 0.93 on PolitiFact and       Features are ranked by their importance in fake news de-
around 0.84 on BuzzFeed.                                        tection. Results are shown in Table 6, which are obtained
Such performance is further compared with that of baselines,    by Relief algorithm, a widely-accept feature selection algo-
where the results are presented in Table 4. Compared to the     rithm [13]. Consistent with the performance of patterns, fea-
content-based ([23; 43; 19; 14]) and network-based models       tures representing More-Spreader Pattern, Stronger-
([3]) among baselines, the proposed approach can perform        Engagement Pattern, and Denser-Network Pattern
relatively well on both datasets. Compared to the hybrid        are relatively more discriminative in predicting fake news
one ([33]), the proposed approach can be comparable with        compared to the other features. In addition, it can be ob-
it and can outperform it when introducing the linguistic        served from Table 6 and Figure 7 that for More-Spreader
features in the proposed approach (“Our Approach + [43]”).      Pattern, features contributing most to fake news detec-
                                                                tion are the mean or median of (i) spreader susceptibility
4.2.2 Performance of Fake News Patterns                         and (ii) spreader influence, where fake news spreaders often
We further analyze the performance of each fake news pat-       share a higher susceptibility and centrality score compared
tern and their combinations on fake news detection. The         to true news spreaders. For Stronger-Engagement Pat-
results are presented in Table 5, which supports the fol-       tern, such features relate to (iii) susceptible and normal
lowing observations. First, More-Spreader Pattern and           user engagements, where susceptible (normal) users engage
Stronger-Engagement Pattern perform best compared               more strongly in fake (true) news compared to true (fake)
to the others when being separately utilized to detect fake     news. For Denser-Network Pattern, such features are
news, achieving around 89% (81%) accuracy and F1 score us-      generally at (iv) ego and (v) community level. Specifically,
ing PolitiFact (BuzzFeed) data. The performance of Denser-      FNNs are characterized with a higher proportion of con-
Network Pattern follows. Second, when combining dif-            nections between susceptible users (S → S) while TNNs are
ferent patterns, their performance is in general better than    characterized with a higher proportion of other ego relations
when separately using them, which can achieve an accuracy       (S → N , N → S and N → N ). With a same network size, a
and F1 score of around 93% (82%) on PolitiFact (BuzzFeed).      4
                                                                  The results are based on Weisfeiler-Lehman graph ker-
Third, when using all patterns to detect fake news, a signif-   nel [31]. As a widely-accept graph kernel, Weisfeiler-Lehman
icantly better performance is achieved compared to using        graph kernel can measure the similarities among labeled
network similarity, which provides a mix of patterns from a     graphs, which we treat TNNs and FNNs as.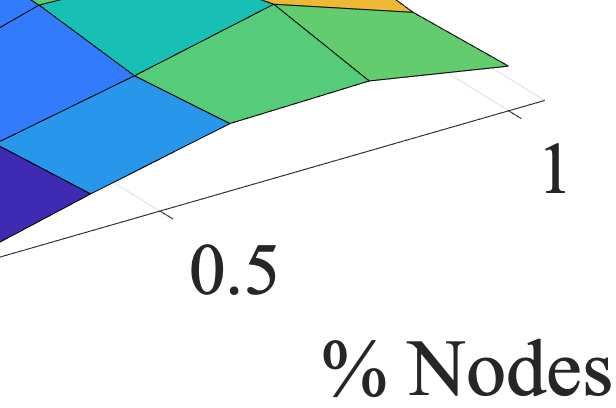
Table 5: Pattern Performance in Fake News Detection. More-Spreader Pattern and Stronger-Engagement Pattern
perform best compared to the others when being separately utilized to detect fake news. When combining different patterns,
their performance is in general better than when separately using them, and than when using network similarity, as a mix of
patterns from a higher view.
PolitiFact BuzzFeed
Pattern(s)
Accuracy F1 Score Accuracy F1 Score
More-Spreaders .891 .901 .808 .817
Farther-Distance .639 .587 .678 .698
Stronger-Engagement .898 .898 .807 .808
Denser-Networks .746 .718 .687 .704
More-Spreaders + Farther-Distance .846 .803 .824 .824
More-Spreaders + Stronger-Engagement .879 .864 .830 .847
More-Spreaders + Denser-Networks .919 .919 .770 .796
Farther-Distance + Stronger-Engagement .917 .923 .814 .824
Farther-Distance + Denser-Networks .742 .710 .786 .798
Stronger-Engagement + Denser-Networks .921 .926 .829 .840
All Patterns - Denser-Networks .908 .916 .814 .819
All Patterns - Stronger-Engagement .929 .928 .819 .815
All Patterns - Farther-Distance .913 .914 .780 .759
All Patterns - More-Spreaders .879 .871 .802 .803
All Patterns .929 .928 .828 .823
Network Similarity (Mix of Patterns)4 .808 .770 .671 .689
All Patterns + Network Similarity .929 .932 .835 .842
(a) PolitiFact
Figure 3: Impact of the Utilizing and Means to Calculate
User Susceptibility on Fake News Detection. Considering
user susceptibility can improve fake news prediction, while
two methods of computing user susceptibility perform sim-
ilarly.
FNN often has less communities compared to a TNN, which
indicate that a denser network structure is often within a (b) BuzzFeed
FNN compared to a TNN.
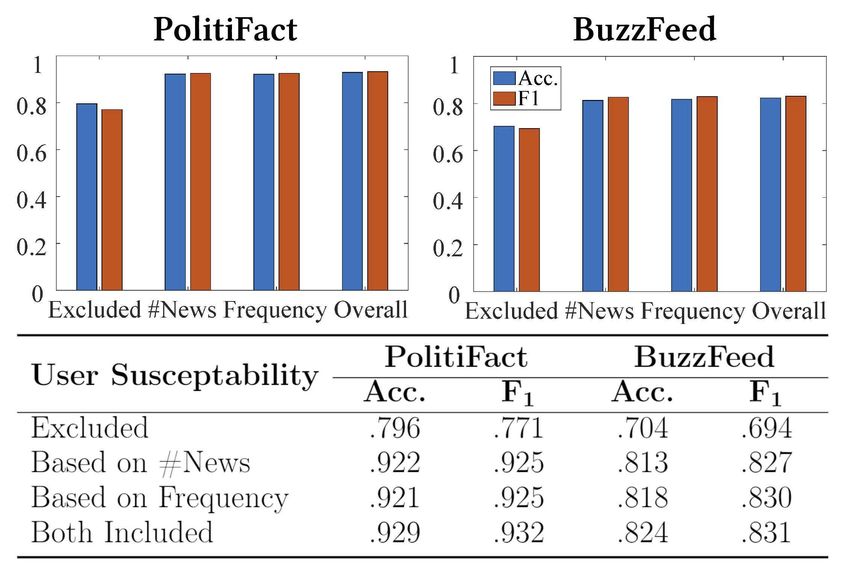
4.2.4 User Susceptibility Analysis Figure 4: Impact of User Susceptibility Threshold on Fake
News Detection. When the threshold changes, (i) the perfor-
Two methods have been defined to compute user suscepti-
mance of Farther-Distance Pattern and network simi-
bility [to fake news] which plays an important role in repre-
larity is hardly impacted due to no relevance to user sus-
senting patterns - one is based on the number of fake news
ceptibility; (ii) More-Spreader Pattern or Stronger-
that a user has spread (Equation (1)) and the other is based
Engagement Pattern can outperform Denser-Network
on the frequency of a user on spreading fake news (Equa-
Pattern though they are less stable; (iii) using all patterns
tion (2)). Once such susceptibility is computed, whether
(with/without network similarity) can always perform com-
a user is susceptible or normal relies on the selection of a
paratively well compared to the others and achieve the high-
threshold. Thus, here we assess the impact of user suscepti-
est performance when the threshold value is 0.5.
bility on fake news prediction by (I) how the susceptibility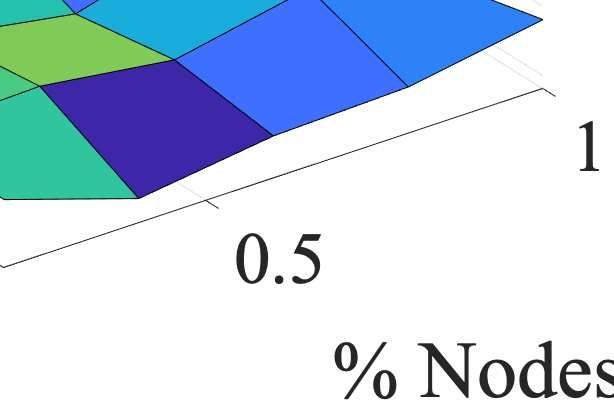
Table 6: Top 20 Important Features
            Rank     PolitiFact                                     BuzzFeed
              1      Avg. Spreader susceptibility (#News)           Median Spreader susceptibility (Frequncy)
             2       Avg. Spreader susceptibility (Frequncy)        Median Spreader susceptibility (Frequncy)
             3       Median Spreader susceptibility (Frequncy)      Avg. Spreader susceptibility (#News)
              4      Median Spreader susceptibility (Frequncy)      Avg. Spreader susceptibility (Frequncy)
              5      Avg. Normal User Engagement (Frequency)        Global Community Density
              6      % Normal User Engagement (Frequency)           Median Spreader Influence (Authority)
              7      % Susceptible User Engagement (Frequency)      % Normal User Engagement (#News)
             8       % Normal User Engagement (#News)               % Susceptible User Engagement (#News)
              9      % Susceptible User Engagement (#News)          Median Spreader Influence (In-degrees)
             10      % Normal Spreaders (Frequency)                 % Normal User Engagement (Frequency)
             11      % Susceptible Spreaders (Frequency)            % Susceptible User Engagement (Frequency)
             12      % Normal Spreaders (#News)                     % Normal Spreaders (#News)
             13      % Susceptible Spreaders (#News)                % Susceptible Spreaders (#News)
             14      Global Community Density                       Median Spreader Influence (In-closeness)
             15      % Egos (S → S, #News)                          % Egos (S → S, Frequency)
             16      % Egos (S → S, Frequency)                      % Normal Spreaders (Frequency)
             17      Avg. Normal User Engagement (#News)            % Susceptible Spreaders (Frequency)
             18      % Egos (S → N, Frequency)                      % Egos (S → S, #News)
             19      % Egos (N → S, #News)                          Median Spreader Influence (Hub)
             20      % Egos (N → S Frequency)                       % Triads (N → S, S → S, S → N, #News)
              Blue: More-Spreader Pattern; Green: Stronger-Engagement Pattern; Yellow: Denser-
              Network Pattern

is computed and (II) how the threshold is determined.            cles available on the performance of the proposed method.
                                                                 To that end, a certain proportion (∈ [0, 1]) of samples is
I. Computation of User Susceptibility. To evaluate the
                                                                 randomly selected from the population of true news stories
impact of the [non-] existence of user susceptibility and how
                                                                 in a dataset and that of fake news stories in that dataset, re-
it is computed, we conduct fake news detection (i) without
                                                                 spectively. The performance of the proposed approach with
user susceptibility features, and by using features that com-
                                                                 each proportion of true and fake news is plotted in Figure 5
pute user susceptibility based on the (ii) number of news
                                                                 (the upper row). Results in Figure 5 indicate that, in gen-
spread, (iii) frequency of the spreading, and (iv) both num-
                                                                 eral, the proposed approach can perform an accuracy rate
ber and frequency. The results are provided in Figure 3.
                                                                 of ∼0.7 to ∼0.85 and an F1 score of ∼0.65 to ∼0.9 in most
It can be observed that utilizing user susceptibility can en-
                                                                 cases on both datasets.
hance the performance by ∼10% when predicting fake news
                                                                 Note that two variables (i.e., the number and distribution
based on both PolitiFact and BuzzFeed datasets. However,
                                                                 of news articles) both exist and change in this process. For
no significant performance difference exists between the two
                                                                 a clear observation, we first control the sampled news dis-
ways that user susceptibility can be calculated.
                                                                 tribution to be the same as that in original datasets, and
II. Evaluating User Susceptibility Threshold. To eval-           record the performance of the proposed method with var-
uate the impact of susceptibility threshold on fake news pre-    ious number of overall news articles available for training
diction, we set the threshold value from 0 (i.e., all users      and predicting fake news. On the other hand, we keep the
are susceptible) to 1 (i.e., all users are normal) and use the   a fixed number of news articles while vary the proportion
proposed approach to predict fake news based on different        between fake and true news in it.
threshold values. The results are plotted in Figure 4. It can    Results are all provided in Figure 5 (the lower row). It can
be observed that when the threshold changes, (i) as the fea-     be observed that (i) the impact of the number of news ar-
tures representing Farther-Distance Pattern and net-             ticles is less significant compared to the news distribution
work similarity do not need to compute susceptibility scores     when predicting fake news based on the proposed method;
of users, the performance is rarely impacted; (ii) More-         (ii) when varying the number of news articles, an accuracy
Spreader Pattern or Stronger-Engagement Pattern                  rate (we only present the accuracy performance in Figure
can outperform Denser-Network Pattern while are less             5 as the datasets are balanced at this time) between ∼0.73
stable; (iii) the combination of all patterns (with/without      (∼0.8) to ∼0.9 (∼0.82) can be achieved by using PolitiFact
network similarity) can always perform comparatively well        (BuzzFeed) data and all patterns plus network similarity
compared to the others and achieves the highest perfor-          (Stronger-Engagement Pattern); and (iii) when vary-
mance when the threshold value is 0.5.                           ing the news distribution, a F1 score (we evaluate the per-
                                                                 formance only based on F1 score here as the datasets can be
4.2.5 Impact of News Number and Distribution                     unbalanced) ranging from ∼0.65 (∼0.75) to ∼0.93 (∼0.92)
As in the practice, the number and distribution (the propor-     can be achieved by using PolitiFact (BuzzFeed) data and
tion between fake and true news) of news articles on social      all patterns plus network similarity (More-Spreader Pat-
networks can be dynamic and change, here we evaluate the         tern).
impact of the (i) number and (ii) distribution of news arti-
(a) PolitiFact (b) BuzzFeed
Figure 5: Impact of News Number and Distribution on Fake News Prediction. In general, (i) the proposed approach can
achieve an accuracy rate (a F1 score) ∼0.7 (∼0.65) to ∼0.85 (∼0.9) in most cases on both datasets (see the upper four figures).
When only the number of news articles varies, an accuracy rate (here the datasets are class-balanced) between ∼0.73 (∼0.8)
to ∼0.9 (∼0.82) can be achieved on PolitiFact (BuzzFeed) data and overall features (Stronger-Engagement Pattern).
When the news distribution varies, a F1 score (here the dataset can be unbalanced) ranging from ∼0.65 (∼0.75) to ∼0.93
(∼0.92) can be achieved on PolitiFact (BuzzFeed) data and overall features (More-Spreader Pattern).
tive early detection of fake news helps take early actions on
fake news intervention. As few temporal information (e.g.,
the time that users spread the news articles or form relation-
ships) is available in the datasets, the experiment to verify
the early detection ability of the proposed approach is de-
signed based on the following intuition. In our study, each
FNN or TNN provides all network information for the cor-
responding [fake or true] news story. If the dissemination of
(a) PolitiFact
a news story is at its early stages, the number of spreaders
(i.e., nodes) and the involved relationships among spreaders
(i.e., edges) should be relatively small compared to when it
has been widely spread. Hence, we randomly select a certain
proportion (∈ [0, 1]) of nodes or edges for each FNN or TNN
and detect fake news on these [sub-] FNNs and [sub-] TNNs.
The results are presented in Figure 6. It can be observed
from Figure 6 that the proposed approach is generally sta-
ble with an accuracy and F1 score between ∼0.8 (∼0.7) and
(b) BuzzFeed ∼0.9 (∼0.82) by using PolitiFact (BuzzFeed) data, which is
friendly to fake news early detection.
Figure 6: Impact of Available Network Information on Fake
News Prediction. The proposed approach is generally stable
with an accuracy and F1 score between ∼0.8 (∼0.7) and
∼0.9 (∼0.82) on PolitiFact (BuzzFeed) data. 5. CONCLUSION
With the rampancy of fake news and the damage it has
inflicted on societies, there is a demand for a deep under-
standing of fake news and effective approaches to detect it.
4.2.6 Early Detection Analysis Integrating empirical studies and social psychological theo-
Fake news early detection is an arduous but important task. ries, our work can deepen the understanding of fake news by
It aims to detect fake news at an early stage before it has investigating its patterns in social networks. These patterns
widely spread on social networks, when only limited infor- are further exploited and represented at multiple network
mation is available. Early detection is crucial for fake news, levels (i.e., node-, ego-, triad-, community- and network-
especially due to validity effect, which indicates that the level) to detect fake news in an explainable way. Experi-
more individuals get exposed to certain fake news, the more ments on two real-world datasets validate the effectiveness
they may trust it. Meanwhile, it is difficult to correct one’s of the proposed approach, which can perform relatively well
cognition after fake news has gained their trust [26]. Effec- compared to the state-of-the-art. It should be pointed out1 1 [1] V. D. Blondel, J.-L. Guillaume, R. Lambiotte, and
Avg. Susceptibility
Avg. Susceptibility
E. Lefebvre. Fast unfolding of communities in large net-
works. Journal of Statistical Mechanics: Theory and
0.5 0.5 Experiment, 2008(10):P10008, 2008.
[2] D. Brockmann and D. Helbing. The hidden geometry
0 0 of complex, network-driven contagion phenomena. Sci-
True Fake True Fake ence, 342(6164):1337–1342, 2013.
60 10-4
1 [3] C. Castillo, M. Mendoza, and B. Poblete. Information
Median Authority
Avg. Out-degree
credibility on twitter. In Proceedings of the 20th Inter-
40 national Conference on World Wide Web, pages 675–
0.5 684. ACM, 2011.
20
[4] R. B. Cialdini. Influence: Science and Practice, vol-
ume 4. Pearson education Boston, MA, 2009.
0 0
True Fake True Fake [5] G. L. Ciampaglia, P. Shiralkar, L. M. Rocha,
J. Bollen, F. Menczer, and A. Flammini. Computa-
% Sus. User Engage.
1 1
% Sus. User Engage.
tional fact checking from knowledge networks. PloS
one, 10(6):e0128193, 2015.
0.5 0.5
[6] X. Dong, E. Gabrilovich, G. Heitz, W. Horn, N. Lao,
K. Murphy, T. Strohmann, S. Sun, and W. Zhang.
0 0 Knowledge vault: A web-scale approach to probabilis-
True Fake True Fake tic knowledge fusion. In Proceedings of the 20th ACM
SIGKDD International Conference on Knowledge Dis-
N)
covery and Data Mining, pages 601–610. ACM, 2014.
N)
0.2 0.4
[7] M. Gupta, P. Zhao, and J. Han. Evaluating event cred-
% Egos (S
% Egos (S
0.1 0.2 ibility on twitter. In Proceedings of the 2012 SIAM In-
ternational Conference on Data Mining, pages 153–164.
0 SIAM, 2012.
0
True Fake True Fake [8] S. Gupta, R. Thirukovalluru, M. Sinha, and S. Mannar-
1 1 swamy. CIMTDetect: A Community Infused Matrix-
Community Density
Community Density
Tensor Coupled Factorization Based Method for Fake
News Detection. arXiv preprint arXiv:1809.05252,
0.5 0.5 2018.
[9] K. Henderson, B. Gallagher, T. Eliassi-Rad, H. Tong,
0 0 S. Basu, L. Akoglu, D. Koutra, C. Faloutsos, and L. Li.
True Fake True Fake RolX: Structural Role Extraction and Mining in Large
(a) PolitiFact (b) BuzzFeed Graphs. In Proceedings of the 18th ACM SIGKDD In-
ternational Conference on Knowledge Discovery and
Figure 7: Statistics of Illustrated Important Features for Data Mining, pages 1231–1239. ACM, 2012.
Fake and True News [10] K. H. Jamieson and J. N. Cappella. Echo Chamber:
Rush Limbaugh and the Conservative Media Establish-
that compared to content-based models, the proposed ap- ment. Oxford University Press, 2008.
proach can hardly detect fake news before it has been prop-
[11] Z. Jin, J. Cao, Y. Zhang, and J. Luo. News Verifica-
agated on social media, while it can detect fake news with
tion by Exploiting Conflicting Social Viewpoints in Mi-
a stable performance by using limited amount of network
croblogs. In AAAI, pages 2972–2978, 2016.
(propagation) information and a very small number of train-
ing news articles. Additionally, by rarely relying on news [12] H. Karimi and J. Tang. Learning Hierarchical
content, it provides the other perspective to detect fake Discourse-level Structure for Fake News Detection.
news which is being robust to the possible manipulation arXiv preprint arXiv:1903.07389, 2019.
writing styles by malicious entities. Clearly, the proposed
approach can be enhanced by introducing more patterns and [13] K. Kira and L. A. Rendell. A practical approach to fea-
user attributes that are defined using network information ture selection. In Machine Learning Proceedings 1992,
such as network roles [9], and validated on cross-domain and pages 249–256. Elsevier, 1992.
language fake news data to assess its generalization power.
Both will be part of our future work. [14] Q. Le and T. Mikolov. Distributed Representations of
Sentences and Documents. In International Conference
on Machine Learning, pages 1188–1196, 2014.
6. REFERENCES[15] Y. Liu and Y.-f. B. Wu. Early Detection of Fake News [30] C. Shao, G. L. Ciampaglia, O. Varol, K.-C. Yang,
on Social Media Through Propagation Path Classifi- A. Flammini, and F. Menczer. The spread of low-
cation with Recurrent and Convolutional Networks. In credibility content by social bots. Nature Communica-
AAAI, 2018. tions, 9(1):4787, 2018.
[16] G. Loewenstein. The psychology of curiosity: A review [31] N. Shervashidze, P. Schweitzer, E. J. v. Leeuwen,
and reinterpretation. Psychological bulletin, 116(1):75, K. Mehlhorn, and K. M. Borgwardt. Weisfeiler-Lehman
1994. Graph Kernels. Journal of Machine Learning Research,
12(Sep):2539–2561, 2011.
[17] J. Ma, W. Gao, and K.-F. Wong. Rumor Detection
on Twitter with Tree-structured Recursive Neural Net- [32] B. Shi and T. Weninger. Discriminative predicate
works. In Proceedings of the 56th Annual Meeting of the path mining for fact checking in knowledge graphs.
Association for Computational Linguistics (Volume 1: Knowledge-Based Systems, 104:123–133, 2016.
Long Papers), volume 1, pages 1980–1989, 2018.
[33] K. Shu, S. Wang, and H. Liu. Beyond News Contents:
[18] M. McPherson, L. Smith-Lovin, and J. M. Cook. Birds The Role of Social Context for Fake News Detection.
of a feather: Homophily in social networks. Annual Re- In WSDM, 2019.
view of Sociology, 27(1):415–444, 2001.
[34] C. Silverman. This analysis shows how viral fake elec-
[19] T. Mikolov, K. Chen, G. Corrado, and J. Dean. Effi- tion news stories outperformed real news on Facebook.
cient estimation of word representations in vector space. BuzzFeed News, 16, 2016.
arXiv preprint arXiv:1301.3781, 2013.
[35] U. Undeutsch. Beurteilung der glaubhaftigkeit von aus-
[20] A. Mukherjee, A. Kumar, B. Liu, J. Wang, M. Hsu, sagen. Handbuch der psychologie, 11:26–181, 1967.
M. Castellanos, and R. Ghosh. Spotting Opinion Spam-
mers Using Behavioral Footprints. In Proceedings of [36] S. Vosoughi, D. Roy, and S. Aral. The spread of true
the 19th ACM SIGKDD International Conference on and false news online. Science, 359(6380):1146–1151,
Knowledge Discovery and Data Mining, pages 632–640. 2018.
ACM, 2013.
[37] Y. Wang, F. Ma, Z. Jin, Y. Yuan, G. Xun, K. Jha,
[21] M. Nickel, K. Murphy, V. Tresp, and E. Gabrilovich. L. Su, and J. Gao. EANN: Event Adversarial Neu-
A review of relational machine learning for knowledge ral Networks for Multi-Modal Fake News Detection. In
graphs. Proceedings of the IEEE, 104(1):11–33, 2016. Proceedings of the 24th ACM SIGKDD International
Conference on Knowledge Discovery & Data Mining,
[22] R. Oshikawa, J. Qian, and W. Y. Wang. A Survey on pages 849–857. ACM, 2018.
Natural Language Processing for Fake News Detection.
arXiv preprint arXiv:1811.00770, 2018. [38] K. Wu, S. Yang, and K. Q. Zhu. False rumors detection
on sina weibo by propagation structures. In Data En-
[23] V. Pérez-Rosas, B. Kleinberg, A. Lefevre, and R. Mihal- gineering (ICDE), 2015 IEEE 31st International Con-
cea. Automatic Detection of Fake News. arXiv preprint ference on, pages 651–662. IEEE, 2015.
arXiv:1708.07104, 2017.
[39] S. Xie, G. Wang, S. Lin, and P. S. Yu. Review spam
[24] M. Potthast, J. Kiesel, K. Reinartz, J. Bevendorff, and
detection via temporal pattern discovery. In Proceedings
B. Stein. A Stylometric Inquiry into Hyperpartisan and
of the 18th ACM SIGKDD International Conference on
Fake News. arXiv preprint arXiv:1702.05638, 2017.
Knowledge Discovery and Data Mining, pages 823–831.
[25] X. Ren, N. Peng, and W. Y. Wang. Scalable Construc- ACM, 2012.
tion and Reasoning of Massive Knowledge Bases. In
[40] Y. Yang, L. Zheng, J. Zhang, Q. Cui, Z. Li, and P. S.
Proceedings of the 2018 Conference of the North Amer-
Yu. TI-CNN: Convolutional Neural Networks for Fake
ican Chapter of the Association for Computational Lin-
News Detection. arXiv preprint arXiv:1806.00749,
guistics: Tutorial Abstracts, pages 10–16, 2018.
2018.
[26] A. Roets et al. ‘fake news’: Incorrect, but hard to cor-
rect. The role of cognitive ability on the impact of false [41] R. Zafarani, X. Zhou, K. Shu, and H. Liu. Fake News
information on social impressions. Intelligence, 65:107– Research: Theories, Detection Strategies, and Open
110, 2017. Problems. In Proceedings of the 25th ACM SIGKDD
International Conference on Knowledge Discovery &
[27] V. L. Rubin. On deception and deception detection: Data Mining. ACM, 2019.
Content analysis of computer-mediated stated beliefs.
Proceedings of the Association for Information Science [42] J. Zhang, L. Cui, Y. Fu, and F. B. Gouza. Fake News
and Technology, 47(1):1–10, 2010. Detection with Deep Diffusive Network Model. arXiv
preprint arXiv:1805.08751, 2018.
[28] V. L. Rubin and T. Lukoianova. Truth and deception at
the rhetorical structure level. Journal of the Association [43] X. Zhou, A. Jain, V. V. Phoha, and R. Zafarani. Fake
for Information Science and Technology, 66(5):905–917, News Early Detection: A Theory-driven Model. arXiv
2015. preprint arXiv:1904.11679, 2019.
[29] N. Ruchansky, S. Seo, and Y. Liu. CSI: A Hybrid Deep [44] X. Zhou and R. Zafarani. Fake News: A Survey of Re-
Model for Fake News Detection. In Proceedings of the search, Detection Methods, and Opportunities. arXiv
2017 ACM on Conference on Information and Knowl- preprint arXiv:1812.00315, 2018.
edge Management, pages 797–806. ACM, 2017.You can also read


