New Hanover County Partnership Advisory Group - Meeting 2 November 13, 2019 - New Hanover Regional Medical Center
←
→
Page content transcription
If your browser does not render page correctly, please read the page content below
New Hanover County Partnership Advisory Group
Meeting 2
November 13, 2019
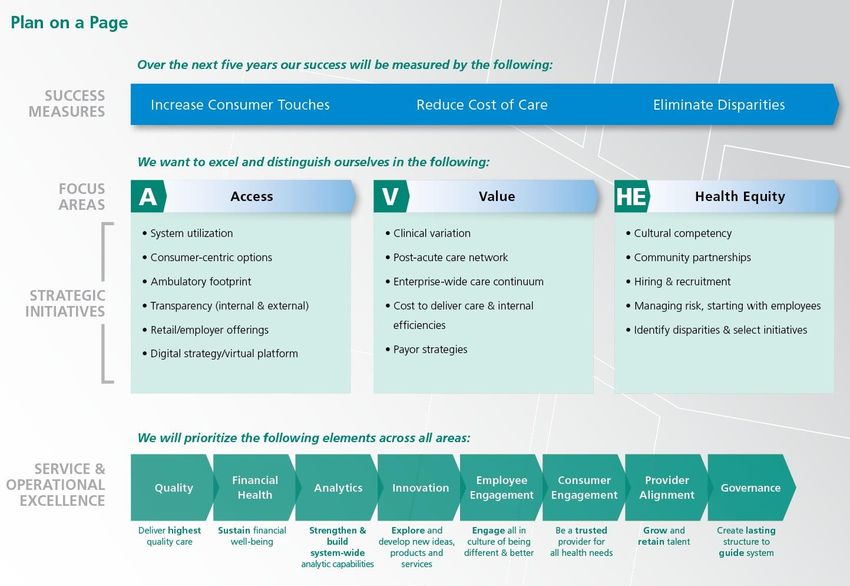
TABLE OF CONTENTS
Section                                                         Page Number
        1. Approval of Minutes                                            3
        2. Role of Advisors to the Partnership Advisory Group             4
        3. Review of Process                                              8
        4. Overview of Healthcare Landscape                              11
        5. NHRMC Strategic Direction                                     37
        6. Meeting Calendar                                              68
        7. Meeting 3 Preparation & Closing Remarks                       69
            Appendix                                                     76

2   2
APPROVAL OF MINUTES

3

ROLE OF ADVISORS TO THE
    PARTNERSHIP ADVISORY GROUP

4
THE ROLE OF ADVISORS TO THE PARTNERSHIP ADVISORY
    GROUP
            Typical advisory functions include strategic, legal and financial support based upon
              strategic opportunities being explored and the stage of the exploration process

                                              Partnership Advisory
                                                     Group

                Strategic Advisor                                                              Financial Advisor
    •        Provide insights on national
                                                        Legal Advisor                   •   Develop and/or review any
             healthcare & hospital business   •   Ensure legal and regulatory               financial considerations regarding
             trends, and regulatory changes       guidelines are followed during            chosen strategic option including
    •        Assist in communicating long-        strategic option exploration              but not limited to:
             term goals/objectives of NHRMC   •   Lay out needed legal approvals            • Capital needs
    •        Assess strategic opportunities       and timeline of legal process             • Financial position and
             across the spectrum from         •   Assess strategic option feasibility         sustainability
             remaining independent to             based upon NHRMC structure                • Financial projections
             partnership arrangements             and national/regional laws and            • Fair market value
    •        Determine next steps in              regulations
             successfully executing NHRMC     •   Develop and review any legal
             best-fit strategic opportunity       contracts related to strategic
                                                  opportunity exploration

5       5
POTENTIAL SCOPE OF SERVICES FOR FINANCIAL ADVISOR

    Prior to RFP Evaluation       RFP Evaluation         After Evaluation

                                 - Fairness opinion
        - Financial              - Comparative
        components of            analysis of financial   - Financial due
        current state and        components of           diligence during
        internal restructuring   narrowed list of        negotiations
        review                   respondents

6   6
TIMELINE FOR FINANCIAL ADVISOR RFP

                                                       PAG Make
                        County/NHRMC   County/NHRMC
        County/NHRMC                                    Selection
                           Receive       Narrow List
         Send FA RFP                                    Week of
                          Responses       Week of
        November 15th                                  December
                        December 2nd   December 13th
                                                          16th

7   7
REVIEW OF PROCESS

8
PARTNERSHIP ADVISORY GROUP PROCESS
    PHASE I PROPOSED CONTENT FOR MEETINGS

    Charter Task #1                   Education              Charter Task #1                 Education               Charter Task #2                 Partnership

            Process Overview and                                  Healthcare Industry                                 Initial Goals & Objectives
                Background                                            Education                                          and RFP Candidates
                                                                                                                 •   Education Recap
    •   Introduction to PAG                              •    Overview of healthcare landscape
                                                                                                                 •   Discuss goals and objectives
    •   Introduction to NHRMC and New                    •    NHRMC education                                        (G&O) for NHRMC’s future and
        Hanover County                                   •    PAG Process                                            legally mandated G&O (131e)
    •   Overview of process and PAG
                                                                                                                 • Review list of organizations
        charter
                                                                                                                     requesting RFP
Goal: PAG members understand                             Goal: PAG members understand                            • Discuss other potential partners
responsibilities, legal process, and                     current state of NHRMC and                              Goal: Develop preliminary G&O and
current state of NHRMC                                   implications of industry trends                         list of prospective partners

                          Charter Task #2           Partnership                Charter Task #3             Partnership                     Charter Task #4         Strategic Options

                      Final Goals & Objectives and                                 Final RFP and Identification                            Initial Results of Strategic
                        Initial RFP Development                                      of Participating Parties                                 Options Assessment
                      •     Review refined goals & objectives                  •    Review refined request for                         •    Discuss approach for Strategic
                            (G&O) based upon prior meeting                          proposal (RFP) based upon prior                         Options Assessment
                            and public hearing                                      meeting’s feedback                                 •    Review NHRMC current strategic
                      •     Discuss request for proposal                       •    Assess updated list of interested                       plan against NHRMC achieving
                            (RFP) outline                                           parties and other potential                             G&O (gap analysis)
                                                                                    strategic partners to receive RFP
                                                                                                                                       Goal: Identify gaps between current
                      Goal: Finalize G&O and develop RFP                       Goal: Finalize RFP and list of                          strategic plan and G&O and provide
                      and participation criteria                               prospective partners for outreach                       opportunity for PAG questions

9       9
PARTNERSHIP ADVISORY GROUP PROCESS
 PHASE I PROPOSED CONTENT FOR MEETINGS

    Charter Task #4            Strategic Options              Charter Task #5                  Partnership            Charter Task #5           Partnership

     Refined Strategic Options                                    Initial Review of RFP                            RFP Follow-Up Discussions
           Assessment                                                   Responses                                   and Selected Partner List
•  Address PAG questions on                               •  Review summarized RFP                                •     Address RFP follow-up questions
   Strategic Options Assessment                              responses and provide forum for                            identified in prior meeting
   results from prior meeting                                PAG questions on responses                           •     Review list of selected partners
• Identify solutions / investments to                     • Review RFP evaluation process                               resulting from RFP evaluation
   be prioritized in RFP responses                           in connection to Strategic Option                          process defined in prior meeting
   based upon results of gap analysis                        Assessment from prior meeting
Goal: Finalize Strategic Options                          Goal: Assess PAG questions on
Assessment and RFP evaluation                             RFP responses. Identify RFP follow-                     Goal: Align on selected partner list
priorities                                                up questions                                            based upon RFP response evaluation

                                                                                    Charter Task #7            Decision
                          Charter Task #6           Partnership
                                                                                                                                        Remain Independent
                           Finalized Partner List for                                        PAG Vote on
                                                                                                                                        Begin development of go
                              Strategic Options                                            Recommendation
                                                                                                                                        forward plan to support the
                                                                                •  Review standalone option
                      •    Further assess RFP responses of                                                                              option to remain independent
                                                                                   compared to finalist partner
                           selected partners identified in
                                                                                   options
                           prior meeting
                                                                                • Conduct vote to determine go
                      •    Narrow selected partner list to
                                                                                   forward decision of remaining
                           identify finalists for comparison to                                                                         Pursue Partnership
                                                                                   standalone or further assessing
                           stand alone options
                                                                                   identified partnership options with                  Negotiate a Letter of Intent and
                                                                                   LOI                                                  commence more detailed due
                      Goal: Finalize partner list being                          Goal: Finalize decision determining
                      considered for strategic options                           selected strategic option and outline                  diligence
                                                                                 key LOI expectations

1010
OVERVIEW OF HEALTHCARE
LANDSCAPE
11NAVIGANT IS A NATIONALLY RECOGNIZED HEALTHCARE
CONSULTING FIRM, AND HAS PARTNERED WITH NHRMC SINCE 2004
CONSULTING
WHO WE ARE:
600+
#3
ON MODERN
PROFESSIONALS HEALTHCARE’S
LARGEST HEALTHCARE
MANAGEMENT
A MULTIDISCIPLINARY TEAM CONSULTING FIRMS
CLINICIANS FORMER GOVERNMENT LEADERS
DATA ANALYSTS FORMER INDUSTRY EXECS
KLAS 2018
Seen as strategic,
experienced, and
WHAT WE DO: • STRATEGIC ADVISORY capable of producing
• TRANSACTION ADVISORY results on time.
• OPERATIONAL IMPROVEMENT
• GOVERNMENT HEALTHCARE SOLUTIONS
DELIVERED TO: PROVIDERS AND PAYERS
ACADEMIC
HOSPITALS MEDICAL GROUPS PAYERS
HEALTH SYSTEMS
PARTNERING WITH NHRMC
ON ITS STRATEGIC PLAN
SINCE 2004
12 / ©2019 NAVIGANT CONSULTING, INC. A GUIDEHOUSE COMPANY. ALL RIGHTS RESERVEDNAVIGANT IS NOW A GUIDEHOUSE COMPANY
HEALTHCARE EXPERTISE AND FEDERAL, STATE, AND LOCAL
SOLUTIONS GOVERNMENT EXPERIENCE
• STRATEGIC ADVISORY
• TRANSACTIONS
• REVENUE CYCLE
• PERFORMANCE IMPROVEMENT
13 / ©2019 NAVIGANT CONSULTING, INC. A GUIDEHOUSE COMPANY. ALL RIGHTS RESERVEDGOALS FOR THIS SESSION
1. Increase familiarity with
hospital terminology and Modern Healthcare, March 2018
critical drivers of economic
success “Earlier this month, Ascension’s* Board of
Directors unanimously endorsed its new
2. Identify key macroeconomic "advanced strategic direction," CEO Tersigni
pressures facing not only told his employees, as it faces
NHRMC but other hospitals dwindling reimbursement from government
across the country and commercial payers;
3. Understand the impact that growing regulatory complexity;
each macroeconomic skyrocketing pharmaceutical costs;
pressure has on NHRMC’s shifting from inpatient to outpatient care;
ability to provide from fee-for-service to value-based care;
exceptional care for its and increasing competition.”
patients now and in the
future
*Ascension Health is the largest not-for-profit health
system in the country, with over 2,600 sites of care
in 23 states, including 151 hospitals
Source: (1) Modern Healthcare.
14 / ©2019 NAVIGANT CONSULTING, INC. A GUIDEHOUSE COMPANY. ALL RIGHTS RESERVEDHEALTHCARE IS GROWING AND CHANGING, PRESENTING MULTIPLE
CHALLENGES TO HEALTHCARE PROVIDERS
1 HEALTHCARE PROVIDERS ARE RECEIVING FEWER PAYMENTS FOR SERVICES
• Federal and state governments are the largest payers of hospital care, and will continue to be as
the population ages
• Governmental payers reimburse hospitals less than private payers
2 HEALTHCARE PROVIDERS ARE UNDER INCREASING REGULATORY SCRUTINY
• Hospitals have been pushed into the regulatory spotlight, with a range of regulations
3 PAYERS DRIVING SHIFT FROM FEE-FOR-SERVICE TO VALUE-BASED CARE
• Private payers are changing how they purchase care, increasingly driving value-based
arrangements and shifting costs to employees
4 DELIVERY OF CARE SHIFTING FROM INPATIENT TO OUTPATIENT SETTING
• Patients are using healthcare services differently, demanding lower costs, greater accessibility to
care, higher quality
5 IN RESPONSE TO THESE CHALLENGES, PROVIDERS HAVE INCREASED COLLABORATION
• Consolidation with other hospitals provide economies of scale and skill; greater capital pool
• Employment of physicians and alignment with physician groups (ACOs, CINs)
• Vertical affiliation with payers (narrow networks and value-based payments)
• Experimenting with innovative partnerships and restructuring of operating model
15 / ©2019 NAVIGANT CONSULTING, INC. A GUIDEHOUSE COMPANY. ALL RIGHTS RESERVEDHEALTHCARE CONSUMES A GROWING PORTION OF THE
COUNTRY’S GDP
Healthcare expenditures comprise 18% of the country’s GDP and have increased every year – even
during recession years – averaging 6% growth each year since 1995
Healthcare Expenditures as a Percentage of U.S. GDP
1995-2016
20%
17.9%
18% 17.3%
16% 15.4%
13.9%
14% 13.3%
12%
10%
2008
2015
1995
1996
1997
1998
1999
2000
2001
2002
2003
2004
2005
2006
2007
2009
2010
2011
2012
2013
2014
2016
Source: American Hospital Association, Chartbook 2018
16 / ©2019 NAVIGANT CONSULTING, INC. A GUIDEHOUSE COMPANY. ALL RIGHTS RESERVEDTHE LARGEST CATEGORY OF HEALTHCARE EXPENDITURES ARE
HOSPITAL CARE AND PHYSICIAN SERVICES
Hospital Care and Physician Services comprise over half of national healthcare expenditures
National Healthcare Expenditures by Category
2016
Hospital Care
Hospital Care • Services provided in an inpatient setting by or under the
34% supervision of physicians, including medical, surgical, or
diagnostic treatment
Physician Services
Physician Services • Services provided by an individual licensed under state
21% law to practice medicine
Other
Other • Dental and non-physician professional services including
35% home health, nursing home care, some medical
equipment, etc.
Prescription Drugs
Prescription Drugs
10% • Pharmaceuticals requiring a medical prescription
2016
Source: (1) AHA Chartbook 2018.
17 / ©2019 NAVIGANT CONSULTING, INC. A GUIDEHOUSE COMPANY. ALL RIGHTS RESERVEDAS PROVIDERS OF CARE, HOSPITALS AND PHYSICIANS ARE ONE
PART OF THE HEALTHCARE INDUSTRY STRUCTURE
Providers
• Deliver medical care to patients
Patients • Hospitals submit claims to
insurers for the cost to provide
medical care to patients in
facilities
• Physicians submit a separate
claim to insurers for the cost of
their services
Patients
• Consumers purchase health
insurance from payer through an
Exchange or an employer
Pharma /
Biotech
Providers Payers
(e.g. Hospitals,
Physicians) • Private health insurers (e.g.
Aetna, BCBS, United) sell plans
to consumers/patients
• Governmental payers (Medicare,
Medicaid) cover enrolled
Payers beneficiaries
(e.g. insurance companies, • Insurers pay providers for care
delivery, based on claims
Medicare, Medicaid)
submitted by providers – Fee For
Service
Source: (1) Centers for Medicare and Medicaid Services (CMS)
18 / ©2019 NAVIGANT CONSULTING, INC. A GUIDEHOUSE COMPANY. ALL RIGHTS RESERVEDOVER TIME, GOVERNMENTAL PAYERS HAVE BECOME THE LARGEST
HOSPITAL PAYER WHILE REIMBURSING LESS THAN PRIVATE PAYERS
Governmental payers comprise over 60% of hospital costs, but do not pay rates necessary for
hospitals to break-even
Distribution of Hospital Cost by Payer Type Payment to Cost Ratios by Payer
1980-2016 2016
Hospital Break-even
10% 8%
14%
Private Payers 145%
33%
39%
42%
19% Medicaid 88%
13%
10%
38% 41%
35% Medicare 87%
1980 2000 2016 0% 50% 100% 150%
Medicare Medicaid Private Payers Other Payment to Cost Ratio (%)
Source: (1) AHA Chartbook 2018.
19 / ©2019 NAVIGANT CONSULTING, INC. A GUIDEHOUSE COMPANY. ALL RIGHTS RESERVEDHOSPITAL PAYMENTS FROM GOVERNMENTAL PAYERS HAVE
DWINDLED OVER THE PAST 20 YEARS
Declines in payments from governmental payers has put pressure on hospital contracts with private
payers to cross-subsidize costs
Hospital Payment-to-Cost Ratios by Payer Type
1995-2016
160%
149%
145%
140%
124%
120%
Hospital
104% Break-
99% even
100%
87%
94%
80%
60%
1998
2013
1995
1996
1997
1999
2000
2001
2002
2003
2004
2005
2006
2007
2008
2009
2010
2011
2012
2014
2015
2016
Medicare Medicaid Private Payers
Source: American Hospital Association, Chartbook 2018
20 / ©2019 NAVIGANT CONSULTING, INC. A GUIDEHOUSE COMPANY. ALL RIGHTS RESERVEDTHE INCREASING COST BURDEN ON GOVERNMENTAL PAYERS HAS
PUSHED HOSPITALS INTO THE REGULATORY SPOTLIGHT
Regulation Impact on Hospitals
Certificate of Need State regulations adopted in the 1970s designed to limit the number
(CON) and capacity of healthcare facilities (e.g. inpatient beds in hospitals)
and thus prevent excess capacity and cost inflation
Stark Law A set of federal laws which prohibit physicians from “self-referring” –
sending patients to facilities or services in which the physician or closely
related family has a financial interest
Federal Medicare Overhauled Medicare and introduced Medicare Advantage; adjusted
Modernization Act of Medicare’s hospital payment system; increased prescription drug
2003 access through Medicare Part D; introduced health savings accounts
Patient Protection Expanded patient health insurance coverage while proposing to reduce
and Affordable Care $43 billion in total funding to hospitals for uncompensated care
Act (PPACA) of 2010 between 2018 and 2025; directed Medicare to shift hospital payment
method toward value-based arrangements
Florida 2011 and 2012 In 2011, Florida reduced hospital payments by $750 million, cutting
Budgets hospital payments by 12% and eliminating price increases; in 2012
State reduced hospital payments by another 6%
Illinois SMART Act of Reduced Illinois Medicaid spending by $1.6 billion, including $240m in
2012 provider rate cuts
Source: (1) Becker’s Hospital Review; (2) US National Library of Medicine – National Institutes of Health; (3) Modern Healthcare; (4) Illinois General Assembly; (5) Florida State Budget.
21 / ©2019 NAVIGANT CONSULTING, INC. A GUIDEHOUSE COMPANY. ALL RIGHTS RESERVEDRECENT AND PENDING REGULATIONS ALSO WEIGH ON HOSPITAL
AND PHYSICIAN PAYMENTS
Regulation Implication
• CMS reduced reimbursement of certain 340B Program Drugs from the average sales
price (“ASP”) plus 6% to the ASP minus 22.5% for 2018 and 2019
• Ongoing litigation from parties such as the American Hospital Association are
340B Pharmacy challenging these rate reductions and pushing for remedial measures
• Hospitals eligible for the 340B program face significant declines in reimbursements
if legislation is repealed or weakened
• Doctors, hospitals, and other clinicians will need to structure and negotiate contracts
to treat Medicaid population approximately 18% of NC population
• Five managed-care groups to receive $6 billion in annual Medicaid contracts moving
North Carolina
1.6 million people to managed-care with approximately 565,000 Medicaid patients
Managed Medicaid transitioning on November 1
• Medicaid Reform has potential to have a negative financial impact on North Carolina
hospitals
• Estimated to decrease Medicare spending on physician services by approximately
$35 to $106 Billion (-2.3 to -7.1%) over 15 years
Medicare Access and • Merit Based Incentive Payment System (MIPS)- Most participants will be required to
CHIP Reauthorization direct resources and report up to 6 quality measures
Act (MACRA) • Advanced Alternative Payment Models (APMs)- Participants receive 5% bonus and
other rewards to drive adoptions of Advanced APMs with stricter governance criteria,
performance metrics, and risk sharing
Source: (1) North Carolina Health News; (2) North Carolina Government; (3) NHRMC Website; (4) Policymed.com.
22 / ©2019 NAVIGANT CONSULTING, INC. A GUIDEHOUSE COMPANY. ALL RIGHTS RESERVEDPAYERS ARE CHANGING HOW THEY PURCHASE CARE, SHIFTING TO
VALUE-BASED PAYMENTS THAT PRESS PROVIDERS TO ASSUME RISK
Pre-Admission
Hospital Payments by Type
Separate 2015-2018
payments for Services
each service
Inpatient
Services
Fee-For-
Doctor
Service
Services
Fee for Service
Post-Acute
Defined
Costs
payment
algorithms Readmissions 66% 64%
71%
77%
Pre-Admission
One payment to
Services
cover all services
for a patient Inpatient
Value Based
Payments
Services
Value-
Based Doctor 34% 36%
29%
Payment Services 23%
Hospital Post-Acute
Costs
assumes
risk Readmissions 2015 2016 2017 2018
*Fee for Service includes pay-for-performance
Source: (1) Health Care Payment Learning & Action Network (LAN) APM Measurement Effort Infographic 2016-2019.
23 / ©2019 NAVIGANT CONSULTING, INC. A GUIDEHOUSE COMPANY. ALL RIGHTS RESERVEDAS AN EXAMPLE, BCBS OF NC RECENTLY LAUNCHED BLUE
PREMIER EARLIER THIS YEAR
BCBS of NC is committed to having all customers covered under Blue Premier’s
value-based care contracts within 5 years
Blue Premier is a statewide Blue Cross and Blue Shield of North Carolina (BCBS of NC) program
announced January 11, 2019 that plans to tackle 3 critical areas:
Changing how they pay for care: participating systems will share in cost savings if they meet
patient health benchmarks and share in the losses if they fall short
Putting primary care first: collaborating with Aledade to support 100s of independent primary
care physician clinics and physician-led Accountable Care Organizations (ACOs). Through ACO
arrangements, physicians will have access to technology and data analytics tools as well as a
more comprehensive view of their patients’ total cost of care, gaps in care and their experiences
throughout the care continuum
Integrate mental and behavioral health: better integrate behavioral and mental health into
primary care for more holistic, patient-centered care
The following five health systems and their ACOs have joined BCBS of NC Blue Premier program:
Source: (1) CMS; (2) BCBS NC; (3) The News & Observer.
24 / ©2019 NAVIGANT CONSULTING, INC. A GUIDEHOUSE COMPANY. ALL RIGHTS RESERVEDIN ADDITION, PAYERS ARE SHIFTING A GREATER SHARE OF
HEALTHCARE COSTS TO EMPLOYEES THROUGH DIFFERENT PLANS
As employers continue shifting to high-deductible plans, employees increase their burden of costs
Average Annual Health Insurance Premiums -
Percentage of High-Deductible Health Plans
Employee Contributions
30% $6,015
$4,823
20%
$3,515
8%
2009 2014 2019 2009 2014 2019
Source: (1) Kaiser Family Foundation “2019 Employer Health Benefits Survey”
25 / ©2019 NAVIGANT CONSULTING, INC. A GUIDEHOUSE COMPANY. ALL RIGHTS RESERVEDHOSPITALS HAVE SHIFTED DELIVERY OF CARE AWAY FROM
INPATIENT SETTINGS BY STRENGTHENING AMBULATORY SETTINGS
As volumes shift away from the inpatient setting, health systems are expanding their reach to all
aspects of the “care continuum”, though this often requires new investments
Inpatient Admissions per 1,000 People
1995-2017
130
125
120
115
110
105
100
95
1995
1997
1999
2001
2003
2005
2007
2009
2011
2013
2015
2017
Total Outpatient Visits (millions)
1995-2016
800
700
600
500
400
300
200
100
0
1995
1997
1999
2001
2003
2005
2007
2009
2011
2013
2015
Source: (1) AHA Chartbook 2018; (2) Becker’s Hospital Review.
26 / ©2019 NAVIGANT CONSULTING, INC. A GUIDEHOUSE COMPANY. ALL RIGHTS RESERVEDTHIS CREATES A CHALLENGE FOR SYSTEMS AS OUTPATIENT
REVENUE PER UNIT IS MUCH LESS THAN INPATIENT
Financially, it takes nearly 50 new outpatient visits to replace one inpatient admission
Distribution of Hospital Revenues (IP/OP) Average Cost by Setting
1995-2016 2017
52%
Inpatient
Inpatient $22,543
48%
Outpatient
Outpatient $478
1995
1996
1997
1998
1999
2000
2001
2002
2003
2004
2005
2006
2007
2008
2009
2010
2011
2012
2013
2014
2015
2016
Source: (1) AHA Chartbook 2018; (2) The Institute for Health Metrics and Evaluation.
27 / ©2019 NAVIGANT CONSULTING, INC. A GUIDEHOUSE COMPANY. ALL RIGHTS RESERVEDHOW HAVE HEALTHCARE PROVIDERS ADAPTED?
• Healthcare providers have shifted patient care from traditional, higher-
cost hospital settings to lower-cost outpatient facilities where clinically
Managing appropriate
Settings of
• Healthcare have expanded footprint of facilities & services beyond
Care
hospital campus, providing patient-focused, seamless and high-quality
care
Embracing • Healthcare providers have increasingly formed accountable care
Changes to organizations (ACOs) and clinically integrated networks (CINs) with
Payment physician partners to participate in federal value-based contracts
Models • Healthcare providers have participated in value-based contracts with
private payers
• Many healthcare providers have sought to partner or merge with other
hospitals to gain economies of scale & skill, reduce expenses, and to
Consolidation
access capital for equipment/technology required to comply with recent
+ =
regulations
• Healthcare providers have strengthened affiliations with physician
partners, with a trend toward employing physicians (specialists as
Vertical well as PCPs)
Affiliation • Some healthcare providers have created provider-sponsored health
plans to better control hospital payments, others have increased
participation in “narrow networks”
• A few healthcare providers have experimented with new partnerships
Innovation and organizational arrangements beyond traditional hospital
services to provide better access, quality, and patient satisfaction
28 / ©2019 NAVIGANT CONSULTING, INC. A GUIDEHOUSE COMPANY. ALL RIGHTS RESERVEDHEALTHCARE PROVIDERS HAVE INCREASINGLY FORMED ACOS
WITH PHYSICIAN PARTNERS TO PARTICIPATE IN NEW PAYMENT
ARRANGEMENTS
Number of Accountable Care Organizations (ACOs)
2011-2017 What is an ACO?
1,000 ACOs are groups of doctors,
923
hospitals, and other health care
900 835 providers, who come together
800 voluntarily to coordinate high-quality
Number of ACOs
734
care for their patients. Hospitals
700 typically anchor an ACO.
613
600
The group seeks to coordinate care
500 440 to ensure that patients get the right
care at the right time, streamlining
400 services and preventing medical
300 errors.
200 168
ACOs collectively negotiate
58 contracts with payers to share in
100
cost savings, receiving a payment
0 when it succeeds both in delivering
2012
2011
2013
2014
2015
2016
2017
high-quality care and spending health
care dollars efficiently.
Source: (1) HealthAffairs “Recent Progress in the Value Journey” - reflects Q1 counts.
29 / ©2019 NAVIGANT CONSULTING, INC. A GUIDEHOUSE COMPANY. ALL RIGHTS RESERVEDHOSPITALS HAVE CONTINUED TO SEEK PARTNERSHIPS WITH
PEERS THROUGH HORIZONTAL CONSOLIDATION
Many hospitals have sought to partner or merge with other hospitals to gain economies of scale, to
gain economies of skill, to reduce expenses, and to access capital for equipment/technology
Percent of Community Hospitals in Hospital Systems
1999-2016
80%
% of Total Community Hospitals
Partnerships Continue to Expand
67%
70% Ascension • Today: 151 hospitals
• 2015: 141 hospitals
• 2010: 69 hospitals
60%
51% 3,200 Common • Today: 142 hospitals
hospitals Spirit • 2015: 144 hospitals
50% (CHI + Dignity • 2010: 115 hospitals
Health)
2,500
40% hospitals Premier Inc. • Today: over 4,000
(Group member hospitals
Purchasing • 2015: 3,400 members
30% Organization)
• 2010: 2,300 members
20%
2004
1999
2000
2001
2002
2003
2005
2006
2007
2008
2009
2010
2011
2012
2013
2014
2015
2016
Source: (1) AHA Trendwatch Chartbook 2018; (2) Ascension audited financial statements; (3) Organization Webpages; (4) Elsevier.com; (5) HealthAffairs.org.
30 / ©2019 NAVIGANT CONSULTING, INC. A GUIDEHOUSE COMPANY. ALL RIGHTS RESERVEDHOSPITALS ARE ALSO INTEGRATING WITH PHYSICIANS PARTNERS
THROUGH INCREASED EMPLOYMENT
Hospitals have been increasingly employing physicians and acquiring physician practices to manage
a greater scope of services for patients
Percent of Physicians Employed and Practices Owned by Hospitals
2013-2018
50%
43% 44%
45% 41%
40% 36%
35% 30%
% of Total
30% 27%
30% 30% 31%
25%
20% 24%
15%
17%
10% 15%
5%
0%
2013
2014
2015
2016
2017
2018
% Physicians Employed % Practices Owned
Source: (1) Physician Advocacy Institute Physician Practice Acquisition Study 2012-2018.
31 / ©2019 NAVIGANT CONSULTING, INC. A GUIDEHOUSE COMPANY. ALL RIGHTS RESERVEDINCREASED VERTICAL CONSOLIDATION / AFFILIATION IS ALSO
TAKING PLACE AS PAYERS AND PROVIDERS JOIN TOGETHER
Providers Payers
Health
Systems
Retail /
Urgent Care
Post Acute
Pharmacies
Physician Groups
M&A Other Affiliations / Relationships Same Entity
32 / ©2019 NAVIGANT CONSULTING, INC. A GUIDEHOUSE COMPANY. ALL RIGHTS RESERVEDHEALTH SYSTEMS ARE ALSO EXPERIMENTING WITH INNOVATION IN
DIFFERENT ARENAS
Patient Experience Care Effectiveness Social Determinants of Health
POC Survey Alluceo Fresh Food Farmacy
POC gathering tool collects consistent and standardized Care platform with connectivity to interdisciplinary mental Patients with HBA1C levels greater than 8 and identified
data on patient concerns and triggers remediation actions health team including family members as being food insecure are given a referral to access
in real time across Baylor Scott & White’s 49 hospitals healthy foods at the Farmacy
Extensivists
KP Health Connect Dedicated physician resource across inpatient episode and
post-hospitalization period to ensure a return to health CAPABLE
Patient portal with care delivery support, ancillary services
connection, health plan administration connectivity shown
to improve preventive screening rates and chronic care
Bravemind CAPABLE provides RN, Occupational Therapy, and
home improvement services to keep seniors safe at
Virtual reality (VR) based therapy for PTSD treatment home.
Our Care Wishes Sensely Partnership
Online platform to streamline the documentation of
Programmed triage protocols on Sensely
advance directives. Platform may eventually link to EHR
avatar to identify appropriate level of care
Labor & Supply Optimization Workflow Efficiency Access
Overseas Call Center Surgical Schedule Appointment Pass
Optimization Creates efficiency in the appointment check in process by
Overseas call centers in Israel and the Philippines staffed Block Scheduling Optimization (BSO) tool prevents high providing patients with a QR code that can be scanned at
with U.S. licensed nurses to address patient questions inpatient census days and optimizes use of operating rooms check in kiosks to verify demographics, pay copays, verify
and surgical robots insurance eligibility, and sign documents
Cost-Guiding Labels Home Telehealth
Command Center Home Telehealth program monitors 160 patients per
Reduced cardiac cath lab costs by implementing cost-
Operational command center that aggregates hospital month in their homes following a hospitalization to reduce
guiding labels for supplies, saving $990,000 annually
wide data in real time and leverages predictive readmits
analytics and AI to optimize throughput
eTrak VIP 360
Inova’s Concierge Medicine program provides patients
Leverages RFID tags to track mobile medical equipment with 24/7 access to care for a upfront membership fee
Source: (1) Organization Webpages; (2) Press Ganey; (3) PR Newswire; (4) Health Leaders Media.
33 / ©2019 NAVIGANT CONSULTING, INC. A GUIDEHOUSE COMPANY. ALL RIGHTS RESERVEDAS NEW ENTRANTS AND TECHNOLOGY DISRUPT EXISTING
HEALTHCARE INFRASTRUCTURE, NEW MODELS EMERGE
• Established healthcare companies
expanding into adjacent
businesses (e.g., Aetna/CVS,
Optum/DaVita/WellMed, etc.) • Increased Standardization
• Large organizations directly and Efficiency (e.g., systems
offering healthcare solutions,
New
have been successful with
(Apple, Amazon / JP Morgan Chase / Entrants standardization of back-office;
Berkshire Hathaway, Verizon, Microsoft, New and with investments in IT,
etc.) physicians, and managed care)
Opportunities
• Digital health startups entering the
fray backed by significant venture for Current
capital Models
• New Configurations (e.g.,
• Next generation analytics Emerging UnitedHealthcare is now the
capabilities (e.g., big-data, predictive Healthcare largest employer of physicians.
modeling, AI) applied across clinical, social, The MA value chain looks very
behavioral and financial domains Models
different than the traditional
• The promise of “anytime, anywhere Medicare one)
access” enabled by emerging New • New Models (e.g., OneMedical -
technologies (e.g., Blockchain, Cloud Technology tech-enabled concierge primary
computing, Connected Devices, IOT) care company)
driving increased portability
• Repeatable tasks being eliminated to drive
greater productivity (e.g., workflow
automation)
34 / ©2019 NAVIGANT CONSULTING, INC. A GUIDEHOUSE COMPANY. ALL RIGHTS RESERVEDTECHNOLOGY WILL CONTINUE TO CHANGE CARE DELIVERY BUT
REQUIRES FURTHER INVESTMENT AND RESEARCH
Telehealth Consumerism
• Over 70% of consumers prefer use of video • 65% of commercial insurance respondents
over visiting their primary care provider in-person considered cost a top factor when seeking care
• Accounted for approximately $22 billion in 2017 • Increasing amounts of patients using online
and it is expected to account for approximately resources to evaluate treatment options
$93.5 billion by 2026 including online reviews, ratings, and pricing
Artificial Intelligence (AI) Wearables
• Public and private sector investment in • Less than 25% (approximately 1,800) of all U.S.
healthcare AI expected to reach $6.6 billion hospitals using mobile applications
by 2021 • Wearable market projected to reach $12.1
• AI applications projected to drive annual billion by 2021 with remote monitoring
savings of $150 billion by 2026 growing to $31.3 billion by 2023
Source: (1) Definitive Healthcare
35 / ©2019 NAVIGANT CONSULTING, INC. A GUIDEHOUSE COMPANY. ALL RIGHTS RESERVEDHEALTHCARE IS GROWING AND CHANGING, PRESENTING MULTIPLE
CHALLENGES TO HEALTHCARE PROVIDERS
1 HEALTHCARE PROVIDERS ARE RECEIVING FEWER PAYMENTS FOR SERVICES
• Federal and state governments are the largest payers of hospital care, and will continue to be as
the population ages
• Governmental payers reimburse hospitals less than private payers
2 HEALTHCARE PROVIDERS ARE UNDER INCREASING REGULATORY SCRUTINY
• Hospitals have been pushed into the regulatory spotlight, with a range of regulations
3 PAYERS DRIVING SHIFT FROM FEE-FOR-SERVICE TO VALUE-BASED CARE
• Private payers are changing how they purchase care, increasingly driving value-based
arrangements and shifting costs to employees
4 DELIVERY OF CARE SHIFTING FROM INPATIENT TO OUTPATIENT SETTING
• Patients are using healthcare services differently, demanding lower costs, greater accessibility to
care, higher quality
5 IN RESPONSE TO THESE CHALLENGES, PROVIDERS HAVE INCREASED COLLABORATION
• Consolidation with other hospitals provide economies of scale and skill; greater capital pool
• Employment of physicians and alignment with physician groups (ACOs, CINs)
• Vertical affiliation with payers (narrow networks and value-based payments)
• Experimenting with innovative partnerships and restructuring of operating model
36 / ©2019 NAVIGANT CONSULTING, INC. A GUIDEHOUSE COMPANY. ALL RIGHTS RESERVEDNHRMC STRATEGIC DIRECTION 37
OUR AMBITION
 NHRMC MISSION, VISION, AND VALUES
Our Mission…
Leading Our Community to Outstanding Health

Vision for the Future…
NHRMC is an industry leader in a new era of healthcare delivery. Our thriving community
serves as a national model of achieving excellence for all.
We are committed to:
• Fostering a culture of transformation through empowerment, innovation, and inclusivity.
• Delivering exceptional quality, affordability, and personalized experiences throughout the
   wellness continuum.
• Advancing health and vitality for all through a community integrated model of collaboration.
• Cultivating a diverse and extraordinary workforce dedicated to our mission.

And Values…
Ownership, Teamwork, Communication, Compassion

Source: NHRMC Website and Data
3838
NHRMC STRATEGIC PLAN ON A PAGE
 MAJOR DEVELOPMENT EFFORTS: ACCESS, VALUE, HEALTH EQUITY

3939
SUMMARY OF CHALLENGES
 INDUSTRY AND LOCAL

➢ Need to shift business model to be ready for value-based reimbursements

➢ Timing of shift is uncertain

➢ Rapidly growing and aging population in SE NC with more intense health care
  needs

➢ Behavioral health (including opioid crisis) a prominent health need

➢ Care coordination, preventative and sick care, across urban and rural settings

➢ National shortage of nurses and physicians

➢ New competitors entering health care market, with substantial financial backing

4040
NHRMC MARKET FORCES
 GROWING & AGING POPULATION

         Historical Market Population Growth            Projected Market Growth Projections
                     (2010-2018)                                    (2017-2030)

                             Population   Over age 65
                             (% Change)   (% Change)
                                                           24%        INPATIENT
 New Hanover
                               14.6%        17.7%
 County

 Pender County                 19.1%        18.0%

 Brunswick
 County
                               27.3%        31.5%          48%        OUTPATIENT
 North Carolina                8.9%         16.3%

                                                                      EMERGENCY
                                                           54%        DEPARTMENT

Source: U.S. Census Bureau
4141
VOLUME DEMANDS
OCCUPANCY RATES AT 17TH STREET MAIN TOWER
Average Occupancy Rate By Unit
Ppt. Change
FY14 FY19 FY14-FY19
Adult Surgery (2) 85.1% 95.4% 10.3% Case Mix Index
Increased 10.3%
Nephrology (3) 88.8% 95.7% 6.9% 5 years
Neuro/Surgery (4) 85.6% 94.7% 9.1%
Medical (5) 92.1% 95.1% 3.0%
Hospitalists (6) 94.3% 91.3% (-3.0%)
PCU/Stoke (7) 89.5% 91.7% 2.3% Average Length
of Stay
Cardiac Med Tele (8) 84.8% 95.1% 10.3%
Increased 7.8%
Cardiac Med/Surg Tele (9) 74.5% 90.5% 16.0% 5 years
Pulmonology/Oncology (10) 88.6% 89.9% 1.3%
Average Occupancy
North Carolina Urban Hospitals 67%
4242ACCESS
AFFORDABLE CARE THAT IS EASILY ACCESSIBLE
Access
Patient will have reliable Access Goals:
• System utilization: patients receive the right service in the
access to information and right location at the right time
services in an environment • Consumer centric options: establish our system as
where the patient is the driver; consumer focused where people can learn, engage, and easily
transact their healthcare and/or wellness needs; whether it is in
the patient is empowered; the person, online or mobile
patient can receive the right • Ambulatory / facility footprint: to meet consumer
service in the right place at the expectation of quality health and wellness services that are
convenient, readily available, affordable, cost-effective, and
right time; there are multiple accessible
points of entry; the system is • Transparency: cost and quality data is available to our
internal consumers and external customers that is accessible,
price conscious, innovative, reliable, understandable, meaningful, concurrent, actionable,
transparent, proactive, and provided with context and benchmarks
collaborative, and understands • Retail / employer offerings: increase access to NHRMC
services through employer offerings and retail strategies using
the consumer mind-set innovative customer-focused developments
• Digital strategy / virtual platform: promote wellness,
improve internal efficiencies, and explore new lines of business
4343ACCESS
AMBULATORY STRATEGY
Imperative to place
Projected Population Growth By County
services to align with,
(2017-2030)
Population Duplin
growth Onslow
Bladen
Shift from
inpatient to
outpatient Pender
Columbus
Consumer Wilmington
preferences
Brunswick
4444ACCESS
FACILITY PRIORITIES
Position NHRMC main campus to be focused on
highest acuity care
NHRMC needs to move from - Centralize higher acuity care on main campus,
hub-and-spoke model centered consider moving lower acuity services to other
locations
on 17th Street campus to a - Accommodate growth in cardiovascular and
matrix model emphasizing care neurosciences
closer to home with all sites of - Ensure sufficient parking for patients
service interconnected through Offer care options that are convenient to access
- Grow services on Scotts Hill site and in other
digital strategies population-dense hubs throughout service area.
Facilities throughout are would range from advanced
ambulatory offerings to full-service community
hospitals.
- Fit to purpose Pender Memorial, Rehabilitation and
Behavioral Health hospitals
- Provide digital options
TODAY TOMORROW - Build emergency department to replace Orthopedic
Hub-and-Spoke Matrix Model Hospital ED
- Support growth of provider network in needed areas
including primary care
Ensure patients are cared for in highest quality, lowest
cost site of service for their clinical needs
4545ACCESS
FACILITY STRATEGY EVALUATION
Recent evaluation of facility plan asked
“What if we”:
• Accelerate growth of cardiovascular
and neurosciences centers at NHRMC
• Save millions of capital dollars
• Build orthopedic services in a more
accessible location, keeping outpatient
& inpatient together
Change in plan to:
• Make new patient tower Heart &
Vascular Hospital
• Expand neurosciences in existing Even with this likely pivot, $1B+ master
space facility plan required to meet region’s
• Make orthopedics anchor of new health needs over next 10-15 years
hospital in Scotts Hill
4646ACCESS
SYSTEM UTILIZATION
Manage current volume through operational Telehealth – NHRMC Home Care
improvements: • Manage patients with chronic conditions
• Care coordination (congestive heart failure, high blood pressure,
• Multidisciplinary rounds COPD or emphysema)
• Digital standardization • First year:
• Real-time location tracking system • 223 patients, 159 of whom had prior
hospitalizations
• Of those 159, only nine were readmitted for
congestive heart failure within 30 days, one-
third the rate for similar patients who were
readmitted in 2013
• Earned Critical Access Hospital Recognition by
The National Rural Health Resource Center for
Innovation
Desire to grow telehealth, but current
reimbursement environment creates
barriers for infrastructure investment
4747ACCESS
DIGITAL PLATFORM & CONSUMER-CENTRIC FOCUS
NHRMC App with interior, exterior wayfinding
Enhanced consumer functions:
• E-visits
• “Reserve my spot” for NHRMC ExpressCare
• E-Check in Future: Customer Relationship Management (CRM)
• Direct scheduling platform
Future: Price estimator for common
scheduled procedures
Growing the digital platform requires
investment to procure and install new
technology
4848VALUE
RELIABLE, HIGH QUALITY CARE DELIVERED COST EFFICIENTLY
Value
To deliver value throughout Value Goals:
• Clinical excellence: transform care delivery system by
the NHRMC system by eliminating unnecessary variation, establishing a system to
decreasing clinical variation, evaluate, implement, monitor and maintain evidence-based
standards of care to improve outcomes and reduce costs
increasing care coordination
• Post-acute care network: Create a post-acute care network
(both inpatient and allowing acute care admission to have seamless transfers of
ambulatory), using evidence- care between levels
based medicine, cost • Cost to deliver care & internal efficiencies: right care, right
time, right place; standardized pathways that allow for outlier
accounting, increasing variation; reliable, accurate data; etc.
covered lives, transparency • ACO / population health / PQP initiative: successfully drive
quality performance across the ambulatory network; Ensure
(both internally and patients receive appropriate assistance with care transitions;
externally), and provider Educate providers and ensure appropriate risk adjustment;
Evaluate and Implement value-based contracting programs
engagement
• payer strategies: seek opportunities to build capabilities to
take on more risk and move upstream on premium dollar
4949VALUE
CLINICAL EXCELLENCE
First Year Impact
• Reduced ED dental pain return visits from
8.45% to 3.48%
• Reduced length of stay for spine surgery
cases saving 190 days
• Reduced unnecessary blood transfusions by
864 units of blood, avoiding 9 complications
and saving $386,208
Outcome Examples Cost Examples • Increased use of CHF evidence-based order
Mortality
sets from 47% to 98%
Supply Costs
• Reduced cost of care for CHF patients saving
Readmissions Pharmaceuticals $692,333
Infections Over / Under Utilization • Improved appropriate use & cost efficiency for
spine braces saving $129,886
Functional Status LOS Reduction • Improved appropriate use of Acetaminophen
Morbidity saving $242,683 in 6 months
• In 3 months, Transitions Clinic has prevented
Patient Experience
15 readmissions
Advanced analytics requiring significant investment (personnel and
platforms) can accelerate quality improvement and cost reduction
5050VALUE
ACCOUNTABLE CARE
Physician Quality Partners serves as NHRMC’s ACO Physician Quality Partners –
ACO Program Performance
Medicare Shared Savings Program designed to move
system away from volume and toward value and 406 18,951 34
outcomes. Offers providers the opportunity to create an Providers Covered Lives Practices
Accountable Care Organization (ACO) for an assigned
Medicare population 95.12%
An ACO is measured across three key metrics: Quality Score (2018)
(highest available merit-based incentive,
two consecutive years)
Quality
Cost $282
Reduction in Cost of Care
Experience of Care per Beneficiary (2018)
(national average $180)
NHRMC’s ACO has successfully driven value, but $2.5 M
greater expertise, scale & investment are required Earned Shared Savings (2018)
to continue to develop population health
capabilities $5.3 M
Medicare Spending Savings (2018)
5151VALUE
PAYER STRATEGY
New Medicare Advantage Health Plan for New Hanover County
• Annual Enrollment Period started October 15
• Membership open to New Hanover County residents with coverage starting January 1, 2020
• FirstMedicare Direct in partnership with New Hanover Health Advantage is offering Medicare Advantage
and Prescription Drug Coverage plans
• These plans build on the strength of NHRMC’s network of providers and facilities to provide cost
effective care that improves the health of our community
To advance payer strategy, greater expertise in
advanced analytics and actuarial capabilities,
along with financial means and population health
capabilities to take on full risk is needed
5252HEALTH EQUITY
ATTAINMENT OF THE HIGHEST LEVEL OF HEALTH FOR ALL PEOPLE
Health Equity
We intend to improve the Health Equity Goals:
• Cultural competence: develop a team that has a deeper
overall health of the region by understanding of every segment of our community and how we
working with partners to can best care for them
eliminate the factors that lead • Hiring and recruitment: diverse, inclusive, transparent hiring
and recruitment practices to support our mission
to poor health, making • Managing risk, starting with employees: to have highly
healthcare more accessible engaged medical plan participants who have no barriers to
and equitable, and creating a receiving quality care in a timely manner at an affordable cost
for themselves and their family members
diverse and extraordinary • Community partnerships: a unified community effort to
workforce committed to advance health and wellness through collaborations with
health providers, non profits, local governments, educators,
meeting the unique needs of private businesses, faith communities, etc.
every individual • Target disparities that have wide-ranging impacts and
develop initiatives to eliminate them: create a healthcare
system where access to healthcare is equitable, health
disparities created by SDOH are eliminated, care integration is
evident across the community systems, NHRMC staff provides
culturally competent care and the staff represent a similar
composition of the community
5353HEALTH EQUITY CULTURAL COMPETENCE, HIRING & RECRUITMENT • Every Day Bias for Healthcare Professionals • Employee Resource Groups • Healthcare Explorers – inspiring future careers 5454
HEALTH EQUITY
IDENTIFYING DISPARITIES
• Screening for Social Determinants of Health
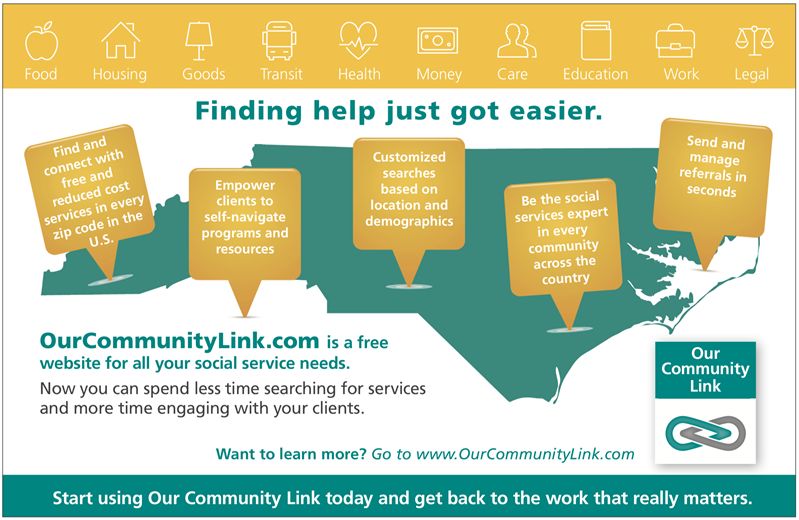
• Connecting to resources through Our Community Link / NC Care 360
Greater investment in infrastructure, community partnerships & capabilities is required
to address health disparities at a larger scale
5555HEALTH EQUITY
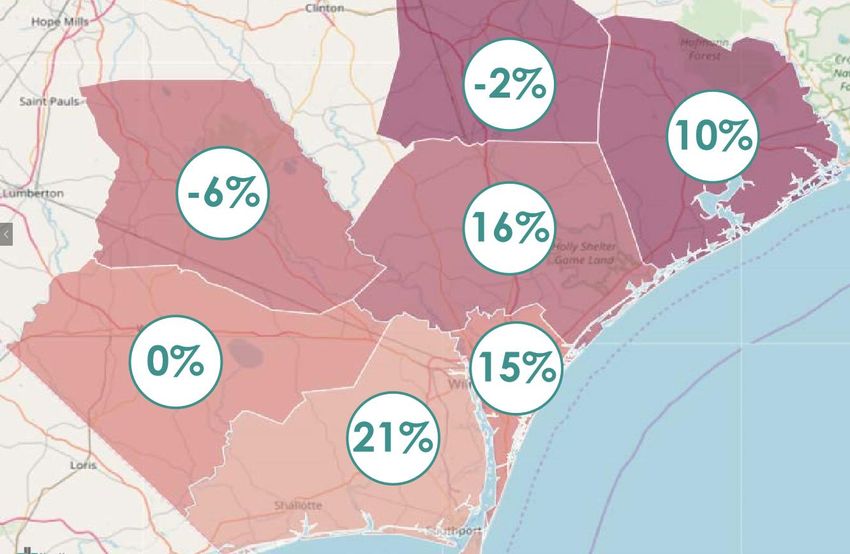
TARGETING DISPARITIES
NHRMC Malnutrition Pilot Malnutrition-specific 30-day Readmission Rates
30%
• Nationally, 30-day National Average
readmission rate for Malnutrition
Readmissions
malnourished patients is 25% Rate
23%
• NHRMC obtained grant to 20%
hire Clinical Outreach
Dietitian
15%
• Dietitian visits malnourished
patients in their homes to
10%
reinforce nutrition care plan
and connect to needed
resources 5%
0%
17% reduction in 30- Oct-18 Nov-18 Dec-18 Jan-19 Feb-19 Mar-19 Apr-19 May-19 Jun-19 Jul-19 Aug-19
day readmission rate Oct-18 Nov-18 Dec-18 Jan-19 Feb-19 Mar-19 Apr-19 May-19 Jun-19 Jul-19 19-Aug
over 8-month period All-Cause 11.6% 11.2% 11.2% 11.1% 11.5% 11.2% 12.3% 11.6% 10.6% 11.2% 10.8%
Malnutrition 23.3% 25.6% 21.4% 19.8% 17.5% 14.8% 16.7% 21.5% 16.5% 18.8% 16.5%
(Jan-Aug 2019)
All-Cause Malnutrition
5656HEALTH EQUITY
COMMUNITY PARTNERSHIPS
Healthy Food
Food Pharmacy
- Provides healthy food for food insecure patients to take
home when discharged from NHRMC inpatient units
- Funding from Eastern North Carolina Food Bank and
NHRMC Foundation donors
Food Boxes
- Provided by NourishNC to patients of NHRMC Zimmer
Cancer Center and Nunnelee Pediatric Clinics
NHRMC staff participation in NourishNC food drives and
MarKids events
Housing
9th Habitat for Humanity House
Support for WARM
New Hanover County Resiliency Task Force
Address “toxic stress”
Training on Community Resiliency Model
5757HEALTH EQUITY
MANAGE RISK, STARTING WITH EMPLOYEES
Health Benefits Employee Fitness Center Employee Health and Clinic
NHRMC employee Open 24/7 $10 co-pay
contributions for health $5 per pay period for Free flu vaccines and health
benefits have remained flat employees, or $10 per pay risk assessments
for 9 years period for a family Video visits
NHRMC Medical Plan single membership
coverage employee 6,597 members
contribution $401.70 / year 700-800 visits/week
Employee Nutrition Services Employee Pharmacy Healthy Lifestyles
Free consultation and Retail setting offering some 1303 employees enrolled,
guidance from a wellness over-the-counter wellness programs for
dietitian and can enjoy many medications, and NHRMC managing condition,
healthy cooking classes pharmacists will be on site to $0 co-pay for diabetes and
Discounted fresh & healthy educate and review hypertension-related visits,
meal options delivered to 12 medications select medications &
system locations supplies
5858OTHER STRATEGIC PRIORITIES
EMPLOYEE AND PROVIDER ENGAGEMENT
Employee Recruitment, Development and Retention
• Staffing models to address our increasing acuity of patients
• RN Recruitment Center to focus on RN and CNA recruitment
• Pay rates that ensure NHRMC is competitive (highest starting rate for RNs in North Carolina)
• Benefits plans well above the market average
• Leadership development programs for different levels of leadership to build teamwork and personal
development
• Culture transformation / breakthrough training Even after almost $30M investment,
Provider Engagement more dollars needed to keep pace with
staffing and development needs
• Provider leadership training / Dyad model
• Enhanced communication tools
• Resiliency programming
Provider shortages among nearly all
levels and specialties and recruitment
costs projected to increase
5959OTHER STRATEGIC PRIORITIES
INNOVATION
NHRMC is creating an internal culture of innovation with an agile, fail-fast mentality, as well as a strong
external collaborative network locally, nationally, and internationally, designed to:
a) Encourage, generate and manage ideas from within NHRMC through our Speed of
Health business modeling program
- Delivered in either a multi-team, or tailored single-team format to internal and partner organizations
- Supported by an online platform to collect, evaluate, and manage submitted ideas from employees as
well as run "grand challenge” programs. Each year the most promising ideas will be offered mentorship
and legally appropriate investment support for start-up or product development
b) Drive an external innovation pipeline introducing and piloting the best ideas originating outside
NHRMC simultaneously identifying and addressing structural NHRMC barriers to adoption
- Examples from last year or currently in progress include a digital human health coach, tele-pharmacy,
oncology clinical decision analytics; a diabetes management platform, and molecular nutrition software
c) Develop and execute imaginative new business opportunities adjacent to the current NHRMC
business model
- This year we have examined sensor-embedded home monitoring for the elderly, community data-
sharing models to targeting SDOH, and new AI-based commercial wellness applications
d) Create new external revenue opportunities by integrating LEAN and Innovation approaches
leveraging synergies and providing co-branding and operational efficiencies
Further scale and expertise needed to proliferate and achieve
success rate that yields return on investment
6060NHRMC FINANCIAL PROJECTIONS
IMPACTS OF POTENTIAL SIGNIFICANT EVENTS
Potential Significant Event FY18 Impact ($) FY19 $ Impact ($)
340B: Impact of loss of drug discounts and
downward pressure on reimbursement $41 million $50 million
amounts
SCH: Potential Sole Community Hospital
$46 million $37.5 million
(SCH) benefit and reimbursement decreases
Sales Tax: Legislative uncertainty around
$11.8 million $12.4 million
sales tax implementation and assessment caps
Total $98.8M $99.9M
Other potential impacts:
1. Managed Medicaid (projected $20M/year reduction once implemented)
2. Disproportionate Share Hospital payments anticipated total $11.1M
reduction over next 5 years
3. CON de-regulation (would mean loss of likely only non-safety net
services like surgical procedure, imaging and possibly beds)
4. Increasing shift of inpatient care to outpatient in next 5 years
6161NHRMC FINANCIAL PROJECTIONS
PROJECTED CAPITAL CASH FLOW NEEDS
S&P: A+
FY2019 FY2020 FY2021 FY2022 FY2023 FY2024 FY25-FY35
Rating
Operating Margin 3.80% 6.98% 6.40% 5.00% 4.00% 3.00% 3.00% -
Cash Generated - $144,745 $150,908 $139,519 $126,708 $115,974 $120,099 -
Cash Projected Spend on
- ($69,558) ($171,273) ($114,721) ($103,241) ($113,227) ($149,116) ($1,585,662)
Capital
Routine - ($44,445) ($83,809) ($60,938) ($61,581) ($57,677) ($57,581) ($686,930)
Current Special
- ($25,113) ($35,551) ($1,950) $0 $0 $0 ($2,819)
Projects
Future Strategic
- $0 ($51,913) ($51,832) ($41,660) ($55,550) ($91,535) ($895,912)
Projects
Beginning Cash Balance - $763,769 $838,955 $818,590 $843,389 $866,856 $869,604 -
Ending Cash Balance - $838,955 $818,590 $843,389 $866,856 $869,604 $840,587 -
-
Days Cash on Hand 324.6 242.7 237.4 231.0 222.3 209.3 191.5 -
Demand for capital, inability to continue funding
reserves, and expected increases in operating costs
create financial headwinds
6262NHRMC CRITICAL SUCCESS FACTORS
NHRMC is clinically, financially and operationally strong today. We have great people
who are working together to improve the health and well-being of our entire community.
To build on this momentum and succeed, we need additional resources for:
To cultivate a diverse and extraordinary workforce, we need to attract and retain
People employees and providers with a work environment that is rewarding personally and
professionally
To offer consumers a seamless and personalized care experience, we need to invest in
advanced technology systems that provide digital access to services, interconnectivity
Technology
between providers, and analytics that can identify and anticipate changes that will lead to
better care and health for every population we serve
To improve the health of the region, we need to offer a wide array of services that
Expanded
promote wellness and make care easy to access and more affordable while also building
Services
our capabilities to treat the most complex conditions.
To meet the challenges of today’s growing population while also investing in new models
Financial
of care, we need access to capital and the financial strength to withstand cuts to
Security
reimbursements and fluctuations in the market.
6363GUIDING PRINCIPLES 1. Improving access to care and wellness through more consumer-centric options 2. Advancing the value of the care we provide through higher quality and lower costs, effectively managing the health of our region to not only treat the sick but keep them well 3. Achieving health equity through community partnerships and activities that remove barriers to care, enabling our residents to achieve their own optimal health 4. Supporting our staff and the culture that has made NHRMC one of the top places to work in the country 5. Partnering with providers to make southeastern North Carolina an excellent place to practice medicine so we can continue to attract talented and compassionate providers to care for our growing population 6. Driving quality care throughout the continuum and helping facilitate transitions with other providers to deliver more seamless and coordinated care models 7. Growing the level and scope of care already in place for all, regardless of ability to pay 8. Investing to ensure the long-term financial security and future of our health system 6464
REMAINING INDEPENDENT
 SYSTEM CO – POTENTIAL RESTRUCTURING
Transition NHRMC into regional health (SystemCo)
• Create IRC 501(c)(3) SystemCo with County-Appointed Board
• SystemCo is new sole corporate member of NHRMC (currently no corporate member)
• Move PMH, other entities under SystemCo, to address lost revenue and other liability implications
• SystemCo may borrow, lend, capitalize more freely outside of New Hanover County
• SystemCo may focus more on strategic planning, other matters, without open meetings, books and
  records (researching scope)
                               Current Organizational Concerns
                                           Ability to                  Investments
                                                          Diplomatic
                                          Respond to                    Outside of
                                                           Hurdles
                                          Competition                     County
       Legal Structure
       Organizational

                         No legal
                                            Issues        Education,
                         structure                                       Limited
                                            remain         bylaws
                         change

                         Create System     Partial/full   Education,   Partial/full
                         Parent            resolution      bylaws      resolution

                               Potential restructuring does not address need for scale,
                                  development of capabilities, or access to capital
Source: First Tryon Advisors
6565
You can also read