New scale analyses reveal centenarian African coelacanths
←
→
Page content transcription
If your browser does not render page correctly, please read the page content below
Report

New scale analyses reveal centenarian African
coelacanths
Graphical abstract                                                     Authors
                                                                        lig Mahe
                                                                       Ke       , Bruno Ernande,
                                                                       Marc Herbin

                                                                       Correspondence
                                                                       kelig.mahe@ifremer.fr

                                                                       In brief
                                                                       Mahe   et al. develop a new method for
                                                                       aging coelacanths using 27 specimens’
                                                                       scales. They show the coelacanth may
                                                                       live a century and has among the lowest
                                                                       growth rates of marine fish for its size.
                                                                       With a ca. 5-year gestation and a ca. 55-
                                                                       year maturation, it has one of the slowest
                                                                       life histories of all fish and may be more
                                                                       threatened than thought.

Highlights
d   A new aging method using scales reveals coelacanths may
    live a centenarian life

d   We revise coelacanth’s life history based on 27 specimens
    sampled across 80 years

d   For its size, its growth is among the slowest of marine fish
    with deep-sea sharks

d   Its life history is among the slowest of marine fish with sharks
    and roughies

            Mahe et al., 2021, Current Biology 31, 1–8
            August 23, 2021 ª 2021 Elsevier Inc.
            https://doi.org/10.1016/j.cub.2021.05.054                                                  ll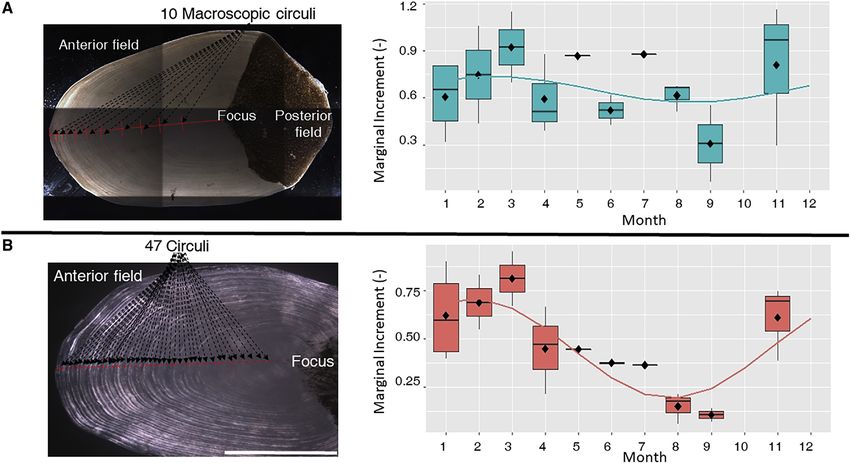
 et al., New scale analyses reveal centenarian African coelacanths, Current Biology (2021), https://doi.org/
 Please cite this article in press as: Mahe
 10.1016/j.cub.2021.05.054

                                                                                                                                           ll

Report
New scale analyses reveal
centenarian African coelacanths
 lig Mahe
Ke       ,1,5,* Bruno Ernande,2,3 and Marc Herbin4
1IFREMER,    Fisheries Laboratory, Boulogne sur mer, France
2MARBEC,     Univ. Montpellier, IFREMER, CNRS, IRD, Montpellier, France
3Evolution and Ecology Program, International Institute for Applied Systems Analysis (IIASA), Laxenburg, Austria
4Mecanismes Adaptatifs et Evolution (MECADEV, UMR7179), Muse      um National d’Histoire Naturelle de Paris, CNRS, Paris, France
5Lead contact

*Correspondence: kelig.mahe@ifremer.fr
https://doi.org/10.1016/j.cub.2021.05.054

SUMMARY

The extant coelacanth was discovered in 1938;1 its biology and ecology remain poorly known due to the low
number of specimens collected. Only two previous studies1,2 have attempted to determine its age and
growth. They suggested a maximum lifespan of 20 years, placing the coelacanth among the fastest growing
marine fish. These findings are at odds with the coelacanth’s other known biological features including low
oxygen-extraction capacity, slow metabolism, ovoviviparity, and low fecundity, typical of fish with slow life
histories and slow growth. In this study, we use polarized light microscopy to study growth on scales based
on a large sample of 27 specimens. Our results demonstrate for the first time nearly imperceptible annual
calcified structures (circuli) on the scales and show that maximal age of the coelacanth was underestimated
by a factor of 5. Our validation method suggests that circuli are indeed annual, thus supporting that the coela-
canth is among the longest-living fish species, its lifespan being probably around 100 years. Like deep-sea
sharks with a reduced metabolism, the coelacanth has among the slowest growth for its size. Further reap-
praisals of age at first sexual maturity (in the range 40 to 69 years old) and gestation duration (of around 5
years) show that the living coelacanth has one of the slowest life histories of all marine fish and possibly
the longest gestation. As long-lived species with slow life histories are extremely vulnerable to natural and
anthropogenic perturbations, our results suggest that coelacanths may be more threatened than previously
considered.

RESULTS AND DISCUSSION                                                       placed coelacanths among the fastest growing fishes, compara-
                                                                             ble to tunas.13 The inconsistency between a suggested fast body
A new aging methodology                                                      growth and other traits indicative of slow life history prompted us
Extant coelacanths were discovered in 1938 and are the only                  to revisit the age and body growth estimations of coelacanths. In
surviving members of an extinct lineage.3 The coelacanths are                this study, age and growth were estimated from scales collected
large lobe-finned fish (sarcopterygians). The African coelacanth             from 27 coelacanths captured off the coast of the Comoros
Latimeria chalumnae3,4 is considered critically endangered.                  Islands (13 females, 11 males, 1 juvenile, and 2 embryos) with to-
This species is characterized by a large body size that can reach            tal length ranging from 30.5 to 180 cm. These specimens were
up to 2 m in length and weigh up to 105 kg,5 with large length at            captured between 1953 and 1991 (Table S1). The scales of coe-
maturity (around 150 cm6,7). These animals are ovoviviparous,                lacanths present an anterior field with ridges radiating from the
produce a relatively small number of offspring, and have a large             apex and concentric macroscopic circuli1 (called macro-circuli
size at birth (around 35 cm). The coelacanth is thought to be a              hereafter) observable under transmitted light microscopy (Fig-
nocturnal languid drift-hunter, and its unique locomotory move-              ure 1). Both previous aging studies interpreted these macro-cir-
ments are generally slow,8 though it can exhibit fast-start escape           culi as marks of growth rate variation with alternating translucent
responses.9 These fish have a slow metabolism10,11 often                     and opaque bands suggesting fast and reduced growth, respec-
thought to be associated with its energy-saving mode of life,                tively; however, these studies did not agree on the periodicity of
typical of deep-water species. African coelacanths are found                 band formation. The earliest study suggested that macro-circuli
most commonly at water temperatures between 15 C and                        were seasonal with two being laid down each year in association
19 C, where their oxygen uptake capacity is optimal.10 These                with the alternation of two wet and two dry seasons annually in
life-history, physiological, and behavioral traits initially posi-           the tropics,1 whereas the most recent study interpreted macro-
tioned coelacanths at the slow end of the slow-fast life-history             circuli as annual, with only one being laid down each year,2
continuum.12 Growth estimates presented in two previous                      arguing that, as for the majority of fish,14 tropical fish exhibit a cir-
studies1,2 using the same dataset of 12 specimens, however,                  cannual rhythm despite climate seasonality.

                                                                                Current Biology 31, 1–8, August 23, 2021 ª 2021 Elsevier Inc. 1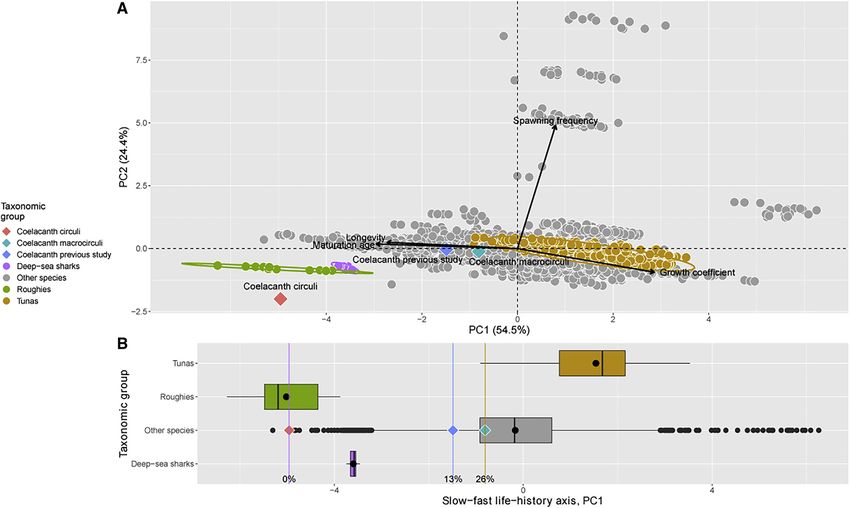
 et al., New scale analyses reveal centenarian African coelacanths, Current Biology (2021), https://doi.org/
  Please cite this article in press as: Mahe
  10.1016/j.cub.2021.05.054

            ll
                                                                                                                                                      Report

Figure 1. Analysis and periodicity of the circuli and macro-circuli of the African coelacanth scale
The same scale of L. chalumnae CCC4 (female of 109 cm caught in January 1954) is analyzed based on a reconstructed image under either transmitted light
microscopy (A) or polarized light microscopy (B) (horizontal white scale bar, 1 mm). Macro-circuli (A) and circuli (B) are marked (dots) along the longest growth axis
(red line). For each type of circuli, temporal dynamics of monthly marginal increments (mm) on scales of L. chalumnae (n = 27) based on the hypothesis of annual
circuli (red) or annual macro-circuli (blue) are shown. The bottom and top of each box are the first and the third quartiles of the marginal increment distribution for
the considered month (x axis), the horizontal segment and the diamond inside the box are, respectively, the median and the mean, and whiskers represent the
most extreme data point within 1.5 interquartile range. For three specimens (CCC162.21, CCC29.5, and CCC42.5), only macro-circuli could be identified and no
individual was collected in November and December so that no marginal increment was available for months 10 and 12. The thin continuous curve in each panel
represents the fit of a sinusoidal regression of marginal increments against month with a period of 12 months to test for annual periodicity. Under the hypothesis of
annual circuli, a significant intra-annual periodicity of marginal increment growth is detected by the sinusoidal regression (B). In contrast, under the assumption of
annual macro-circuli, no evidence of a periodic pattern is found (A). See also Figures S1 and S2.

   Following these earlier studies, we analyzed our extended                         appeared linearly related to the number of macro-circuli (p =
sample under transmitted light microscopy to count the                               0.009; R2 = 0.84) with a slope of 5.16, which indicates the
macro-circuli along the longest growth axis of each scale (Fig-                      appearance of a macro-circulus roughly every five circuli.
ure 1A). The age of the individuals was estimated to range be-
tween 0 and 8 years and between 1 and 17 years under the hy-                         Validation of coelacanth age
pothesis that macro-circuli are seasonal and annual,                                 Only direct validation methods, i.e., those using individual-level
respectively (Table S1). These age ranges and the total length                       temporal reference marks on scales relative to natural marks to
range of our sample are comparable to those of the previous ag-                      assess the periodicity of the latter, would allow indisputable
ing studies, thus suggesting an equally fast body growth incon-                      confirmation of the interpretation of circuli as annual growth
sistent with other life-history traits. We therefore decided to use                  marks. The main direct validation methods are (1) mark-recap-
another observation method, namely polarized-light micro-                            ture of wild individuals tagged externally and labeled with a
scopy. As expected, polarized light revealed much more detail                        chemical depositing a mark on their scales and (2) captive rear-
on scale topography than transmitted light15,16 (Figure 1B), the                     ing of either chemically labeled fish of unknown age or of fish of
quality of the image being equivalent to micro-computed tomog-                       known age (e.g., produced in controlled conditions). These
raphy (Figure S1). More specifically, we identified new circuli that                 methods are, however, not applicable to coelacanths due to
were thinner and more numerous than the macro-circuli                                conservation and ethical issues.
observed under transmitted light (Figure 1B versus Figure 1A).                         Instead, we used indirect validation methods. The most widely
These circuli were also formed by alternating thin translucent                       used method is marginal increment analysis (MIA), which as-
and opaque bands suggestive of growth rate variation. Counting                       sesses the periodicity of increments in calcified structures,
circuli in the same manner as macro-circuli and under the                            here macro-circuli and circuli. When growth has a circannual
assumption that they are annual, we obtained individual ages                         rhythm, increments are formed during the growth period of the
ranging from 5 to 84 years (Table S1). Comparing our results un-                     year. The size of the increment under formation, named the mar-
der transmitted and polarized light, the number of circuli                           ginal increment and measured as the distance between the last

2 Current Biology 31, 1–8, August 23, 2021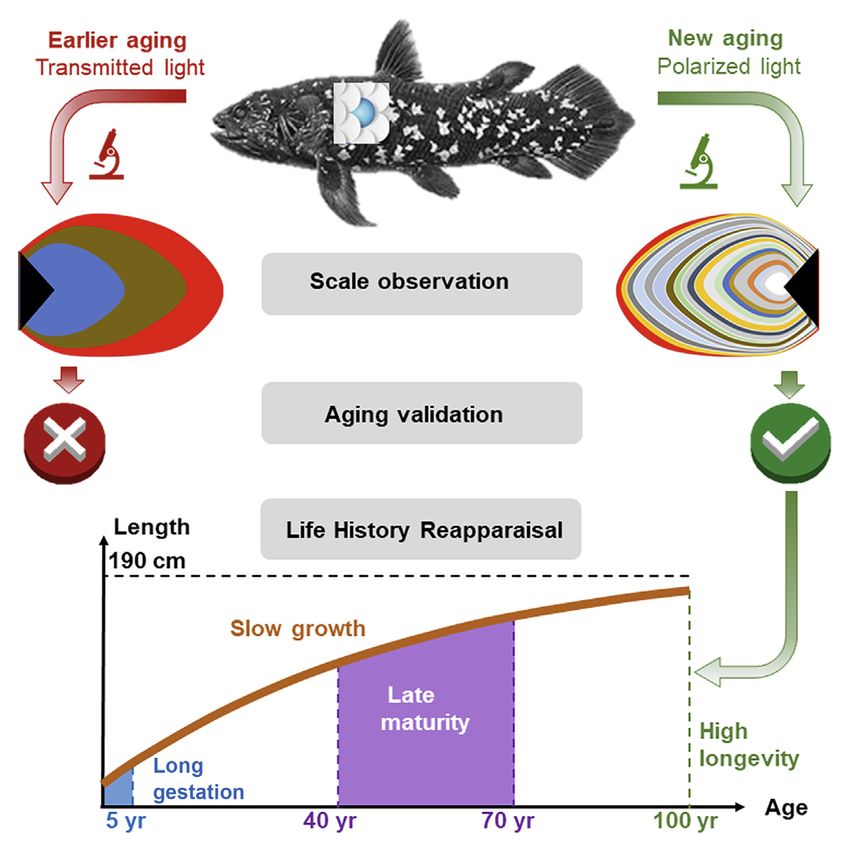
 et al., New scale analyses reveal centenarian African coelacanths, Current Biology (2021), https://doi.org/
  Please cite this article in press as: Mahe
  10.1016/j.cub.2021.05.054

                                                                                                                                                       ll
Report

Figure 2. Body growth pattern of the African coelacanth according to different scale interpretations
Observed length-at-age data for different scale interpretations for age are shown (red solid circles, circuli aging; blue open squares, macro-circuli aging; dark blue
crosses, previous age interpretation2) together with the corresponding fitted von Bertalanffy growth models (dashed light blue curve, macro-circuli; continuous
red curve, circuli; dashed dark blue curve, previous age interpretation). TLN and K are the asymptotic total length (cm) and the rate coefficient, i.e., the rate at
which the asymptotic length is reached (year1), respectively, estimated from the von Bertalanffy growth models and f0 = logðK Þ + 2 logðTLN Þis the growth
performance index (cm.year1) that allows overall growth performance comparison across populations or species. The gray area represents embryos in utero.
The black horizontal line indicates the size of the largest specimen ever captured. See also Tables S1 and S2.

fully formed (macro-) circulus and the edge of the scale, should                     sample appeared to be still in a fast growth phase and at about
thus exhibit some intra-annual periodic pattern when plotted                         only 61% of the estimated asymptotic length TLN . Moreover,
against the month at which the individual was captured. Applying                     TLN was estimated to be much larger than both the largest indi-
MIA to macro-circuli, no such intra-annual periodic pattern was                      vidual ever captured17 (TL = 190 cm) and the maximum length
evident (p = 0.61; Figure 1A), suggesting that they are not formed                   ðTLmax ± c:i: = 199 ± 24 cmÞ estimated independently from
annually. In contrast, the application of MIA to circuli allowed                     length-at-age data using extreme value theory.2 The same holds
detection of intra-annual variation in their growth (p < 0.001; Fig-                 when using length-at-age data obtained by the previous aging
ure 1B), revealing a circannual rhythm in circuli formation.                         study assuming annual macro-circuli (Figure 2, dashed dark
   A second indirect validation method is to assess the internal                     blue curve). In contrast, the body growth model fitted to
and/or external consistency of the population-level mean body                        length-at-age data obtained using circuli (Figure 2, red curve)
growth pattern, or length-at-age data, obtained for each scale.                      estimated a smaller asymptotic length          ðTLN = 203:8 cmÞ
Three growth models are widely used in ecology to describe                           reached at a slower rate K = 0:02 year1 such that the largest
length-at-age data for species with indeterminate growth                             ðTL = 180 cmÞ and oldest (85 years) individual in the dataset is
because they conform to the observed shape of growth curves:                         in a slow growth phase and much closer to its asymptotic length
the von Bertalanffy, Gompertz, and logistic growth models. For                       (88%). In addition, TLN is in much better agreement with the
both macro-circuli and circuli aging, the von Bertalanffy growth                     length of the largest individual ever captured and with the previ-
model appeared to best describe the resulting length-at-age                          ously independently estimated maximum length. The growth
data based on minimization of the small-sample bias-corrected                        pattern obtained using circuli aging appears thus to outperform
AIC (Table S2). The body growth curve estimated from length-                         other estimates.
at-age data obtained using macro-circuli for aging (Figure 2,                           We further used a double logarithmic plot of the von Berta-
dashed blue curve) was characterized by a combination of a                           lanffy rate coefficient K versus asymptotic length TLN (so-called
large asymptotic length ðTLN = 296:1 cmÞ reached at a fast                           auximetric plot), and the growth performance index f0 to
rate (K = 0:05 year1 ; note that coefficient K in the von Berta-                    compare the global body growth of coelacanths with other ma-
lanffy model represents the rate at which asymptotic length is                       rine fish species (1,383 populations distributed across 1,313
reached and not size change per unit of time). Consequently,                         species extracted from FishBase18) for each aging method. Ag-
the largest ðTL = 180 cmÞ and oldest (17 years) specimen of our                      ing based on macro-circuli would position the coelacanth among

                                                                                                                Current Biology 31, 1–8, August 23, 2021 3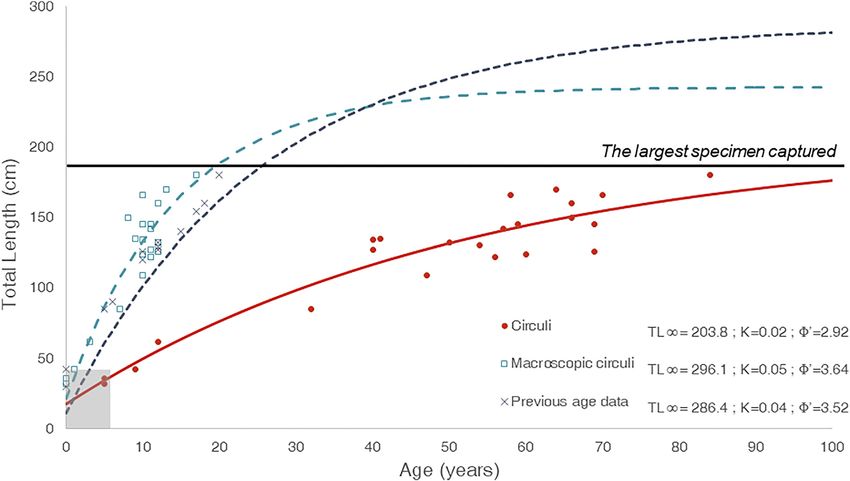
et al., New scale analyses reveal centenarian African coelacanths, Current Biology (2021), https://doi.org/
Please cite this article in press as: Mahe
10.1016/j.cub.2021.05.054
ll
Report
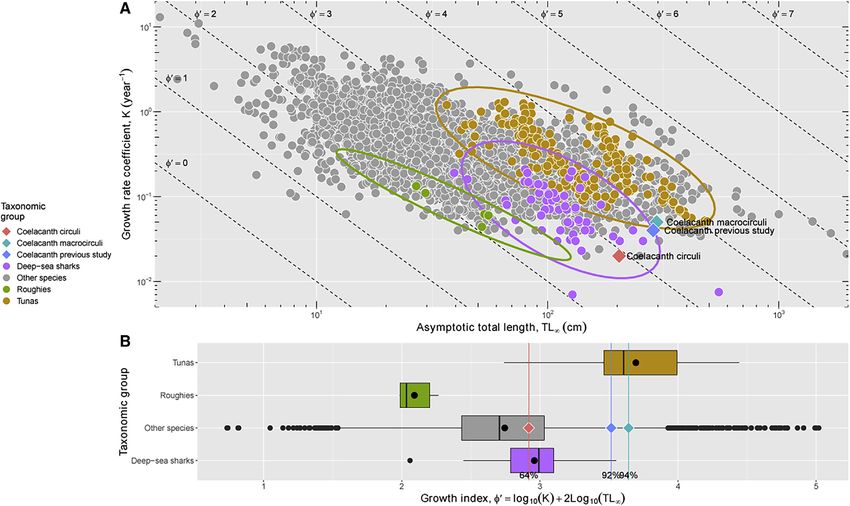
Figure 3. Comparison of the African coelacanth growth rate characteristics to other marine fish under the various aging hypotheses
(A) Auximetric plot of the coelacanth under the various aging hypotheses (red diamond, annual circuli; light blue diamond, annual macro-circuli from present
study; dark blue diamond, annual macro-circuli from previous study) relative to other taxonomic groups of marine fish species (solid circles; brown, tunas; purple,
deep-sea sharks; green, roughies; gray, other fish species). The auximetric plane is the plane defined by two logarithmic axes representing the von Bertalanffy
rate coefficient K versus asymptotic total length TLN where a population characterized by a set of von Bertalanffy growth parameters ðTLN ; KÞ is represented by a
point. Populations of a given species or species having similar growth characteristics will tend to form clusters of points that delimit the growth space of that
species or group of species. 95% ellipses, i.e., contours enclosing 95% of the data points under the assumption of a bivariate-normal distribution, are drawn to
illustrate the growth space of tunas (brown ellipse), deep-sea sharks (purple ellipse), and roughies (green ellipse) for better comparison. The auximetric plot allows
comparison of species according to their speed of growth at a given asymptotic size (vertical direction) and according to their body size for a given speed of
growth (horizontal direction). It also allows comparison of species in terms of their global growth capacity by superimposing isolines of the growth performance
index f0 = logðK Þ + 2 logðTLN Þ since these have a known slope of 2 (dashed black lines labeled with the corresponding f0 values).
(B) Growth performance index f0 of the coelacanth (diamonds) under the various aging hypotheses (same colors as in A) relative to other taxonomic groups of
marine fish species (boxplots; same colors as in A). Labeled vertical lines give the percentiles of the distribution of f0 values across all marine fish species
corresponding to the f0 values of the African coelacanth under the various aging hypotheses. Boxplots are defined as in Figure 1. Von Bertalanffy growth pa-
rameters for other marine fish were extracted from FishBase in June 2020 (1,383 populations distributed across 1,313 species).
the fastest growing fishes with a similar asymptotic length (Fig- to that of deep-sea sharks, concurring with the morphological
ure 3A) and above the 90th percentile of the growth performance and physiological traits of the living coelacanth, as well as its
index f0 distribution across all marine fish (Figure 3B). Such high lifestyle.
body growth capacity is almost equivalent to that of tunas13 (Fig- These results suggest that aging coelacanths by interpreting
ure 3) that have evolved unique morphological (streamlined body circuli as annual growth marks provides the most realistic esti-
and fin shapes and large mass-specific gill surface area) and mates of seasonal scale formation and lifelong body growth,
physiological (high oxygen-affinity blood, combined with endo- with the longevity of the coelacanth estimated to be close to
thermy, high proportion of red muscle, and high cardiac perfor- one century. This observed longevity is five times greater than
mance13) characteristics to support their high growth perfor- previously estimated. Only one study had hypothesized such
mance and very active lifestyle. These traits differ strongly from an extended lifespan,6 but with no direct evidence. Our study un-
those of coelacanths, which are typical of fish with low growth equivocally demonstrates for the first time the coelacanth
performance and high longevity19 like deep-sea fish with low exceptional longevity and positions it as one of the most long-
metabolic rates. In contrast, the body growth pattern obtained lived fish species. The factor of five between longevity estimates
from circuli would place L. chalumnae among the slowest originates from the fact that the macro-circuli used by the previ-
growing fish within the same range of asymptotic length (Fig- ous studies for aging do not exhibit a circannual formation
ure 3A) and close to the mode of the growth performance index rhythm and appear with an approximately 5-year periodicity
f0 distribution (64th percentile; Figure 3B). This growth is similar throughout the lifespan of both males and females (Figure S2).
4 Current Biology 31, 1–8, August 23, 2021 et al., New scale analyses reveal centenarian African coelacanths, Current Biology (2021), https://doi.org/
Please cite this article in press as: Mahe
10.1016/j.cub.2021.05.054
ll
Report
Two hypotheses may explain the presence of these macro-cir- coelacanth and elasmobranches.24 Species that rely on internal
culi, the first one being of exogenous origin, namely periodic fertilization and produce a few large fullydeveloped offspring af-
environmental events, and the other of endogenous origin, i.e., ter a long gestation, especially ovoviviparous and viviparous
periodic physiological/behavioral events. Regarding the former, ones, tend to mature later in life than species that lay very large
strong variations in environmental conditions such as salinity or number of eggs, rely on external fertilization, and produce unde-
temperature are known to leave marks on scales, and large- veloped larvae (most teleost fishes25). This conforms to life-his-
scale climate oscillations such as the Indian Ocean Dipole tory theory that predicts that an increased survival probability
(IOD) or the El Niño-Southern Oscillation (ENSO)20 could pro- of immature life stages, such as in case of ovoviviparity and vivi-
duce periodic scale marks. However, an exogenous origin would parity, favors the evolution of delayed maturation.26 The delayed
imply a mark deposition on scales that is synchronized across maturity of the coelacanth relative to its longevity also implies a
individuals. This synchrony is not observed in the years of shorter relative reproductive lifespan than teleost fishes. This re-
appearance of the macro-circuli for the different individuals in sults in very different benefits and demographic consequences
our sample (Figure S2A). The hypothesis of an endogenous of extreme longevity. In teleost, long-lived species have an
origin (periodic physiological or behavioral stresses) seems extended reproductive lifespan and thus ‘‘sample’’ multiple
thus more likely. Periodic events that affect both sexes reproductive events. In a variable environment resulting in fluctu-
equally, as macro-circuli are found in both females and males, ating recruitment, this allows taking advantage of occasional
such as migration or reproductive behavior are potential candi- favorable environmental conditions to produce strong year clas-
dates. Unfortunately, knowledge on the biology and behavior ses literally ‘‘stored’’ in the adult population until conditions for
of the coelacanth remains too fragmented to address this hy- strong recruitment return, a type of bet-hedging strategy also
pothesis further. called ‘‘storage effect.’’27 In contrast, the coelacanth demog-
raphy is likely to rely on a continuous influx of weak recruitment
Implications for life history and conservation insured by very high survival rates of a few offspring per individ-
In addition to longevity and body growth, two other aspects the ual whatever the environmental conditions.
coelacanth’s life history can be reappraised with our new age Based on our reappraisal of time-related life-history traits of
estimation method: the duration of gestation and the age at first the coelacanth, namely the rate at which asymptotic length is
sexual maturity. The early life of coelacanth is not well known and reached (through the von Bertalanffy rate coefficient K),
developmental stages available in collections are rare. In our maximum observed longevity, age at first sexual maturity, and
sample, two different pre-partum embryos (CCC29.5 and gestation duration, we assessed its location along the slow-
CCC162.21), one early post-partum juvenile (CCC94), and fast life-history continuum in marine fish. A principal component
another slightly older juvenile were available (Table S1). The analysis was performed on these four life-history traits across
age of both pre-partum specimens is estimated at 5 years based 147 populations in 131 marine fish species extracted from Fish-
on circuli whereas that of the two post-partum individuals is esti- Base.18 By focusing on life-history traits with time dimension-
mated at 9 and 12 years, respectively. This indicates that the ality, we avoided the problem of heterogeneous dimensions
gestation duration is at least 5 years contrary to the 1 to 2 years across traits that may prevent correct interpretation of life-his-
suggested by earlier studies. The length at birth is uncertain, but tory strategies in terms of the slow-fast continuum.12 Ideally,
the size of the largest observed pre-partum individual from a litter the phylogenetic relatedness between species should have
of 26 near-term embryos21 ranging from 30.8 to 35.8 cm total been accounted for in this analysis. However, as far as we are
length found in a gravid female could be a good estimation. aware, no phylogeny relating the coelacanth, Actinopterygii,
Based on our estimate of the von Bertalanffy growth model and Chondrichthii with a sufficiently fine granularity, i.e.,
and under the assumption that embryos follow the same growth including most species of our life-history dataset, is currently
pattern as post-partum individuals, such length at birth would available. In addition, past analyses in other taxa have shown
also give a gestation period close to 5 years. The earlier hypoth- that phylogenetic inertia does not strongly affect the detection
esis of a long gestation is thus confirmed2 but largely extended, and strength of the slow-fast continuum.12 The first principal
placing the coelacanth among the vertebrates with the longest component observed trades off high longevity and late maturity
gestation period, alongside the deep-sea frilled shark Chlamy- against fast rate of approach toward asymptotic size, and thus
doselachus anguineus (3 years).22 can be considered as the main component of the slow-fast
The length at first sexual maturity was estimated to range be- life-history continuum, whereas the second one is mostly deter-
tween 120 and 129 cm for males and between 160 and 179 cm mined by gestation duration (inversely related to spawning fre-
for females.6,7 These values were obtained from the anatomical quency used in the analysis; Figure 4A). The estimation of life-
and morphological differences between juveniles and mature history traits based on macro-circuli aging places the coelacanth
specimens. In light of our aging data (Table S1), these length in the main bulk of marine fish, close to the cluster formed by tu-
ranges would correspond to ages at first maturity ranging from nas (Figure 4A). In contrast, life-history traits estimated from cir-
40 to 69 years for males and from 58 to 66 years for females. culi position the coelacanth toward very slow life histories, close
These new estimates of age at first maturity are also close to to deep-sea sharks and roughies (Figure 4A). Taking the first PC
those of the frilled shark and correspond to an onset of matura- as a metric of the slow-fast life-history continuum, aging based
tion much later in life (ratio of age maturity to maximum longevity: on circuli places the coelacanth among the slowest life histories
0.47–0.81 for males and 0.68–0.78 for females) than in teleost (0th percentile) together with roughies and deep-sea sharks,
fishes (range: 0.16–0.39 and typical values: 0.25–0.3023). This whereas aging based on macro-circuli would correspond to a
pattern is consistent with the reproductive strategy of both faster, moderate pace of life (26th and 13th percentile for
Current Biology 31, 1–8, August 23, 2021 5 et al., New scale analyses reveal centenarian African coelacanths, Current Biology (2021), https://doi.org/
Please cite this article in press as: Mahe
10.1016/j.cub.2021.05.054
ll
Report
Figure 4. Locating the African coelacanth along the slow-fast life-history continuum in marine fish under the various aging hypotheses
(A) Biplot of the two first axes of a principal component (PC) analysis on time-related life-history traits (von Bertalanffy rate coefficient K, sexual maturity age,
maximum observed longevity, and spawning frequency/inverse of gestation time) of marine fish after log10-transformation, removal of the effect of body size,
centering, and scaling. The coelacanth projection (diamonds) on the PC plane under the various aging hypotheses (same colors as in Figure 3) can be compared
to the projections of other taxonomic groups of marine fish species (solid circles; same colors as in Figure 3). The percentage of variance explained by the PCs is
indicated between parentheses in axis labels. Arrows indicate how much each life-history trait contributes to each PC according to its projection on each PC axis
and the angle between the arrows is indicative of the correlation between life-history traits, orthogonality meaning independence and opposite directions
meaning negative correlations. Clearly, the first PC corresponds to the slow-fast life-history continuum as it trades off high longevity and late maturation on the
left-hand side against fast approach rate toward asymptotic length on the right-hand side, whereas the second PC mainly involves spawning frequency.
(B) Position of the coelacanth (diamonds) under various aging hypotheses (same colors as in Figure 3) relative to other taxonomic groups of marine fish species
(boxplots; same colors as in Figure 3) along the slow-fast life-history continuum (scores along PC1, A). Labeled vertical lines give the percentiles of the distribution
of the scores along PC1 of all marine fish species that correspond to the scores of the coelacanth under the various aging hypotheses. Boxplots are defined as in
Figure 1. Life-history traits for other marine fish were extracted from FishBase in June 2020 (147 populations distributed across 131 species).
macro-circuli aging of our data and previous data, respectively; conservation and management as exemplified by some deep-
Figure 4B). sea fisheries.30 The African coelacanth is assessed as critically
The new aging method developed in this study shows that the endangered (Red List of Threatened Species of IUCN). Our re-
African coealacanth, L. chalumnae, may live for about a century, sults suggest that it may be even more threatened than expected
making it one of the most long-lived fish species. Alongside its due to its peculiar life history. Further studies on the biology and
exceptional longevity, this study showed that the African coela- ecology of the coelacanth, especially on its reproductive biology
canth has one of the slowest life histories among marine fish, and and behavior, are needed to be able to preserve this unique
possibly all vertebrates, characterized by a slow body growth component of life on Earth.
relative to its size, very late age at first sexual maturity, and
exceptionally long gestation time, which is in concord with its STAR+METHODS
ovoviviparity, relatively small clutch size, and reduced meta-
bolism. These life-history and physiological characteristics are Detailed methods are provided in the online version of this paper
partly similar to those observed in the human fish (Proteus angui- and include the following:
nus),28 a small cave salamander with one of the slowest life his-
tories among vertebrates. Long-lived species characterized by d KEY RESOURCES TABLE
slow life history and relatively low fecundity are known to be d RESOURCE AVAILABILITY
extremely vulnerable to perturbations of a natural or anthropic B Lead contact
nature due to their very low replacement rate.29 Ignoring such B Materials availability
characteristics has been shown to be detrimental to B Data and code availability
6 Current Biology 31, 1–8, August 23, 2021 et al., New scale analyses reveal centenarian African coelacanths, Current Biology (2021), https://doi.org/
Please cite this article in press as: Mahe
10.1016/j.cub.2021.05.054
ll
Report
d EXPERIMENTAL MODEL AND SUBJECT DETAILS 5. Smith, C.L., Rand, C.S., Schaeffer, B., and Atz, J.W. (1975). Latimeria, the
d METHOD DETAILS living coelacanth, is ovoviviparous. Science 190, 1105–1106.
B Sclerochronology 6. Fricke, H., Hissmann, K., Froese, R., Schauer, J., Plante, R., and Fricke, S.
B Age validation method: Marginal Increment Analysis (2011). The population biology of the living coelacanth studied over 21
B Body growth models years. Mar. Biol. 158, 1511–1522.
B Auximetric plot and growth performance comparison 7. Bruton, M.N., and Armstrong, M.J. (1991). The demography of the coela-
canth Latimeria chalumnae. Environ. Biol. Fishes 32, 301–311.
B Slow-fast life-history continuum analysis
d QUANTIFICATION AND STATISTICAL ANALYSIS 8. Hismann, K., Fricke, H., and Schauer, J. (2000). Patterns of time and space
utilisation in coelacanths (Latimeria chalumnae), determined by ultrasonic
B Body growth models
telemetry. Mar. Biol. 136, 943–952.
B Slow-fast life-history continuum analysis
9. Decamps, T., Herrel, A., Ballesta, L., Holon, F., Rauby, T., Gentil, Y., Gentil,
C., Dutel, H., Debruyne, R., Charrassin, J.-B., et al. (2016). The third
SUPPLEMENTAL INFORMATION dimension: a novel set-up for filming coelacanths in their natural environ-
ment. Methods Ecol. Evol. 8, 322–328.
Supplemental information can be found online at https://doi.org/10.1016/j. 10. Hughes, G.M. (1995). The gills of the coelacanth, Latimeria chalumnae, a
cub.2021.05.054. study in relation to body size. Philos. Trans. R. Soc. Lond. B Biol. Sci.
347, 427–438.
ACKNOWLEDGMENTS 11. Fricke, H., and Hissman, K. (2000). Feeding ecology and evolutionary sur-
vival of the living coelacanth Latimeria chalumnae. Mar. Biol. 136,
We are grateful to R. Elleboode and G. Bled Defruit for age readings. We thank 379–386.
C. Bens and A. Verguin of the Collection de Pièces anatomiques en Fluides at
12. Gaillard, J.M., Lemaı̂tre, J.F., Berger, V., Bonenfant, C., Devillard, S.,
the Muse um National d’Histoire Naturelle (MNHN) for their help, E. Sultan of
Douhard, M., Gamelon, M., Plard, F., and Lebreton, J.D. (2016). Life his-
UMR LOCEAN CNRS-MNHN for providing the Comoros climatic data, and
tory axes of variation. In The Encyclopedia of Evolutionary Biology, R.
L. Poloni, S. Couette, and C. Toti Lutet for micro-computed tomography scan-
Kliman, ed. (Academic Press), pp. 312–323.
ning of scales of one specimen at MorphOptics of the UMR CNRS uB EPHE
6282 Bioge osciences. We would especially thank M. Etherton, W. McCurdy, 13. Murua, H., Rodriguez-Marin, E., Neilson, J.D., Farley, J.H., and Juan-
A. Herrel, and K.M. MacKenzie for their valuable help in editing this manuscript. Jordá, M.J. (2017). Fast versus slow growing tuna species: age, growth,
We are extremely grateful to the two anonymous referees, J.M. Gaillard, and and implications for population dynamics and fisheries management.
the editor for their especially helpful and constructive comments to improve Rev. Fish Biol. Fish. 27, 733–773.
the manuscript. The MNHN gives access to its collections in the framework 14. Vitale, F., Worsøe Clausen, L., and Nı́ Chonchúir, G. (2019). Handbook of
of the RECOLNAT National Research Infrastructure. fish age estimation protocols and validation methods. ICES Coop. Res.
Rep. 346, 1–180.
AUTHOR CONTRIBUTIONS 15. Treble, M.A., Campana, S.E., Wastle, R.J., Jones, C.M., and Boje, J.
(2008). Growth analysis and age validation of a deepwater Arctic fish:
M.H., K.M., and B.E. contributed to the conception and design of the study. the Greenland Halibut (Reinhardtius hippoglossoides). Can. J. Fish.
M.H. performed the sampling. K.M. organized the image acquisition and aging Aquat. Sci. 65, 1047–1059.
data collection. K.M. performed the analysis of growth patterns and the mar- 16. Le Cren, E.D. (1947). The determination of the age and growth of the perch
ginal increment analysis and B.E. the auximetric analysis and the slow-fast life- (Perca fluviatilis) from the opercular bone. J. Anim. Ecol. 16, 188–204.
history continuum analysis. All authors provided input for the results and dis- 17. Nulens, R., Scott, L., and Herbin, M. (2011). An updated inventory of all
cussion. K.M. wrote the first draft of the manuscript and B.E. wrote sections known specimens of the coelacanth, Latimeria spp. Smithiana Special
of the manuscript. All authors provided critical comments and were involved Publication 3, 1–52.
in the revision and editing of the manuscript. All authors accepted the final
18. Froese, R., and Pauly, D. (2019). FishBase. www.fishbase.org.
version of the manuscript.
19. Cailliet, G.M., Andrews, A.H., Burton, E.J., Watters, D.L., Kline, D.E., and
Ferry-Graham, L.A. (2001). Age determination and validation studies of
DECLARATION OF INTERESTS
marine fishes: do deep-dwellers live longer? Exp. Gerontol. 36, 739–764.
The authors declare no competing interests. 20. Sinha, M., Jha, S., and Chakraborty, P. (2020). Indian Ocean wind speed
variability and global teleconnection patterns. Oceanologia 62, 126–138.
Received: March 26, 2021 21. Heemstra, P.C., and Greenwood, P.H. (1992). New observations on the
Revised: May 10, 2021 visceral anatomy of the late term foetuses of the living coelacanth fish
Accepted: May 25, 2021 and the oophagy controversy. Proc. Biol. Sci. 249, 49–55.
Published: June 17, 2021 22. Tanaka, S., Shiobara, Y., Hioki, S., Abe, H., Nishi, G., Yano, K., and Suzuki,
K. (1990). The reproductive biology of the frilled shark, Chlamydoselachus
REFERENCES anguineus from Suruga Bay, Japan. Jpn. J. Ichthyol. 37, 273–291.
23. Beverton, R.J.H. (1992). Patterns of reproductive strategy parameters in
1. Hureau, J.C., and Ozouf, C. (1977). Determination de l’âge et croissance some marine teleost fishes. J. Fish Biol. 41, 137–160.
du coelacanthe Latimeria Smith, 1939 (poisson, crossopterygian, coela- 24. Conrath, C.L., and Musick, J.A. (2012). Reproductive biology of elasmo-
canthide). Cybium. Ser. 3, 129–137. branchs. In Biology of Sharks and Their Relatives, J.C. Carrier, J.A.
2. Froese, R., and Palomares, M.L.D. (2000). Growth, natural mortality, Musick, and M.R. Heithaus, eds. (CRC Press), pp. 307–328.
length weight relationship, maximum length and length-at-first-maturity 25. Gunderson, D.R. (1997). Trade-off between reproductive effort and adult
of the coelacanth Latimeria. Environ. Biol. Fishes 58, 45–52. survival in oviparous and viviparous fishes. Can. J. Fish. Aquat. Sci. 54,
3. Smith, J.L.B. (1939). A living fish of Mesozoic type. Nature 143, 455–456. 990–998.
4. Fricke, H., Hissmann, K., Schauer, J., Reinicke, O., and Ksang, L. (1991). 26. Ernande, B., Dieckmann, U., and Heino, M. (2004). Adaptive changes in
Habitat and population size of the coelacanth Latimeria chalumnae at harvested populations: plasticity and evolution of age and size at matura-
Grand Comoro. Environ. Biol. Fishes 32, 287–300. tion. Proc. Biol. Sci. 271, 415–423.
Current Biology 31, 1–8, August 23, 2021 7 et al., New scale analyses reveal centenarian African coelacanths, Current Biology (2021), https://doi.org/
Please cite this article in press as: Mahe
10.1016/j.cub.2021.05.054
ll
Report
27. Warner, R.R., and Chesson, P.L. (1985). Coexistence mediated by recruit- 35. Verhulst, P.F. (1838). Notice sur la loi que la population poursuit dans son
ment fluctuations: a field guide to the storage effect. Am. Nat. 125, accroissement. Corresp. Math. Physiol. 10, 113–121.
769–787. 36. Pauly, D. (1979). Gill size and temperature as governing factors in fish
28. Voituron, Y., de Fraipont, M., Issartel, J., Guillaume, O., and Clobert, J. growth: a generalization of von Bertalanffy’s growth formula (Univ. Kiel
(2011). Extreme lifespan of the human fish (Proteus anguinus): a challenge and Institut für Meereskunde), PhD Thesis.
for ageing mechanisms. Biol. Lett. 7, 105–107. 37. Akaike, H. (1974). A new look at the statistical model identification. IEEE
29. Cheung, W.W.L., Pitcher, T.J., and Pauly, D. (2005). A fuzzy logic expert Trans. Automat. Contr. 19, 716–723.
system to estimate intrinsic extinction vulnerabilities of marine fishes to 38. Sakamo, Y., Ishiguro, M., and Kitagawa, G. (1986). Akaike Information
fishing. Biol. Conserv. 124, 97–111. Criterion Statistics (Springer).
30. Norse, E.A., Brooke, S., Cheung, W.W.L., Clark, M.R., Ekeland, I., Froese, 39. Boettiger, C., Lang, D.T., and Wainwright, P.C. (2012). rfishbase:
R., Gjerde, K.M., Haedrich, R.L., Heppell, S.S., Morato, T., et al. (2012). exploring, manipulating and visualizing FishBase data from R. J. Fish
Sustainability of deep-sea fisheries. Mar. Policy 36, 307–320. Biol. 81, 2030–2039.
31. Beamish, R.J., and McFarlane, G.A. (1983). The forgotten requirement for 40. Chessel, D., Dufour, A., and Thioulouse, J. (2004). The ade4 Package - I:
age validation in fisheries biology. Trans. Am. Fish. Soc. 112, 735–743. one-table methods. R News 4, 5–10. https://cran.r-project.org/doc/
32. Campana, S. (2001). Accuracy, precision and quality control in age deter- Rnews/.
mination, including a review of the use and abuse of age validation 41. Wickham, H. (2016). ggplot2: elegant graphics for data analysis (Springer-
methods. J. Fish Biol. 59, 197–242. Verlag).
33. Von Bertalanffy, L. (1938). A quantitative theory of organic growth 42. Kassambara, A., and Mundt, F. (2020). factoextra: extract and visualize the
(Inquiries on growth laws II). Hum. Biol. 10, 181–213. results of multivariate data analyses (R package version 1.0.7). https://
34. Gompertz, B. (1825). On the nature of the function expressive of the law of CRAN.R-project.org/package=factoextra.
human mortality and on a new mode of determining the value of life con- 43. Kassambara, A. (2020). ggpubr: ‘ggplot2’ based publication ready plots (R
tingencies. Philos. Trans. R. Soc. Lond. 115, 515–585. package version 0.4.0). https://CRAN.R-project.org/package=ggpubr.
8 Current Biology 31, 1–8, August 23, 2021 et al., New scale analyses reveal centenarian African coelacanths, Current Biology (2021), https://doi.org/
Please cite this article in press as: Mahe
10.1016/j.cub.2021.05.054
ll
Report
STAR+METHODS
KEY RESOURCES TABLE
REAGENT or RESOURCE SOURCE IDENTIFIER
Biological samples
The list of specimens is in Table S1 All specimens are stored in the public See Table S1, CCC number is the
collections of the French National Museum individual’s number in the inventory of all
of Natural History and in the Bavarian State known coelacanth specimens by the
Collection of Zoology Coelacanth Conservation Council (CCC)
Deposited data
Aging data of Coelacanth This paper See Table S1
Life-history traits of other marine fish Life-history traits for the other marine fish https://www.fishbase.se/search.php;
species species were extracted from FishBase in (Popgrowth, Species, Maturity, Fecundity
June 2020. and Spawning tables)
Software and algorithms
TNPC software This software (TNPC; Traitement https://wwz.ifremer.fr/manchemerdunord/
Nume rique des Pièces Calcifie
es / Unite-Halieutique/Plateformes-et-outils/
Numerical Treatment of Calcified Pole-de-Sclerochronologie/Logiciel-TNPC
Structures) was deployed by IFREMER for
the aging of marine fish from calcified
structures such as scales
R Code Development Team All data extracted and R codes supporting https://doi.org/10.17882/80498
the current study have been deposited in
SEANOE
RESOURCE AVAILABILITY
Lead contact
lig MAHE (kelig.
Further information and requests for resources should be directed to and will be fulfilled by the Lead Contact, Ke
mahe@ifremer.fr)
Materials availability
This study did not generate any reagents or other materials.
Data and code availability
All data on coelacanth specimens are available in the Supplemental Material. Data on the other marine fish species were extracted
from FishBase in June 2020 (Key resources table). All data extracted and R codes supporting the current study have been deposited
in SEANOE (https://doi.org/10.17882/80498).
EXPERIMENTAL MODEL AND SUBJECT DETAILS
Between 2 and 5 scales were sampled from the basal part of the first dorsal fin of coelacanth specimens from public natural history
collections: two specimens of the Zoologischen Staatssammlung München (ZSM; The Bavarian State Collection of Zoology) and 25
um National d’Histoire Naturelle de Paris (MNHN; The French Na-
of the Collections des pieces anatomiques en fluide from the Muse
tional Museum of Natural History). For each specimen, we provide the inventory number of the institution that houses the collection
and the Coelacanth Conservation Council (CCC) number17 (Table S1). The specimens of the MNHN and ZSM are stored in 10%
formalin and 70 alcohol, respectively. The MNHN’s specimens are conserved in the formalin since their capture and, with time,
the un-buffered conservative solution became acid, which could have damaged the structure of some scales.
METHOD DETAILS
Sclerochronology
The coelacanth has an elasmoid-type scale that has evolved several times independently in the evolutionary history of fish. All scales
were rehydrated and cleaned. After this preliminary step, they were photographed under transmitted light using a Zeiss microscope
Current Biology 31, 1–8.e1–e4, August 23, 2021 e1 et al., New scale analyses reveal centenarian African coelacanths, Current Biology (2021), https://doi.org/
Please cite this article in press as: Mahe
10.1016/j.cub.2021.05.054
ll
Report
equipped with a camera to observe the series of concentric macroscopic circuli (macro-circuli). In a second step, they were photo-
graphed under polarized light microscopy in order to increase the contrast between structures. Polarized light microscopy reveals
topographical details on anisotropic materials, including bio-calcified structures such as scales, which are difficult to observe under
transmitted light. Polarized light revealed more numerous circuli, thinner than the macro-circuli and formed by alternating translucent
and opaque bands suggestive of growth rate variation. Several scales were scanned using a micro-computed tomography scanner
(CT scan) providing a high resolution 3-dimensional representation of the object. In a few cases, the structures on the scale were not
distinguishable due to degradation by the formalin solution and thus scale interpretation was not possible in the corresponding spec-
imens (Table S1).
The image processing was performed using the image analysis system TNPC (Digital processing for calcified structures) for pic-
tures under both transmitted and polarized light. Two sclerochronology experts analyzed each scale by identifying macro-circuli un-
der transmitted light and circuli under polarized light along the longest growth axis, i.e., from the proximal to the distal end of the scale
(Figure 1). Several scales per specimen were used to obtain a robust estimate of the number of (macro-) circuli and thus of the age of
the specimen under the assumption of an annual growth periodicity (see Age validation method: Marginal Increment Analysis below).
Age validation method: Marginal Increment Analysis
Calcified structures in fish have the potential to grow throughout the life of the individual without resorption. Variations in the individ-
ual’s body growth are translated into variations in the growth of the calcified structures. These variations are revealed by the optical
properties of the bio-calcified material that appears either opaque or translucent. Hence, circannual rhythm in body growth and calci-
fied structure formation produces an alternation of translucent and opaque bands on the latter. Pairs of translucent-opaque bands
correspond to annual increments and can thus be used for aging individuals. However, for using observed increments on calcified
structures (here macro-circuli and circuli on coelacanth scales) to age individuals, it is necessary to validate their annual frequency of
formation as any event affecting growth may produce such a mark (e.g., transition from endogenous to exogenous nutrition in larvae,
migration, gestation, thermal shock). Such age validation is required for establishing the accuracy of an age estimation method.31
Marginal Increment Analysis (MIA) is the most commonly used age validation method and allows assessing the periodicity of incre-
ment formation in bio-calcified structures.32 It is a quantitative approach that relies on a measure of the size of the increment under
formation (named the marginal increment), i.e., the distance between the most recently formed (macro-) circuli and the edge of the
scale, relative to the size of the last fully formed increment, i.e., the distance between the last-but-one and the most recently formed
(macro-) circuli. In mathematical notation, the relative measure of the marginal increment, MI, is given by:
RO Rn
MI =
Rn Rn1
Where RO is the radius of the scale measured from its focus to the edge (Figure 1), Rn is the distance between the focus and the last
(macro-) circuli formed n, and Rn1 is the distance between the focus and the last-but-one (macro-) circuli n 1. If (macro-) circuli are
formed annually, the marginal increment MI will thus exhibit an intra-annual periodic pattern that can be observed by plotting its mea-
sure against the date of its origin, i.e., the month at which the specimen was captured. MI was measured for each specimen using
macro-circuli under transmitted light and circuli under polarized light and plotted against the month of capture. A sinusoidal regres-
sion of MI against the month of capture m with a period of 12 months was used to test for the annual periodicity of (macro-)-circuli
formation after linearization:
2p 2p 2p
MI a + b sin m + c = a + b sinðcÞcos m + b cosðcÞsin m (Equation 1a)
12 12 12
so that,
2p 2p
MI a0 + a1 cos m + a2 sin m (Equation 1b)
12 12
1=2
a1
witha = a0 ; b = a21 + a22 ; and c = arctan a2 :
The global significance of the linear regression provided a statistical test for an intra-annual pattern in (macro-) circuli MI. The clas-
sical assumptions of the linear models (normality of, homoscedasticity of, and absence of trends in the residuals) were verified and
met.
Body growth models
The mean body growth patterns of the sampled specimens obtained by interpreting scales using macro-circuli and circuli were
described using three different growth models including:
a) the von Bertalanffy33 model:
TLt = TLN ðTLN TL1 Þ:eK:ðt1Þ (Equation 2)
e2 Current Biology 31, 1–8.e1–e4, August 23, 2021 et al., New scale analyses reveal centenarian African coelacanths, Current Biology (2021), https://doi.org/
Please cite this article in press as: Mahe
10.1016/j.cub.2021.05.054
ll
Report
b) the Gompertz34 model:
ln TL1=TL eK ðt1Þ
TLt = TLN e N (Equation 3)
c) the logistic35model:
TL
TLt = N (Equation 4)
1+ TLN
TL1
1 eK ðt1Þ
Where TL1 ; TLt ; and TLN are respectively the length at age 1, at age t and the asymptotic length, and K is the rate at which the
asymptote is reached, called the rate coefficient is this paper. Notice that the models started at age 1 as no data was available
for age 0 individuals, hence the age offset of 1 in the exponential: t 1:
Auximetric plot and growth performance comparison
The body growth patterns obtained for coelacanth macro-circuli and circuli were compared with those of other marine species using
two complementary approaches.
First, an auximetric plot,36 which is a double logarithmic plot (base 10) of the von Bertalanffy growth model parameters K versus
TLN , was produced. Given that K represents the rate at which TLN is reached in inverse time units whereas TLN represents the size
range of the species in size units, it is difficult to compare multiple growth patterns while accounting for both dimensions at the same
time. In addition, the fact that K and TLN are negatively correlated complicates the matter. The auximetric plot allows circumventing
these difficulties. A population characterized by a set of von Bertalanffy growth parameters ðTLN ; KÞ is represented by a point and
populations of a given species or species having similar growth characteristics will tend to form clusters of points that delimit the
growth space of that species or group of species. Moreover, the auximetric plot allows the comparison of species according to their
speed of growth at a given asymptotic size (vertical direction) and according to their body size for a given speed of growth (horizontal
direction).
Second, the ‘‘growth performance index’’36 was computed:
f0 = log 10 K + 2log 10 TLN (Equation 5)
This index has the interesting property of having the same dimension as a growth rate, i.e., size per unit time, and thus allows to
compare the global growth performances across species. A very high growth index would correspond to species growing fast to
large sizes relative to species with a low one. Empirically, the index f0 is shown to be distributed normally for populations of the
same species or phylogenetically close species. Isolines of the index f0 can be superimposed to the auximetric plot since these
have a known slope of 2, thus allowing both approaches to be used at the same time.
Both approaches were used for the comparison of the coelacanth with other marine fish species. Von Bertalanffy parameters for
the other marine fish species were extracted from FishBase in June 2020 (Popgrowth table18). Only populations for which size was
measured as total length were kept for comparison, resulting in 1,383 populations distributed across 1,313 species.
Slow-fast life-history continuum analysis
The location of the coelacanth along the slow-fast life-history continuum12 in marine fish was assessed using estimates of
time-related life-history traits obtained from both macro-circuli and circuli aging: the von Bertalanffy rate coefficient K (year-1),
the maximum observed longevity (year), the age at first sexual maturity (year), and the gestation duration (year) transformed into
a spawning frequency (year-1). These four traits were extracted for other marine fish species from FishBase in June 2020
(Popgrowth, Species, Maturity, Fecundity and Spawning tables18) and were available together for 147 populations distributed across
131 species.
QUANTIFICATION AND STATISTICAL ANALYSIS
Body growth models
For both macro-circuli and circuli aging, the best growth model was identified as the one minimizing the small-sample, bias-corrected
form of the Akaike Information Criterion (AICc37,38). The AICc balances the trade-off between the quality of fit and the number of pa-
rameters used38 while accounting for small-sample bias and is defined as:
Current Biology 31, 1–8.e1–e4, August 23, 2021 e3 et al., New scale analyses reveal centenarian African coelacanths, Current Biology (2021), https://doi.org/
Please cite this article in press as: Mahe
10.1016/j.cub.2021.05.054
ll
Report
2kðk + 1Þ
AICc = 2k 2 lnðLÞ + (Equation 6)
nk1
where n is the sample size, k is the total number of parameters of the model and L is its likelihood.
Slow-fast life-history continuum analysis
As time-related life-history traits are known to be affected by body size,12 the four traits were regressed against asymptotic total
length TLN after log10-transformation of the five variables. A Principal Components (PC) analysis was then carried out on the resid-
uals of the regressions of the four life-history traits after centering and scaling. The two first PCs explained 78.9% of the variation. A
biplot on the plane defined by the two first PCs was produced in order to identify the slow-fast life-history continuum and to position
the coelacanth life-history as estimated by the two aging methods. The biplot represents both populations’ projection on the PC
plane as dots and life-history trait projection as arrows.
Statistical analyses and plots were performed using the following packages in the statistical environment R: Rfishbase,39 ade4,40
ggplot2,41 factoextra,42 and ggpubr.43
e4 Current Biology 31, 1–8.e1–e4, August 23, 2021You can also read