New Southern Sky (NSS) Benefits Assessment - Report to Civil Aviation Authority of New Zealan d to inform the New Southern Sky Governance Group ...
←
→
Page content transcription
If your browser does not render page correctly, please read the page content below
New Southern Sky (NSS)
                 Benefits Assessment

       Report to Civil Aviation Authority of New Zealan d
      to inform the New Southern Sky Governance Group

                           May 2021

Revision v1.1                                       Mahino Consulting Ltd
                                             Telephone: +64 22 604 5294
                                         Email: tim.hughes@mahino.co.nz
Principal contact for this report:
Tim Hughes
+64 22 604 5294
tim.hughes@mahino.co
Disclaimer
Mahino Consulting Limited has prepared this document at the request of the New Southern Sky
Governance Group, Civil Aviation Authority of New Zealand, to inform the New Southern Sky
Governance Group, relying on information available publicly or supplied in discussions with aviation
system participants. The report has been prepared with due diligence and is believed on reasonable
grounds to be correct and not misleading. However, Mahino Consulting Limited and its directors and
employees do not warrant that the information or analysis is accurate or complete and accept no
liability whatsoever for any actions taken or any loss caused by reliance on this document or any
materials, correspondence of any kind or discussions associated with its preparation.
Mahino Consulting Limited 2021Table of Contents
Executive Summary...................................................................................................................... 5
1 Background, Purpose and Approach ..................................................................................... 6
1.1 Background ................................................................................................................. 6
1.2 Purpose ....................................................................................................................... 6
1.3 Approach ..................................................................................................................... 7
2 Aviation Activity Levels Since Covid-19 ................................................................................. 8
2.1 Covid-19 Timeline ........................................................................................................ 8
2.2 Impact of Covid-19 Response on Aviation Activity ......................................................... 8
2.3 Estimating Activity Affecting NSS Benefits .................................................................... 9
2.3.1 Analysis Framework .......................................................................................................... 9
2.3.2 Aircraft movement numbers ........................................................................................... 11
2.3.3 Passenger numbers ......................................................................................................... 14
2.3.4 PBN programme delivery ................................................................................................ 16
2.3.5 Fuel Price ......................................................................................................................... 17
2.3.6 Value of Passenger Time ................................................................................................. 17
3 Impact of Covid-19 on NSS Benefits .................................................................................... 18
3.1 The Benefit of Shorter Flightpaths .............................................................................. 18
3.1.1 Benefit Estimation ........................................................................................................... 18
3.1.2 Quantified Benefits ......................................................................................................... 21
4 Future Scenarios for NSS Benefits ....................................................................................... 23
4.1 Airport Accessibility and Resilience ............................................................................ 23
4.2 Foundation for Realising System-Wide Benefits .......................................................... 23
4.3 Recovering Post Covid-19 ........................................................................................... 24
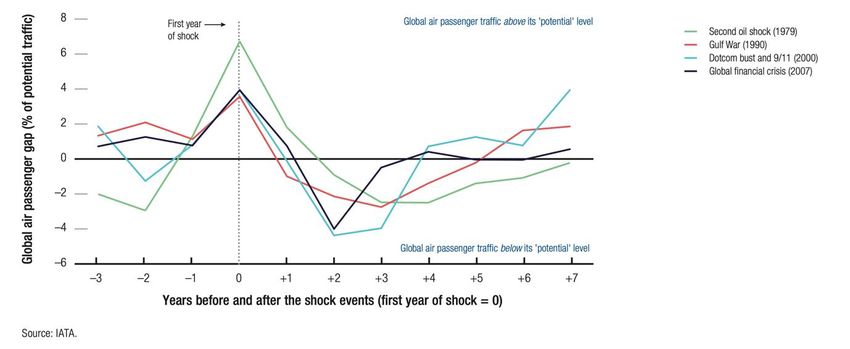
4.3.1 Impact of Previous Shocks on Global Air Travel .............................................................. 24
4.3.2 Future Scenarios for New Zealand .................................................................................. 25
5 Qualitative Update on Key NSS Benefits ............................................................................. 29
5.1 Efficiency and Capacity – Auckland Terminal Area ....................................................... 29
5.2 Accessibility – Queenstown ........................................................................................ 29
5.3 Environmental – A-CDM ............................................................................................. 30
5.4 Safety ........................................................................................................................ 31
5.5 Implementation of Infrastructure Components ........................................................... 31
5.5.1 Surveillance – ADS-B ....................................................................................................... 31
5.5.2 MetService ...................................................................................................................... 33
5.5.3 Air Traffic Management System Upgrade (Skyline X) ..................................................... 33
5.6 Regulatory Enablers ................................................................................................... 34
6 Future NSS Benefits Reporting............................................................................................ 35
6.1 Benefits Measurement ............................................................................................... 35
6.1.1 Minimum Practicable Method ........................................................................................ 35
6.1.2 Updated Baseline ............................................................................................................ 36
6.1.3 Technical Skill Set ............................................................................................................ 37
6.1.4 Optimising Reporting Costs ............................................................................................. 37
6.2 Transition to Business As Usual .................................................................................. 37List of Tables Table 1 Data Sources for Benefit Estimation ..................................................................................................10 Table 2 Full Benefit Commencement Dates - PBN Implementation ................................................................16 Table 3 Value of Passenger Time....................................................................................................................17 Table 4 Approximate PBN Benefits Delivered 2015-2020 ...............................................................................21 Table 5 The Effect of Covid-19 on NSS PBN Benefits ......................................................................................22 Table 6 Approximate Impact of Covid-19 on Benefit Realisation in 2020 .......................................................22 Table 7 Impact of Covid-19 Response on GDP and Death Rate for Selected Locations ...................................26 Table 8 Air Traffic Volume at Various Covid-19 alert levels in 2020 Compared with 2016 Reference Period ..28 Table 9 Scaling Method of Metric Estimation ................................................................................................35 List of Figures Figure 1 New Zealand Covid Level Timeline 8 Figure 2 NSS Benefits and Contributory Factors 10 Figure 3 Air Traffic Movements 2016 and 2020 11 Figure 4 Annual IFR Movements - Regional Airports with static growth 12 Figure 5 Annual IFR Movements - Regional Airports with growing traffic 12 Figure 6 Major Airport Annual IFR Movement Trends 13 Figure 7 Annual International IFR Movement Trends 13 Figure 8 Monthly Passenger Arrivals – Auckland 14 Figure 9 Average Passenger Load – Wellington 15 Figure 10 Average Passenger Load – Auckland 15 Figure 11 Jet Fuel Price Fluctuation 17 Figure 12 PBN Approach Path Distance Reduction 18 Figure 13 Relative Change in Global air Passenger Volume Before and After Selected Shock Events 25 Figure 14 Impulse Response Function of Global Air Passenger Traffic to a Shock (100%) In Time 25 Figure 15 Auckland Air Freight Volume Timeseries 27
Executive Summary
This report reviews the benefits realised from the NSS programme’s delivery of the NAANP. The 2014
Castalia economic analysis and subsequent reports recognised a benefits realisation period for NSS
running from 2015 through 2034; this report estimates the benefits delivered to the end of 2020
including the impact of the downturn due to the public health response to the Covid-19 pandemic.
PBN has been progressively implemented through the period, and was substantially complete by the
beginning of 2019. Flight efficiency benefits realised are in line with expectations from the 2018 Acuo
CBA and include:
    •   4.9 M kg fuel burn saved
    •   15.4 M kg CO2 emissions reduction
    •   $NZ 7.3 M saving in aircraft direct operating costs
    •   $NZ 5.7 M value of passenger time saved
PBN delivers a marginal gain to every flight using PBN approaches at the affected airports. As such, it
continued to deliver benefits in proportion to the volume of air traffic during the downturn in 2020.
Despite deep reductions during Covid-19 alert level 4, and ongoing international travel restrictions,
the benefits realised during 2020 are more than half those anticipated in normal times as New
Zealand’s successful elimination strategy for the Covid-19 pandemic means that domestic travel is
relatively unrestricted.
    •   2020 total air traffic movements at airports with PBN enabled were 68.4% of normal levels
    •   During Covid-19 alert level 1, the domestic air traffic daily average was 82% of normal levels
Benefits at Auckland and Queenstown airports have been enhanced since the 2018 Acuo report:
    •   An additional PBN RNP AR approach to Auckland improves the efficient use of airport capacity.
    •   The Air New Zealand ATR72 fleet is approved to use RNP AR approaches and departures at
        Queenstown, with the benefit of a reduction in diverted/cancelled flights in poor weather.
The planned enhancements to MetService infrastructure and services have been delivered, enabling
improved forecast quality, and weather-based decisions to be integrated into operations, and making
weather information more accessible through digital delivery and graphical formats.
The ADS-B surveillance infrastructure is in place, with the fleet progressively being upgraded, although
at a pace slower than hoped. Regulatory action in collaboration with users has resulted in significant
cost reductions for microlight, glider, and special category aircraft (up to $NZ 7.15M based on
estimates in the 2017 CBA), and Director approval for alternative position sources meeting certain
requirements is expected to accelerate installation of alternative position sources for aircraft in these
categories that previously were unable or unwilling to equip. The surveillance system resilience is to
be augmented through the commissioning of a contingency surveillance network to increase system
resilience and provide surveillance of non-cooperative targets.
The financial and resource constraints imposed by the downturn in air traffic has deferred some NSS
programme components: airport collaborative decision making (A-CDM) with benefits in reduced taxi
time and improved on time performance, and implementing PBN approaches at Napier and Gisborne.
The potential benefits from A-CDM well exceed those from PBN, however reconsidering the business
model may be important to achieving future delivery as costs and benefits do not fall on the same
stakeholders.
With the NSS team disbanding in June 2021, there is a need to transfer benefit management internally
within CAA. This report outlines approaches the Authority could select to implement an ongoing
benefits management regime.

                                                                                                       5
1 Background, Purpose and Approach
1.1 Background
Between 2009 and 2013 the CAA, in conjunction with the Ministry of Transport, Airways, MetService
and stakeholders from across the New Zealand aviation sector, developed a National Airspace and Air
Navigation Plan (NAANP) in response to the International Civil Aviation Organisation’s (ICAO) Global
Air Navigation Plan (GANP). In June 2014, the implementation of this plan, led by the CAA and branded
New Southern Sky (NSS), began to deliver a ten-year, three stage NSS programme, covering eight
separate domains, representing the whole of the aviation system in New Zealand.
The de-facto business case for NSS was an economic cost benefit analysis (CBA), which Castalia
delivered in March 2014 and subsequently updated in April 2015. While the main premise of the plan
was to deliver safety benefits, a major element of the CBA was to assess the benefits (primarily
economic, social and environmental) to be delivered by a Performance Based Navigation (PBN)
implementation plan. It outlined a range of interconnected areas where developments driven by the
introduction of PBN were to be staged over a ten-year period to bring about significant improvements
to New Zealand’s airspace and air navigation system.
In 2018 with many of the initial changes implemented the CAA engaged Acuo Ltd to provide an
independent and updated view of the expected costs and benefits being delivered by NSS. This used
actual data from across the Air Traffic Management (ATM) system and was supported by a detailed
technical analysis of operating performance benefits provided by Mahino Consulting Ltd.
1.2 Purpose
This report provides an evaluation of the benefits realised to date, and that may be anticipated in the
future as a result of the delivery of the NAANP. Where possible it provides quantitative data on the
benefits profiled in previous CBAs (Castalia 2014, 2015, ACUO 2018, ACDM 2019). Where it is not
possible to provide quantitative data there is qualitative analysis and commentary. The reason for this
evaluation is that the NSS team is disbanding in June 2021, and with the NSS programme reaching
completion in 2023 it is appropriate at this point to deliver an evaluation of the benefits and progress
on their realisation.
It does not analyse the full spectrum of planned investment and potential benefits associated with the
NAANP as the costs and benefits of some elements either have not yet been quantified or, in the view
of the reviewer, cannot be quantified sufficiently. This report has chosen to estimate quantifiable
benefits at an airport level of detail rather than for individual flights as the cost of a deep-dive analysis
is not considered best use of resource given the known large reduction in traffic and the current
volatility in New Zealand’s aviation system caused by Covid-19.
Covid-19 has had a significant impact on the benefits realisation of the NSS programme. However,
benefits, particularly from PBN, accrue in proportion to the volume of traffic. Although lower traffic
volume curing the Covid-19 period obtains fewer benefits, it is anticipated that benefits continue to
accrue in the present and may be anticipated in the future.
For consistency with earlier reports, previous CBA consultants Mahino Consulting Ltd has been
contracted to provide expert analysis. Furthermore, numerous external stakeholders (Airways, Air
New Zealand, BARNZ, NZ Airports Association) have contributed data and been consulted on draft
reports.
The purpose of this report is threefold:
• Provide a quantitative / qualitative update on the benefits profiled in previous reports
6• Outline a framework that will use levels of aviation activity to make an approximate
determination on what percentage of the benefits profiled are being delivered.
• Use this framework to approximate the impact of Covid-19 on benefits realisation and to
outline the pros and cons of different models for benefits realisation reporting to the NSS
programme’s end in 2023 and for the life of the benefits delivery period recognised in the
Castalia and Acuo reports to 2034.
1.3 Approach
The guiding principles used in the 2018 Acuo report remain the same.
That is “a standard national cost-benefit analysis approach (Treasury’s Guide to Social Cost Benefit
Analysis (2015), evaluating the extent to which the project is an economically efficient use of
resources. The approach is based, to the extent possible, on the national costs and benefits of a NSS
programme - a New Zealand welfare perspective – rather than benefits to any group or organisation.
Costs and benefits are assessed over the life of the NSS programme and ten years beyond (as used by
Castalia) and measured against a counterfactual of what would otherwise have happened. The costs
are the costs the NSS programme imposes on the economy (valued at the opportunity costs of the
extra resources a NSS programme uses) and the benefits are the extra outputs resulting from the
project at values that indicate consumer utility. These values are typically estimated from the
willingness of consumers to pay for the NSS programmes’ extra goods and services.
Costs and benefits are assessed over the whole period, summed into a single net present value (NPV)
indicating whether the use of resources in this NSS programme generates returns over and above the
cost of the capital and other costs required.”
The scope of this evaluation follows that report and does not seek to quantify any benefits previously
unquantified.
The constraints accepted by this report are that a qualitative approach would provide a more
appropriate avenue of evaluation. Given the well known large reduction in traffic and current volatility
in the sector, and the recency of the 2018 Acuo CBA, the reduced uncertainty that could be obtained
by a more in-depth analysis of large quantities of data from the ATM system at Airways may not justify
the significantly greater resource required.
As a result, there are a number of assumptions that have been made in the process of delivering this
evaluation. They are:
• Covid-19 has had a significant impact on benefits realisation
• The impact of Covid-19 on air traffic has been similar across the country
• The ‘as built’ PBN implementation is consistent with the design intentions previously
modelled
• The fleet and mix of routes flown domestically are similar to the past, except for frequency of
operation and passenger load factors at times. A sensitivity test is provided for this
assumption.
• The benefits of PBN will be realised for those flights that operate
72 Aviation Activity Levels Since Covid-19
2.1 Covid-19 Timeline
Restrictions on personal movement began in New Zealand on 14 March 2020, with a requirement that
anyone entering New Zealand must self-isolate for 14 days. On 19 March the borders closed to all but
New Zealanders and permanent residents.
The four level Covid-19 alert system was announced on 21 March 2020. The country immediately
entered level 2, transitioned to level 3 on 23 March, and level 4 on 25 March. Over succeeding months,
the country stepped down through the levels, returning to level 1 on 8 June.
On 8 August, following an outbreak of Covid-19, the Auckland region returned to level 3, and the rest
of the nation to level 2. Restrictions were stepped down over the subsequent weeks, and the country
returned to level 1 on 23 September.
The border remained closed until the commencement of quarantine free travel from Australia on 19
March 2021.
NZ covid-19 alert levels and border status
4
Covid Alert Level
3
passenger dist ancing
2 akl
nz
border
1
0
2020-01-01
2020-02-25
2020-04-20
2020-06-14
2020-08-08
2020-10-02
2020-11-26
2021-01-20
2021-03-16
2021-05-10
2021-07-04
Figure 1 New Zealand Covid Level Timeline
From the start of the Covid-19 response, until 24 September 2020, physical distancing was required
on aircraft, reducing the available seats on each flight.
Figure 1 shows the Covid-19 response timeline1. The chart shows New Zealand and Auckland Covid-
19 alert levels through 2020 and early 2021. The ‘border’ status is shown at level 3 where full
quarantine is required, level 4 when the border is closed, and level 2.5 where the border is open to
arrivals from some countries. Passenger distancing is shown when it applied, at level 4.5 for clarity.
2.2 Impact of Covid-19 Response on Aviation Activity
In brief, the constraints on aviation of the Covid-19 alert levels are:
1
Data source: covid19.govt.nz
8• Level 4: People are required to stay at home other than for essential personal movement.
Non-essential businesses closed. Travel is severely limited.
• Level 3: People are required to work from home if possible, remain in their household ‘bubble’
when not at work or school, and remain physically distanced from others. Travel between
regions is heavily restricted.
• Level 2: Air travel is permitted, including for recreation and tourism, with caution
• Level 1: Air travel is permitted.
The restrictions on movement and association required by the Covid-19 alert levels created a sharp
drop in flight frequency, and in supply and demand for seats. Elevated Covid-19 alert levels restrict
the number of passengers that can be carried when physical distancing is in place, and limit the
number of passengers seeking or permitted to travel.
The downturn in flight and passenger numbers had two other important effects: the impact on
aviation businesses has led to deferring the delivery of some elements of the NSS programme, (mainly
industry infrastructure projects) and changing demand has had a material impact on the price of fuel.
This report aims to evaluate the delivery of benefits from NSS to date, taking changes in these factors
into account to the extent practicable. Both the changes during 2020, and during the previous five
years are discussed in more detail as part of the analysis below.
2.3 Estimating Activity Affecting NSS Benefits
As the previous CBAs outlined, the benefits of the PBN NSS programme will vary with changes in the
quantity of air traffic. It is a logical and pragmatic approach for this report to use aviation activity levels
as a yardstick to approximate the benefits realisation.
2.3.1 Analysis Framework
The 2018 Acuo report is based on a detailed analysis of air traffic activity during a reference year
(2016), by assessing the benefit that would be obtained by each flight as a result of efficiencies gained
from the NSS programme implementation. This report aims to estimate the same benefit figures
where practicable for each year of the NSS programme to date, by scaling the 2016 reference year
according to the key factors that vary over time and location. Rather than using the ‘big data’
techniques based on a complete set of data for aircraft movements, it scales the 2016 baseline using
weighted average figures for the key input factors in each year.
Flight efficiency benefits from the PBN implementation depend on the relative orientation between
the runway and the route of flight and are therefore distinctly different for each airport. It follows that
this report’s analysis operates at the airport level of detail. Furthermore, as it is well known that
passenger load factors have been significantly different from normal in some periods during 2020,
passenger benefits are separately analysed, based on estimates of the varying load factors along the
time line.
Factors Affecting Benefits
Figure 2 below maps the main benefit categories identified in the 2018 Acuo report to NSS
deliverables and other parameters that affect the value of the realised benefits.
9Category Benefit
Flight time reduction ● ● ● ● ●
Time
Passenger Time Saved ● ● ● ● ●
Fuel burn reduction ● ● ● ● ● ●
Environmental
CO2 emission reduction ● ● ● ● ● ●
Fuel Cost Reduction ● ● ● ● ● ● ●
Costs Aircraft Direct Operating Cost (ADOC) reduction ● ● ● ● ● ●
Value of Passenger Time Saved ● ● ● ● ● ●
Safety Improved Safety on Approach ● ● ● ●
Airport Availability ● ● ●
Resilience
Airport Capacity ● ● ●
Category Contributing Factor
Number of Flights
Activity Level
Number of Passengers
Approaches with Vertical Guidance
Performance Based Shorter Approaches
Navigation System Lower Decision Height
Other instrument flight procedure (IFP) changes
ADOC
Aircraft Fuel Consumption Rate
Costs
Cost of Fuel
Other Value of Passenger Time
Delivery NSS Programme Element Implementation
Figure 2 NSS Benefits and Contributory Factors
To approximate the time, environmental, and cost benefits of the PBN implementation, the
framework estimates annual change factors for the key contributing variables in aviation activity on
flights benefitting from PBN. These are:
• Change in number of flights
• Change in number of passengers
• Delivery of PBN infrastructure
The framework also estimates annual changes in key parameters:
• Change in the cost of fuel
• Change in aircraft direct operating costs (ADOC)
• Value of passenger time
The next section of the report evaluates each of these, both for the Covid-19 era in 2020, and for the
preceding five years.
Data Sources
Parameter Data Source
Flight Data Monthly IFR movements at Attended Airways New Zealand
Aerodromes
Route, Aircraft Type, Available Seat capacity Air New Zealand
Number of Passengers Monthly traffic statistics Auckland International Airport
Wellington International Airport
Delivery of PBN Infrastructure Implementation Dates Airways New Zealand
Fuel Price USD Jet Fuel Price US Jet Fuel Price Monitor
NZD/USD exchange rate Reserve Bank of New Zealand
Change in ADOC Produce Price Index Statistics NZ
Value of Passenger Time Value of Time – Public Transport Users Ministry of Transport
Baseline NSS Benefit Value All benefit categories Acuo/Mahino report 2018, Civil
Aviation Authority of NZ
Table 1 Data Sources for Benefit Estimation
102.3.2 Aircraft movement numbers
Covid-19 Effect
During 2020, traffic levels varied greatly, in line with restrictions imposed by the Covid-19 alert levels,
with near nil traffic in April, ongoing low international movements, a steady re-establishment of
domestic traffic with a drop in August/September due to the Auckland Covid-19 outbreak and Covid-
19 alert level 3.
Air Traffic Movements
9000 45000
8000 40000
Intenational Movements
7000 35000
Domestic Movemets
6000 30000
5000 25000 International 2016
4000 20000 International 2020
3000 15000 Domesti c 2016
2000 10000 Domesti c 2020
1000 5000
0 0
Oc ber
ce r
M a ry
r
ve r
Fe ary
D e mbe
be
No obe
pt t
M l
ch
ly
Se us
ri
ne
ay
em
u
Ap
m
nu
Ju
ar
g
Ju
br
t
Au
Ja
Figure 3 Air Traffic Movements 2016 and 2020
Although there was a near cessation of flights during Covid-19 alert level 4, the successful elimination
of the pandemic in New Zealand allowed domestic air traffic to return to a large extent. As a result,
the reduction in the value of benefits is smaller than might have been expected. The annual traffic
movements at airports with PBN-enabled benefits in 2020 are 68.4% of the previous year.
Trends Since 2015
For earlier years, from 2015 on, the 2018 Acuo report presumed 5% annual compounding growth
based on the long-term trend in passenger numbers. This has been close to the growth in international
arrivals, with 4.5% compound annual growth between 2015 and 2019 (19.25% total increase),
however domestic traffic grew more slowly, by 6.29% (1.53% compound annual growth). In practice,
air traffic growth in New Zealand has been variable with many airports showing a shallow decline in
movements and some showing a steady growth since 20152.
There is a clear division over the last few years between those airports with more or less static or
declining IFR movements, and those that showed growth prior to 2020. The following data is sourced
from Airways NZ monthly traffic volume statistics.
Most regional airports have more or less constant or declining traffic over the medium term, focussing
on the years since 2016. The exception is Wanaka, which had a notable upswing in 2020 from the
steady medium-term figure of around 100 movements per year (+/-30) to 263 movements in 2020
with the commencement of new services by Sounds Air in November 2020.
2
Airport air traffic movement numbers in this section are sourced from Airways New Zealand
11New Zealand Regional Domestic IFR movements - Neutral Trend
40000
35000
30000 Dunedin
Gisborne
Annual Movements
25000 Hamilton
Invercargill
20000 Nelson
New Ply mouth
15000 Palmerston North
Rotor ua
10000 Wanaka
Whanganui
5000 Woodbourne
0
2011 2012 2013 2014 2015 2016 2017 2018 2019 2020
Calendar Year
Figure 4 Annual IFR Movements - Regional Airports with static growth
Three regional airports showed firm growth in traffic from around 2015 until 2020.
New Zealand Regional Domestic IFR Movements - Rising Trend
20000
18000
16000
14000
Annual Movements
12000
10000 Napier
Queenstown
8000
Taur anga
6000
4000
2000
0
2011 2012 2013 2014 2015 2016 2017 2018 2019 2020
Calendar Year
Figure 5 Annual IFR Movements - Regional Airports with growing traffic
At the main centre airports, domestic IFR traffic has been more or less constant in the medium term,
except for steady growth at Auckland above the longer-term level, since 2016.
12New Zealand Major Airport Domestic IFR Traffic
140000
120000
100000
Annual Movements
80000
Auckland
60000 Christchurch
Wel lington
40000
20000
0
2011 2012 2013 2014 2015 2016 2017 2018 2019 2020
Calendar Year
Figure 6 Major Airport Annual IFR Movement Trends
Over the medium term, international movements have increased strongly in Auckland and
Queenstown. Christchurch showed a steady annual increase until 2017, and Wellington a more or less
constant volume of international traffic except for a small step increase around 2015. For comparison,
the volume of international overflights shows a similar, if slightly stronger medium term, rising trend,
levelling off in 2018.
New Zealand International IFR movements
60000
50000
40000
Annual Movements
Auckland
30000 Christchurch
Oceanic Overflights
Queenstown
20000 Wel lington
10000
0
2011 2012 2013 2014 2015 2016 2017 2018 2019 2020
Calendar Year
Figure 7 Annual International IFR Movement Trends
The net effect of the generally modest growth in traffic is to reduce benefit realisation a little,
compared with that anticipated. Nonetheless, the benefits continue to be delivered by the NSS
programme initiatives as a marginal gain to every flight using the PBN approaches.
132.3.3 Passenger numbers
The 2018 Acuo analysis calculates the value of passenger time saved, by estimating the annual number
of passengers, using nominal constant load factors for domestic and international flights, and the
estimated seat capacity of each flight. The model was calibrated against known passenger numbers at
Auckland and Queenstown in 2015 and 2016, and agreed within 2.8% (Queenstown, domestic).
This analysis takes the same approach, by calibrating the modelled passenger numbers against the
those reported by Auckland international airport.
Traffic figures published by Auckland International Airport show a steady climb in both international
and domestic passengers3, consistent with the increase in the number of flights, until the start of the
Covid-19 pandemic.
Auckland Flight And Passenger Arrivals
10000 600000
9000 540000
Monthly Passenger Numbers
Monthly Aircraft Movements
8000 480000
7000 420000
6000 360000
5000 300000
4000 240000
3000 180000
2000 120000
1000 60000
0 0
1/01/16 1/01/17 1/01/18 1/01/19 1/01/20
Date
International Aircraft Arrivals Domesti c Aircraft Arrivals
International Passenger Arrivals Domesti c Passenger Arrivals
Figure 8 Monthly Passenger Arrivals – Auckland
Covid-19 Effect
During 2020, passenger volume was limited by Covid-19 lock-downs, and partly by the requirement
for physical distancing on board aircraft. International passenger numbers remain low, however
domestic travel recovered to 67% of pre-pandemic levels by the end of 2020, and close to that level
in July 2020 before the outbreak of Covid-19 and alert level 3 in Auckland in August.
Figures from both Auckland and Wellington show the average domestic passenger load returning to
typical levels when New Zealand is in Covid-19 alert level 1, including while physical distancing was in
place4. There is a clear consistency in the trend at both airports, although a different scale. Schedule
data supplied by Air New Zealand shows that this was achieved by using some higher capacity aircraft
on certain domestic routes (A321neo, Boeing 777, and Boeing 787)5 for short periods.
3
Passenger figures source: Auckland International Airport monthly traffic updates
4
Source for Wellington passenger figures: Wellington International Airport traffic reports
5
Source: Air NZ flight data (supplied)
14Average Passenger Load - Wellington
160 80
140 70
Passegners per Flight - International
Passegners Per Flight - Domestic
120 60
100 50
80 40
60 30
40 20
20 10
0 0
1/01/20 2/03/20 2/05/20 2/07/20 1/09/20 1/11/20 1/01/21
International Domesti c
Figure 9 Average Passenger Load – Wellington
International passenger loadings have stayed low throughout 2020 since the start of the pandemic.
Average Passenger Load - Auckland
250 100
Passengers Per Flight- International
Pasengers Per Flight - Domestic
200 80
150 60
100 40
50 20
0 0
0
0
0
0
0
0
0
0
0
0
0
0
/2
/2
/2
/2
/2
/2
/2
/2
/2
/2
/2
/2
01
02
03
04
05
06
07
08
09
10
11
12
1/
1/
1/
1/
1/
1/
1/
1/
1/
1/
1/
1/
Inter national Domesti c
Figure 10 Average Passenger Load – Auckland
Figure 9 and Figure 10 illustrate the average load factor for international and domestic flights arriving
at Wellington and Auckland. The impact of elevated Covid-19 alert levels is clear, with fewer
passengers willing to travel during an elevated Covid-19 alert level period. Interestingly, the load
factors return to normal levels between lock-downs, and since. This does not reflect a rise in passenger
numbers which have not returned to normal. Rather, it is in part due to the airline response to
changing travel demand, which is to alter or reduce schedules, and select aircraft with different
capacity to service the demand for travel.
The effect for PBN benefit realisation is to reduce the passenger time savings, however with relatively
standard load factors in practice the benefit rises and falls with the changing number of aircraft
movements.
152.3.4 PBN programme delivery
The delivery of the PBN programme has been progressive throughout the period, and occurred in
stages over several years at major aerodromes. The PBN implementation at most locations aligned
with plan, though deferrals did occur. PBN implementation is reliant on a range of stakeholders with
sometimes competing priorities and constraints around resource. Extensive lead-in time can be
required, particularly for airspace change and for community noise engagement relating to sensitive
flightpath changes.
The PBN implementation for Hawkes Bay and Gisborne has been affected by the Covid pandemic. In
response to the drop in revenue resulting from the drop in air traffic, Airways New Zealand called for
a review of service requirements at several airports, including Gisborne and Hawkes Bay. A decision
was made to defer development of navigation infrastructure at those airports until future service
requirements are confirmed. PBN implementation at these two locations has been deferred until at
least the end of 2022.
2012 2013 2014 2015 2016 2017 2018 2019 2020 2021 2022 2023
NZQN 15/11/2012
NZWN 24/07/2014
NZNV 24/07/2014
NZWK 18/09/2014
NZCH 2/04/2015
NZAA 28/05/2015
NZDN 23/07/2015
NZRO 10/11/2016
NZHN 10/11/2016
NZWU 10/11/2016
NZTG 10/11/2016
NZPM 10/11/2016
NZWB 14/10/2017
NZNP 9/11/2017
NZOH 24/05/2018
NZNS 8/11/2018
Planned 11/08/2018 NZWP 23/05/2019
Planned 8/11/2018 NZGS 1/12/2022
Planned 8/11/2018 NZNR 1/12/2022
Table 2 Full Benefit Commencement Dates - PBN Implementation
162.3.5 Fuel Price
The price of jet fuel has fluctuated continuously over the period, as have air traffic volumes. For this
reason, whereas the 2018 Acuo analysis used a nominal representative fuel price, this analysis
estimates a monthly weighted fuel price from the fuel price in USD, the NZD/USD exchange rate and
the New Zealand air traffic volume at the time.
Overall, there is a reduction in the cost of fuel saved. The weighted cost of fuel saved as a benefit of
the PBN implementation during the period is 0.616 NZ$/kg, an 11.3% reduction.
Jet Fuel Price Volatility
1.2 120
1 100
0.8 80
USD/bbl
NZD/kg
0.6 60
Previous Modelling
NZD/kg
0.4 40 USD/barrel
0.2 20
0 0
15/01/12
15/05/12
15/09/12
15/01/13
15/05/13
15/09/13
15/01/14
15/05/14
15/09/14
15/01/15
15/05/15
15/09/15
15/01/16
15/05/16
15/09/16
15/01/17
15/05/17
15/09/17
15/01/18
15/05/18
15/09/18
15/01/19
15/05/19
15/09/19
15/01/20
15/05/20
15/09/20
15/01/21
Date
Data source: US Jet Fuel Monitor (fuel price), Reserve Bank of New Zealand (NZD/USD exchange rate)
Figure 11 Jet Fuel Price Fluctuation
2.3.6 Value of Passenger Time
The 2018 Acuo report used the value of time for road users in the Economic Evaluation Manual
developed by NZTA/Waka Kotahi and published in 2002, using a single figure averaging business and
leisure values.
This analysis uses updated figures from the NZTA/Waka Kotahi “Monetised Costs and Benefits
Manual” (February 2021). The values have been revised down – a 30.1% reduction.
Purpose 2002 Value 2020 Value
Business 33.16 23.85
Leisure 10.84 6.90
50/50 Business/Leisure 22.00 15.375
Table 3 Value of Passenger Time
173 Impact of Covid-19 on NSS Benefits
3.1 The Benefit of Shorter Flightpaths
The cost, fuel burn, and environmental advantages of PBN arise from design changes to the instrument
flight procedures which are enabled by the nature of PBN. PBN incorporates area navigation, which
enables arbitrary flight paths not constrained to flying direct lines to or from ground-based navigation
aids as was previously the norm using conventional navigation systems. Procedure designers took
advantage of this flexibility to design shorter approaches at the airports served by PBN, creating a
marginal advantage for each flight using these PBN approaches6. This shortened flight path gives rise
to the reported benefits of reduced flight time: reduced fuel burn, other aircraft direct operating costs,
exhaust emissions, and passenger time.
The marginal gains for each flight on the instrument approach depend on the relative alignment
between the inbound flight path and the landing runway. Flights arriving directly toward the duty
runway fly “straight in”, and no benefit can be obtained. Flights arriving from the opposite direction
save twice by flying a shorter distance to their final turn, and then a shorter approach. The benefit of
PBN for shorter approaches therefore depends on the route and runway used and flight frequency
per route/runway pairing.
The scale of savings also depends on how much shorter the final approach is. The design “template”
used at most airports created approaches 2nm shorter than previous but, as discussed in the 2018
Acuo report, this differs at Auckland, Wellington, Christchurch, and Queenstown due to local details
including terrain and the opportunity to use tailored higher precision RNP AR procedures.
The net benefit of the shorter PBN flightpath depends on the accumulated marginal flight distance
advantage obtained by each flight, and therefore varies with the total volume of air traffic using each
instrument flight procedure. Net savings overall are simply the aggregate of the marginal gains for
each flight and rise or fall with the change in the total number of flights. Modelling the benefits
therefore needs to take into account the reduction in approach path length, and the route and
frequency of flights.
Saving = X
Saving = 2X
Saving = 0
X
Figure 12 PBN Approach Path Distance Reduction
3.1.1 Benefit Estimation
This analysis aims to estimate approximately the NSS programme benefits, by scaling the 2016
benefits model used in the 2018 Acuo report appropriately to account for changes in activity, cost
factors, and PBN implementation dates.
6
PBN design includes departures, enroute, arrivals and approaches. Track-shortening has been enabled for all
phases of flight; approaches provide the most obvious and measurable savings. Quantifying realised benefits for
other than approach phase of flight is challenging and resource intensive owing to the variety of off-route flying
that can occur due to interventions such as radar vectoring and weather avoidance.
18A finer time granularity is needed to adequately model the effect of the significant changes in activity
over short periods of time during 2020. To better capture the impact of short-term variability this
analysis uses a monthly granularity for rapidly changing factors, including aircraft movement numbers,
passenger numbers and fuel price. Relevant monthly data is available for the period covering the NSS
implementation phase (2015 onwards), making this technique applicable to the NSS programme as a
whole.
Estimating the benefits delivered by NSS by scaling the previous analysis is necessarily approximate.
The result depends on the degree to which the period being estimated diverges from the fixed aspects
of the 2016 model. The following description of the estimation method identifies where
approximations may occur.
As with the 2018 Acuo report, Auckland and Queenstown airports are omitted from this section of the
analysis, and treated separately.
Number of Arriving Flights
This analysis uses IFR movement data supplied by Airways which is believed to be accurate.
Flight Distance Saved
Flight distance saved is proportional to the number of flights. It is estimated by scaling the 2016 model
according to the number of flights in the estimation period.
In scaling the model year, the implied assumption is that the ratio of traffic between the various routes
in later years are sufficiently similar to make the scaling approach valid. Because benefits resulting
from flight path reduction are route dependent, this assumption is sensitive to a change in the ratio
of traffic volumes between the various routes serving each airport.
A sensitivity analysis shows that the approximation uncertainty resulting from this assumption is small.
Comparing Air New Zealand flight data for the 2018 and 2019 summer seasons (November through
February) with flight data for calendar year 2020 shows a maximum variation in flight distances saved
of between -5.1% and +3.8% at some airports in certain months due to change in the relative
frequency of flights on the routes serving the airport . However, the maximum variation coincides with
minimum traffic levels, when the flight schedule differed most from normal schedules. Weighted for
traffic volume, the net effect on annual accumulated benefits is to understate the benefits in 2020
(for Air New Zealand) by 0.75%. Because domestic IFR traffic is dominated by Air New Zealand, this
level of uncertainty is likely to be indicative of the accuracy of the method. Conservatively, a 1% margin
of error could be assumed.
Flight Time Saved
Flight time saved is proportional to the number of flights, and the speed of each aircraft. It is estimated
by scaling the 2016 model according to the number of flights in the estimation period.
The quality of this estimate depends on the mix of aircraft types on each route being substantially
similar to that in 2016. From flight data supplied by Air New Zealand, it appears to be true for most
routes prior to 2020. The 2018 Acuo model used a standardised figure for aircraft speed in three broad
categories: heavy jet, medium jet (single aisle), and turboprop aircraft. Provided that services are not
substantially replaced by aircraft in a different category the approximation should be reasonable. The
speed difference between heavy and medium jet in the 2018 Acuo model is 8%, however the
difference between turboprop and jet is 2:1. There is no evidence of a large-scale change from
turboprop to jet services. Substituting larger aircraft on Christchurch-Auckland services occurred to
19some degree during the early part of the Covid-19 pandemic, however these too occurred at low
traffic periods. The resulting modelling error at an annual scale is also modest.
Fuel Saved
Fuel saved is a function of the flight time saved, the fuel consumption rate of each aircraft, and the
number of flights. It is estimated by scaling the 2016 model according to the number of flights in the
estimation period.
The quality of this estimate depends on how similar the fleet in the period being modelled is compared
with 2016. This is a function of the fleet mix using the routes/runways and the comments on
approximations for “flight time saved” apply. The fuel flow difference between the aircraft categories
is typically 4:1. For example, the use of larger jet aircraft on domestic routes during winter 2020 will
mean that the scaled model will under-state fuel consumption, and therefore under-state the savings
benefits.
Value of Fuel Saved
This benefit is estimated by multiplying the fuel saved by the fuel price at the time. The model uses
monthly fuel price in NZ$ illustrated in Figure 11.
The estimate is approximate to the extent that airline fuel price hedging and supplier prices make the
airline’s fuel cost differ from the model. The outcome is expected to be closer to actual than the use
of a fixed global weighted average price.
ADOC Saved
This benefit is a function of aircraft time in use, and varies with flight time saved. This estimate scales
the 2016 model by the number of flights, the same scaling factor used for flight time saved.
The value of this benefit is affected the cost of crew, maintenance and insurance as outlined in the
2018 Acuo report. This report inflates ADOC annually using the producer input price index from
Statistics NZ.
Number of Passengers
The number of passengers is estimated by scaling the average passenger load for domestic and
international flights. The percentage change is calibrated at a reference airport and applied to the
2016 model estimates for each airport in the same time period.
The passenger load factor in this analysis has been calibrated using reported flight numbers and
passenger throughput at Auckland International Airport. This calibration is done at monthly
granularity to capture the highly variable load factors throughout 2020 in particular. However,
because passenger data is available for the entire period being considered, the method has been
applied throughout.
As the 2016 model already contains the differences between airports in 2016, applying the same
percentage change to each is expected to reasonably approximate the monthly passenger numbers
for each location, provided that the relativity between airports remains similar, and the passenger
load factors for aircraft at that airport vary in a similar way at all of the airports in the study.
Although counter intuitive, given the apparent variability in aviation and the rapidly changing
circumstances in 2020, this expectation may be realistic, particularly for the domestic fleet, as the
20model covers the main airports of New Zealand (essentially a closed network) and the passengers
departing one are the arrivals at another. A sample check shows that the model prediction for
passenger numbers at Wellington International Airport are reasonably consistent with published
figures, varying from the published figures for 2020 by 0.9%, and in 2016 by 2.2%.
Passenger Time Saved
The benefit of passenger time saved is estimated by multiplying the passenger load by the flight time
saved. This figure is therefore subject to the same uncertainty as described for flight time saved.
Value of Passenger Time
This benefit is estimated by multiplying passenger time saved with the value of passenger time.
PBN Implementation dates
This analysis includes benefits at a destination from the completion date of the PBN approach
implementation onwards. Start dates for benefit realisation have been revised from those used in the
Acuo report for Christchurch and Wellington airports because the benefits of shorter approaches
could be realised at these airports from the time that PBN ‘RNAV’ approaches were implemented (on
the dates in Table 2), whereas the Acuo report used later dates when ‘RNP AR’ approaches were also
implemented. In net present value terms, revising the Acuo estimates for the new dates adds around
$1.2m in fuel savings and $2.5m ADOC savings over the period 2015-2019.
3.1.2 Quantified Benefits
Using the above method of approximating the benefits from PBN, for the airports included in the 2018
Acuo study, produces the following result for the period from 2015-20207.
The benefits estimated in this report are consistent with the adjusted Acuo estimates. The fuel cost
and ADOC savings estimated in this study for the years 2016 through 2019 are within +4%/-4.3% of
the revised Acuo estimates. Overall, the estimates in this report, based on actual traffic volumes, are
6.7% lower than the adjusted Acuo estimates which are based on an assumed steady 5% annual
increase in traffic relative to 2016 traffic volumes. As noted previously, actual traffic growth has been
lower than was assumed.
Year Arrivals Average Total Flight Flight Time Fuel Saved Fuel Saved CO2 Saved ADOC Saved Passenger Value of
using PBN Flight Distance Saved (kg) (NZD) (kg) (NZD) Time Saved Passenger
Distance Saved (nm) (mins) (hours) Time Saved
Saved (nm) (NZD)
2015 56,400 2.49 141,000 28,800 442,000 256,000 1,390,000 617,000 33,800 519,000
2016 102,000 2.67 274,000 55,000 888,000 420,000 2,800,000 1,240,000 69,400 1,070,000
2017 115,000 2.54 291,000 59,400 936,000 542,000 2,950,000 1,370,000 74,200 1,140,000
2018 129,000 2.39 308,000 64,200 983,000 755,000 3,100,000 1,510,000 79,300 1,220,000
2019 130,000 2.38 310,000 64,700 990,000 742,000 3,120,000 1,530,000 80,700 1,240,000
2020 89,100 2.31 206,000 44,200 639,000 324,000 2,010,000 999,000 35,900 552,000
Total 622,000 2.46 1,530,000 316,000 4,880,000 3,040,000 15,400,000 7,260,000 373,000 5,740,000
Table 4 Approximate PBN Benefits Delivered 2015-2020
7
Note that totals may not equal the sum of the column due to rounding. The figures are shown to 3 significant
digits, acknowledging the approximate nature of this analysis.
21Comparing 2019 and 2020 directly illustrates the impact of the pandemic on NSS programme benefits.
Year Arrivals Average Total Flight Flight Time Fuel Saved Fuel Saved CO2 Saved ADOC Saved Passenger Value of
using PBN Flight Distance Saved (kg) (NZD) (kg) (NZD) Time Saved Passenger
Distance Saved (nm) (mins) (hours) Time Saved
Saved (nm) (NZD)
2019 130,000 2.38 310,000 64,700 990,000 742,000 3,120,000 1,530,000 80,700 1,240,000
2020 89,100 2.31 206,000 44,200 639,000 324,000 2,010,000 999,000 35,900 552,000
Difference -41,100 2.35 -105,000 -20,500 -351,000 -418,000 -1,110,000 -534,000 -44,800 -688,000
-31.6% -33.7% -31.7% -35.4% -56.3% -35.4% -34.8% -55.5% -55.5%
Table 5 The Effect of Covid-19 on NSS PBN Benefits
The pandemic occupied much of 2020. Provided that New Zealand can manage the virus, 2020 may
represent the worst case of the pandemic impact. The reduction in annual flight-related benefits is
approximately 35%, passenger benefits reduce by 56% (due to lower passenger load factors) and the
fuel cost saving benefit is 56% lower due to the lower price of fuel. As previously mentioned, the fuel
price figures have higher uncertainty due to purchasing effects not able to be taken into account, such
as hedging, buying and pricing practices for New Zealand operators.
Difference between
Approximate impact of Covid-19 in 2020
2019 and 2020
Non-fuel aircraft related benefits -35%
Passenger benefits -56%
Fuel cost benefit -56%
Table 6 Approximate Impact of Covid-19 on Benefit Realisation in 2020
These results are proportional to the downturn in traffic volumes. Compared with 2019, domestic
movement numbers reduced by 32%, and international by 62%. That the benefits reduced by
approximately the reduction in domestic traffic is consistent with the findings in the Acuo report that
the majority of benefits accrue to domestic operations, and the fact that international traffic in normal
years is just 16% of the total (9.4% in 2020).
The last observation illustrates the paradox created when assessing NSS programme benefits. These
benefits are marginal improvements to an operation. The reduction in benefits in fuel, emissions, and
costs do not represent a loss of value, but have reduced because the very same costs, fuel burn, and
emissions were not being incurred due to a reduction in aviation activity. Each flight continues to
receive the same benefit enabled by PBN.
In summary, the benefits of PBN continue to be realised for applicable flights using the system, making
the benefit realisation resilient and sustained.
224 Future Scenarios for NSS Benefits
This chapter describes the potential for other as yet unrealised benefits of PBN and the NSS
deliverables, and the effect on benefit realisation of foreseeable operating scenarios during the
recovery from Covid-19.
4.1 Airport Accessibility and Resilience
The Kaikoura Earthquake demonstrated the value of airport accessibility for Search and Rescue,
Medivac, and general air transport operations to support a community affected by a natural disaster
which disrupted normal ground transport supply lines. It is reasonable to suppose that these air
services also have value in normal times.
The resilience of these services in a variety of weathers depended on the existence of Instrument flight
procedures (IFP) enabling approach and departure from Kaikoura to continue in instrument
meteorological conditions. The IFP might be thought of as the aeronautical version of an all-weather
road to the airport.
PBN procedures deliver this benefit with more flexible options for flight path routing than
conventional IFP, and more promptly and affordably as they need not depend on installing any
ground-based navigation aid. The relative simplicity and affordability of implementing new PBN IFP
presents the opportunity to improve the resilience and accessibility of regional and community
airports which may not previously have considered IFP to be economically viable.
Developing IFP access to regional and community airports may require the current funding model to
be reconsidered. Although PBN navigation infrastructure has been implemented by Airways at most
airports with an air traffic control service, funded from Airways revenue, few other airports have PBN
IFP. However, an air traffic control service is not essential at low traffic airports. For airports with low
levels of IFR traffic or little need for operational services from Airways, infrastructure investment is
unlikely to be justifiable for Airways, or recoverable from IFR charges. Alternative funding options may
need to be considered in these cases where the benefits of IFP for airport accessibility and community
resilience may be more social than directly economic and funding from local operators, airport
revenue, community rates, national infrastructure budgets or other alternatives might be considered
appropriate.
4.2 Foundation for Realising System-Wide Benefits
The infrastructure delivered by NSS lays a foundation for stakeholders to develop further
improvements to the aviation system effectiveness through the combined effects of the component
parts and collaborative operational initiatives.
PBN enables a more predictable trajectory for flights. In turn this could be used by airlines, ATC,
airports and ground-handlers at airport turn-rounds to optimise the timing and flow of air traffic
across the network. Section 5.3 below discusses the potential benefits of airport collaborative decision
making (A-CDM). Following that, future integration between A-CDM and the existing air traffic flow
management (ATFM) can be anticipated to deliver yet more benefits in flight efficiency and on time
performance – improving environmental and financial performance as well as passenger experience.
Current work by CANSO the air traffic control industry trade association is developing guidance for
stakeholders when integrating the operation of A-CDM and ATFM and points to significant possible
benefits for users of the air traffic network8.
8
CANSO Guide on ATFM/A-CDM Integration, published in October 2020.
23You can also read