New Superintendents School Finance Update - August 2021
←
→
Page content transcription
If your browser does not render page correctly, please read the page content below
New Superintendents
School Finance Update

     August 2021
Overview

2
Division School Finance and Operations

  Chief Operating Officer - Jennifer Okes (okes_j@cde.state.co.us)
  School District Operations - Kate Barlett (bartlett_k@cde.state.co.us)
  • School Finance Program Manager - Coming Soon
  • School Finance - Tim Kahle (kahle_t@cde.state.co.us)
  • School Auditing - Rebecca McRee (mcree_r@cde.state.co.us)
  • School Transportation - Susan Miller (miller_s@cde.state.co.us)
  • Grants Fiscal Management - Jennifer Austin
    (austin_j@cde.state.co.us)
  • Fiscal Data Support - Yolanda Lucero (lucero_y@cde.state.co.us)
  • Fiscal Data Support - Kelly Wiedemer (wiedemer_k@cde.state.co.us)
  Capital Construction/BEST - Andy Stine (stine_a@cde.state.co.us)
  School Nutrition - Brehan Riley (riley_b@cde.state.co.us)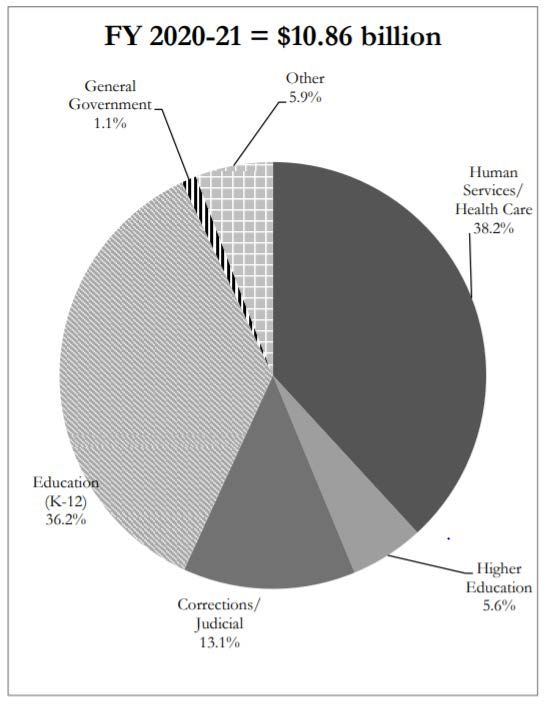
Primary Topics for Today’s Discussion

  ● Overview of Federal Funding
   ● Overview of State Funding
   ● Mill Levy Correction

  Plus lots and lots of details and reference materials are
  included below
Overview of
    Federal Funding

5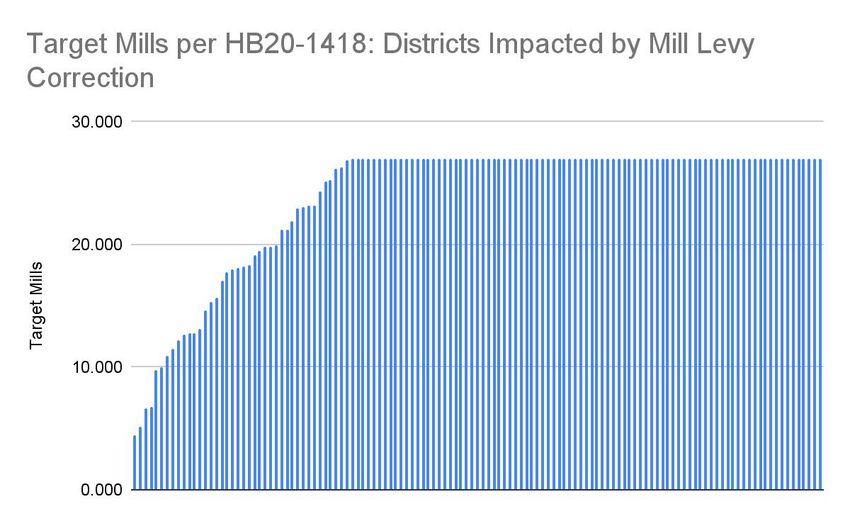
Total ESSER Funding

                                ESSER I               ESSER II                ESSER III
                              (CARES Act)            (CRRS Act)              (ARP Act)
                              March 2020            December 2020           March 2021

     Total State
                             $120,993,782           $519,324,311          $1,167,153,961
     Allocation
                             $108,894,404           $467,391,880          $1,050,438,565
                           $120.81 per pupil      $518.70 per pupil     $1,164.93 per pupil
     Allocation to LEAs
                          90% of total funding   90% of total funding   90% of total funding
                            Title I formula        Title I formula        Title I formula

                             $12,099,378            $51,932,431            $116,715,396
     State Reserve
                          10% of total funding   10% of total funding   10% of total funding

                              Through                Through                Through
     Funding Period
                            Sept. 30, 2022         Sept. 30, 2023         Sept. 30, 2024

 6
Additional Federal Money for Education

     Governor’s          Coronavirus       Emergency
     Emergency           Relief Funds     Assistance for
     Education          for Education      Non-Public
       Relief             (~$550M)          Schools
      (~$44M)                               (~$57M)

     Included in          Included in     Funding available
        the first            the first     for non-public
     stimulus bill        stimulus bill     schools in the
                                          second and third
                                            stimulus bills

 7
Additional Federal Money For Education

    Individuals with      Library Services          Funds to        Emergency
      Disabilities        and Technology             Support       Costs for Child
     Education Act             Funds                Homeless         Nutrition
        Funding               ($3.4M)           Children & Youth     Program
       ($41.5M)                                  ($7.6M+$4.3M)        ($9.9M)

                 Included in the third stimulus bill               Included in
                                                                    a separate
                                                                   stimulus bill

8
ESSER Funding Directly to Districts

           ESSER I:                          ESSER II:                       ESSER III:
           ~$109M                             ~$467M                           ~$1B
         90% Allocation                    90% Allocation                  90% Allocation

 ● Applications due December          ● Applications due September     ● Initial applications due May
   31, 2020                             30, 2021                         23, 2021
 ● Funds must be spent by             ● Funds must be spent by         ● Final application due March
   September 30, 2022                   September 30, 2023               24, 2022
                                                                       ● Funds must be spent by
                                                                         September 30, 2024

     Funds distributed to districts based upon Title I formula

     At least 20% of ESSER III funding must be used to address the learning impacts of COVID-19
     through interventions, summer programming, and after-school opportunities

 9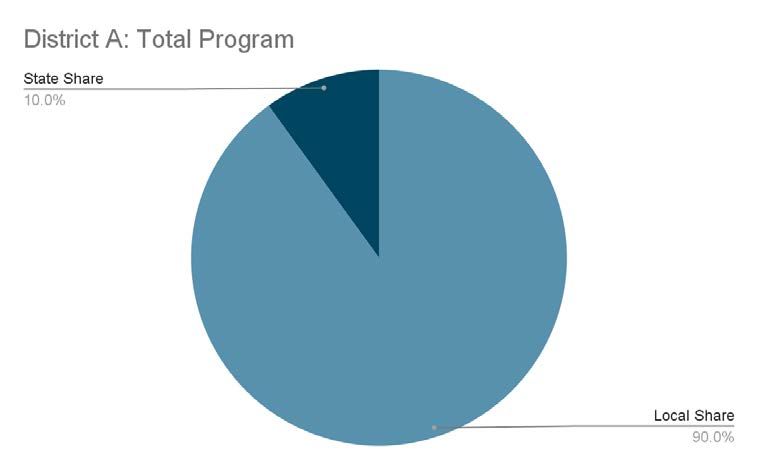
ESSER State Set Aside Funds

 Funding Gap Support            Provide Broadband         Statewide Capacity   Expand Learning
                                                               Building         Opportunities
       (~$3.2 M)                     (~$1.3 M)
                                                                (~$5 M)           (~$2 M)

                                         ESSER II: $49.3 Million
  Funding Gap Support
      (~$16.8 M)             Other Allowable Activities   Statewide Capacity   Expand Learning
                                                               Building         Opportunities
                                    (~$21.4 M)
                                                              (~$650K)           (~$10.5 M)

                                       ESSER III: $110.8 Million
     Evidenced-Based             Other Allowable               Summer          After School
Interventions for Learning          Activities               Programming       Programming
           Loss
        (~$58.3 M)                  (~$29.2 M)                (~$11.7 M)         (~$11.7 M)

 10
District Process Context 11
Allowable Uses of District ESSER Funding

                    ESSER I                                ESSER II                      ESSER III
          Addressing the impact of                  Same as ESSER I with           Same as ESSER I with a
        COVID-19 on schools, such as:                  emphasis on:               requirement to direct at
 ● Coordination with public health departments                                     least 20% of funding to
                                                    ● Addressing learning
                                                      loss
                                                                                     address the learning
 ● Purchasing educational technology                                                 impacts of COVID-19
 ● Planning for long term closures                  ● School facility repairs       through interventions
                                                      and improvements
 ● Training and supplies for sanitation
                                                    ● Other activities that are
 ● Mental health support                              necessary to maintain
 ● Summer school and afterschool programs             the operation of
                                                      schools
 ● Funds for principals to address local needs
 ● Other activities to continue school operations
   and employment of existing staff

All ESSER funds may be used for activities allowable under ESEA, IDEA, the Adult Education and Family
Literacy Act, the Perkins CTE Act, or the McKinney-Vento Homeless Assistance Act, in response to
COVID-19.

 12
Process
CDE contracted with Keystone Policy Group
to conduct a community input process
●Focus groups with parents, educators, students, community
organizations, school leaders, district administrators, educator
preparation programs and CDE staff
●Statewide survey
●Other input received, including a special listening session with
legislators
The process occurred during the month of July
13Feedback - Themes and Ideas 14
ESSER State Reserve Decision Making Process

 1    We recognize the once-in-a-generation opportunity to
      support our education system with these funds.

      We want to ensure we stop, think big and creatively,
 2    gather input, and use this funding to truly make a
      difference for our students in Colorado.

      Our top priority is to close the opportunity and
 3    achievement gaps that have been exacerbated by
      the pandemic.

 15
Proposed Criteria/Priorities
Addresses the needs Builds capacity Magnifies impact
of our students most for our state both in the by funding at the
impacted by the moment and longer-term state level, versus
pandemic and ● Includes evaluation to being funded by
historically inform potential long-term individual districts
adjustments to our
education system
Focuses the funding on fewer priorities to have a more significant impact
● Supports existing programs as opposed to creating brand new structures, when possible
Allowable use – specifically in response to COVID-19
16CDE Considerations For Allocations
Increase and support school workforce (teachers, tutors, substitutes, special service providers)
Recruitment and retention Professional development (social-emotional
learning, content acceleration/interventions,
community coordination)
Support academic acceleration (English language proficiency, math and literacy for impacted
populations, tutoring, summer school, afterschool)
Transparency, monitoring and learning through data, information and evaluation
Re-engagement for students through after-school, summer school, enrichment,
academic innovation, school climate and other supports
Community building within school and district communities, with
community partners and across districts
17Overview of
State Funding
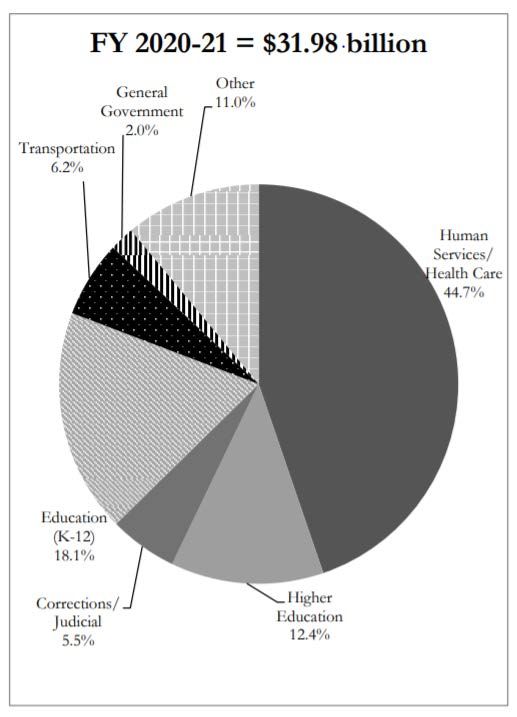
18What the State Budget Pays For – FY 2020-21
Total Funds General FundCDE’s Budget
By Fund Source By Type
20Total District Revenues and Expenditures
FY17-18 Total Revenue: $12.3 Billion
Local: 47%
State: 38%
Federal: 6%
Other: 9%
Most revenue to districts are provided through the School
Finance Act of 1994: $6.6 Billion or 54% of total revenues2021 Legislative Session
November 2021 Governor Submits Budget Request for 2022-23
THIS IS ONLY A PROPOSAL/PLACEHOLDER!
December 2021 Joint Budget Committee Hearings with Department
The JBC hears about the 2022-23 Budget Request from
the Department and seeks additional information
January 2022 Governor Submits Supplementals for 2021-22
Adjusts current year’s actual pupil counts, AVs, etc.,
Governor Submits Budget Amendments for 2022-23
Revises estimates for next year’s pupil counts, AVs, etc.
Spring 2022 JBC Develops State Budget Through Figure Setting
General Assembly Passes the Long Bill based on current law
Spring 2022 School Finance Bill Is Introduced and Passed
Adjusts the Appropriation included in the Long BillTimeline for School Finance Payments
• July-November: Projections
• Based on Legislative Council funding projections and will include
rescissions
• September-December: Student October Count data collection
• October 1 (on or about): Pupil Enrollment Count Date
• Mid-November: Duplicate Count Process
• Early December: Data Finalized/Upload Supporting Documentation
• December-January: “True Up”
• Pupil count and Assessed Valuations updated for the second half of the
year payments
• Rescissions updated
• February and Beyond: AuditTotal Program Funding Formula
Total Program Funding
Equals (funded pupil count
times per pupil funding formula)
plus at-risk funding (recently
changed)
plus multi-district online
plus extended high school funding
Budget Stabilization Factor is applied after total program
is calculatedFunded Pupil Count
Based on October pupil count
• Enrollment, Schedule, Attendance
Funded pupil count
• Greater of the current year’s pupil count OR
• Best average over the last two to five years
Full-time vs. part-time students
• Full-Time = 1.0
• Part-Time = 0.5HB 21-268: Changes to School Finance Formula
• English Language Learners: Adds new factor for
qualified English language learners - replaces
ELPA Professional Development and Student
Support Services
• Students Eligible for Reduced-Priced Lunch:
Added to students eligible for at-risk funding
(students eligible for free lunch)
26Factors that adjust base per pupil funding
Per Pupil Funding Formula adjusts for:
• Cost of living: Determined by a legislative study every two years. A
higher cost of living equals a higher factor.
• Personnel and non-personnel costs: Personnel costs factor vary by
school district based on enrollment. For all districts, employee
salaries and benefits represent the largest single expense. As such,
the formula directs funding based on these costs.
• Size of district: Similar to the personnel costs factor, the size factor is
unique to each district and is determined using enrollment. Small
districts have larger size factors than districts with higher enrollment.Local Share Funding Sources
Local Funding Statewide –39% in FY19-20
• Property Taxes – mill levies
• Specific Ownership Taxes – vehicle registration fees
State Share Statewide– 61% in FY19-20
• Funding from the state provided to each school district whose
Local Share is insufficient to fully fund its Total Program
The percentage split in specific districts varies
Previously, local share was 56% and state share
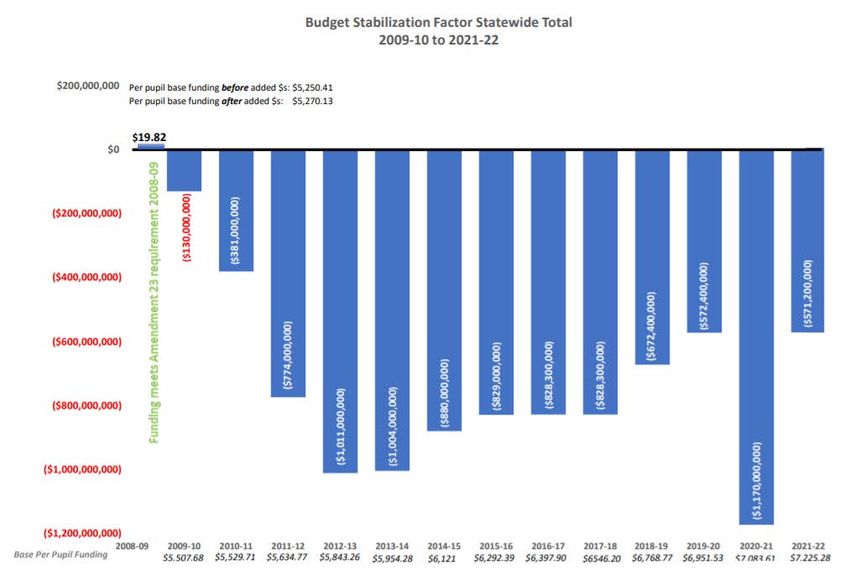
was 44%School Finance Historical Recap
2016-17
• Budget Stabilization Factor = $828.3M
• Average Per Pupil Funding = $7,420
• Total Program = $6.37B
2017-18
• Budget Stabilization Factor = $822.4M (-$5.9M)
• Average Per Pupil Funding = $7,662 (+$242)
• Total Program = $6.63B (+$250M)
2018-19
• Budget Stabilization Factor = $672.4M (-$150M)
• Average Per Pupil Funding = $8,137 (+$475)
• Total Program = $7.08B (+$450M)
29School Finance Historical Recap
2019-20
• Budget Stabilization Factor = $572.4M (-$100M)
• Average Per Pupil Funding = $8,489 (+$352)
• Total Program = $7.6B (+$520M)
2020-21
• Budget Stabilization Factor = $1.052B ()
• Average Per Pupil Funding = $8,123 ()
• Total Program = $7.24B ()
2020-21
• Budget Stabilization Factor = $571.2M (=$480.8M)
• Average Per Pupil Funding = $8,991 (+867)
• Total Program = $7.99B (+750.8M)
30Categorical Program Revenues
Funding provided for specific programs that serve
particular groups of students or student needs
State and federal revenues only covers a portion of the
full cost of these programs
• English Language Proficiency Act (ELPA) ~ 21% of costs covered
• Gifted and Talented Education ~ 34% of costs covered
• Special Education ~ 37% of costs covered
• Transportation ~ 24% of costs covered
• Vocational Education ~ 30% of costs covered
• Small Attendance Centers
• Expelled and At-Risk Student Services
• Comprehensive HealthMill Levy Correction 32
Summary

… school districts in Colorado, based on an interpretation of statute by CDE, began
collecting less local property tax for education than their voters had authorized, in
some cases for years. How this came to pass is a complicated story that we will try
to tell succinctly. Mill Levy Correction is a legislative and legal directive to fix this
undercollection of local property taxes for education.
33
Terminology

 ● Mill: One mill is equal to one tenth of one penny or one 1/1000 of a dollar. Mills are
   used to calculate property taxes using a formula of mills x assessed property value =
   property tax. The assessed property value is the actual property value x the
   assessment rate. Currently, the residential assessment rate in Colorado is 7.15%.
    ○ If you live in an area where the total mills levied on all homes is 27 mills, and
        the assessed property value of your $200,000 home is $14,300 (7.15%), your
        property tax is .027 x $14,300 = $386.

                            Residential     Assessed                            Property
                                                                Mill
                            Assessment      Property
                       X
                               Rate:
                                        =
                                              Value:
                                                         X     Levy:     =     Tax Bill for
                                                               .027
                              7.15%          $14,300                           Education:
       $200,000                                                                   $386
 ● Total Program Mill Levy: The mill levy is the total number of mills the school district
   collects from local property taxpayers to fund the local share of Total Program.
34
Terminology
Assessed Valuation (AV): The taxable portion of property value in the school
district. As an index of property wealth, AV varies significantly between districts
and can vary a lot from year to year (particularly for oil and gas districts).
Total Program: Refers to the total amount required by the formula to fund the
school district on an annual basis. Typically has two portions: local share
(property taxes) and state share (state funds appropriated by the Legislature).
Some districts can fully fund Total Program with only local share (property
taxes).
○ Districts have different ratios of local to state share in their Total Program.
Some are totally funded by local share; others receive most revenue from
state share. The ratio depends on multiple factors, including the district’s
Assessed Valuation.
○ Districts may have Mill Levy Overrides and/or bonds that allow them to
collect property taxes above and beyond the amount required for Total
Program.
35Example
District A includes a large, active mine. District B is a district without a lot of
The district’s Assessed Valuation is very industry. The district’s Assessed
high. Valuation is very low.
The district funds the
local share by
levying the mills
determined by CDE
and required by
statute.
The size of the pie is fixed per the school finance formula. The size of the slices
is dependent on local factors.
36Background: How did we get here?
● In the 1990s and 2000s, many school districts obtained voter approval to
retain and spend revenue in excess of the property tax revenue limitation
imposed on the district by TABOR.
○ You may hear this referred to as “de-Brucing” or “de-TABORing”
● Districts that de-TABORed had permission from the voters to keep their
local property tax mill levies (their local share) at the level in place at the
time of the de-TABOR vote.
● Without de-TABORing, districts would not have been able to retain
revenues above their TABOR limitation due to interactions of various
factors unique to Colorado.
○ Rapid and significant growth in residential property value;
○ TABOR, which prevents taxes from increasing without voter approval;
○ And Gallagher, which has driven the residential assessment rate down
in order to preserve the required ratio of residential/commercial
property tax rates.
37Background: How did we get here? 38
Background: How did we get here?

● CDE interpreted the statute such that some de-TABORed districts should
  reduce their local share through 2007.
   ○ However, because de-TABORed districts had permission from the
       voters to keep their mill levies at a higher level, it is now clear that
       local share should not have been reduced.
● In 2007, school district mills were frozen through legislation, then litigated
  in a debate about how local school districts should have treated their local
  mills per statute.
● Because of the reduction to mill levies made between the early
  1990s and 2007, the local share collected by those districts went
  down, and state share went up.

 39
Background: How did we get here?
De-TABOR vote
gave district
permission to keep
mill levy here
Year of de-
TABOR Gap in property
vote tax collections
that was then
District followed covered by state
“normal” mill levy share
ratchet down due to
interaction of factors 2007 “freeze” of
in the state mill levies
Constitution.
40Background: How did we get here? ● Beginning in 2008-2009 with the Great Recession, the state’s budget was under increasing pressure. As state share went up, and the economy went through ups and downs, the state was forced to implement the Budget Stabilization Factor. 41
Background: How do we fix it?

 ● The legislature has now taken steps to restore, going forward, the
   local share that was erroneously reduced.
    ○ This created a reduction in local share and resulted in the non-
       collection of local property taxes that were already authorized
       by voters.
    ○ The legislature is only seeking to fix this issue going forward--it is
       NOT seeking to recover local tax property revenue that should
       have been collected in the past.
 ● Mill Levy Correction is a state law. While the responsibility for
   setting the mill levy lies with the local school board, the local school
   board must set the Total Program levy in accordance with state law.

 42
Background: How do we fix it?
Step 1: Passage of HB20-1418
June 2020: HB20-1418 signed (see Section 33). The 2020-2021 School Finance
Act required districts to levy the number of mills specified by the requirements
in the bill, including the establishment of temporary tax credits, if necessary, to
correct historical errors. The bill required districts to set a mill levy target equal
to the lowest of:
1. The mills required to fully fund the district with local property taxes;
2. The mills in place at the time the district obtained voter approval to
retain and spend revenue in excess of the property tax revenue
limitation imposed on the district by TABOR (de-Bruce); or
3. 27.000 mills.
43Background: How do we fix it?
86 out of 127
districts (68%) have
target mills of 27.
This means that the
mills required to
fully fund the
district, and the
mills in place at the
time of deTABOR,
are both greater
than 27.
41 out of 127 districts (32%) have target mills under 27. This means that
either the mills required to fully fund the district, or the mills in place at the
44 time of deTABOR, are less than 27.Background: How do we fix it? Step 2: District certification of Temporary Tax Credits December 2020: If required, districts included temporary tax credits when certifying property tax mills related to the local share of total program for the 2020 tax year. The temporary tax credits were equal to the difference between the district’s current total program mill and the mill levy target established by HB20-1418. For example, if the district’s current total program mill was 25, and its mill levy target is 27, the district implemented a temporary tax credit of 2 mills. 45
Background: How do we fix it?

Step 3: Introduction, challenge to, and passage of HB21-1164
March 2021: HB21-1164 introduced. The bill requires CDE to implement a
correction plan for districts with temporary tax credits. Specifically, the plan
must ensure that districts incrementally reduce temporary tax credits “as
quickly as possible but by no more than one mill each property tax year,”
beginning in the 2021 tax year.

May 2021: Colorado Supreme Court ruled in an interrogatory that HB21-1164 is
constitutional.

June 2021: HB21-1164 signed into law.

 46
Next Steps: What happens now?

 ● HB21-1164 requires CDE to implement a correction plan that:
      ○ Reduces a district’s temporary tax credits “as quickly as
        possible,”
      ○ But by no more than 1 mill per year.
For Example:
District A has a mill levy target of 27 mills based on the requirements of HB20-
1418. In 2020, it was levying 25.0 mills. Taxpayers in District A will see the
following changes in their property taxes for the local share of Total Program:

2020 Tax Year (certified December 2020):     25.0 mills, 2 temporary tax credits
2021 Tax Year (certified December 2021):     26.0 mills, 1 temporary tax credit
2022 Tax Year and beyond:                                      27.0 mills

 47
Background: How do we fix it?
Tax credits range
from .048 to
18.480.
This means that
districts will be
implementing Mill
Levy Correction
for anywhere from
1 to 19 years.
107 out of 127 districts (82%) have fewer than 10 temporary tax credits
Find your district’s temporary tax credits here.
48Next Steps: What happens now?
● How much more will this cost a generic taxpayer each year?
2020
Residential Assessed
Mill School
Assessment Property
X = X Levy: = Property
Rate: Value:
.015 Tax Bill:
7.15% $42,900
$643.50
$600,000
One year later, when one tax credit has been implemented, the homeowner will pay $42.90 per
year more in property taxes from mill levy correction, assuming a static residential assessment rate
and static assessed property value:
2022
Residential Assessed
Mill School
Assessment Property
X = X Levy: = Property
Rate: Value:
.016 Tax Bill:
7.15%* $42,900
$686.40
$600,000
49
Note that this impact will vary depending on factors in your district.Next Steps: What happens now?
What happens if a district does not implement Mill Levy
Correction, despite being required to by law?
“If a district does not certify at least the mill levy required by
subsection (2) OR (2.1) of this section, the department shall
determine what the state's percentage share of the district's total
program would have been had the district certified the required mill
levy. The department of education shall reduce the district's state aid
in an amount that will result in the state's percentage share of the
district's total program remaining the same as if the district had
certified the required mill levy.” - from HB20-1418
50Next Steps: What happens now?
● Where will the money go?
○ The estimate for the 2021-2022 school year is that Mill Levy
Correction will generate ~$90M in additional local share
○ These are funds that won’t need to be paid from state sources
○ Therefore, the funds may be redirected, for example to the new
factor changes in the finance formula:
“...THE GENERAL ASSEMBLY FURTHER DECLARES THAT THE REMAINING
COSTS OF THE SCHOOL FINANCE FORMULA CHANGES ARE OFFSET BY THE
SAVINGS TO THE STATE SHARE OF TOTAL PROGRAM THAT OCCUR AS A
RESULT OF CORRECTING THE UNAUTHORIZED REDUCTIONS IN DISTRICT
PROPERTY TAX MILL LEVIES AS PROVIDED IN SECTION 22-54-106 (2.1).”
● Ultimately, use of these state funds is the legislature’s decision.
51Next Steps: What happens now?
● How much might Mill Levy Correction raise in additional
property taxes over time?
The following chart provides an estimate of the impact of Mill
Levy Correction on property tax collection, all else being equal.*
*Note: the estimates above assume static Assessed Valuations and assessment rates.
52Next Steps: What happens now?
What do districts need to do?
Review and organize documentation:
● Find the documentation used to support the mills the district levied in 2020, including any temporary tax
credits. This supporting documentation may include previous district audits; information from the local
county about the mills in place at the time the district obtained voter approval to retain and spend revenue
in excess of the property tax revenue limitation imposed on the district by TABOR; and / or other district
records.
● Questions or concerns? Reach out to Tim Kahle at CDE: kahle_t@cde.state.co.us. CDE will do everything
possible to assist you with confirming and documenting the correct mill levy for your district, if needed.
Provide a copy of documentation supporting temporary mill levy tax credits to CDE:
● CDE strongly recommends that districts share a copy of the supporting documentation referenced above
with the department.
● Please submit supporting documentation for any temporary tax credits established in 2020 by emailing it to
schoolfinance@cde.state.co.us, as soon as possible, but not later than October 15, 2021.
Communicate with stakeholders:
● Start with informing your local Board of Education and your County Assessor--use this presentation if
helpful
●
53 Access CDE-provided communications resources to communicate with broader stakeholdersSupport: What support is available?
● Consultation
CDE School Finance is offering technical assistance to districts in the form of webinars
and individual district consultations. To request technical assistance with mill levy
correction, please reach out to Kate Bartlett (bartlett_k@cde.state.co.us) or Tim Kahle
(kahle_t@cde.state.co.us) at CDE.
● Communications resources in development
○ CDE press release - early September
○ One pager
○ FAQs
○ Sample letter for districts to use
○ Slide deck for districts to use
○ Talking points for County Assessors and Treasurers
54Review: Main takeaways ● Mill Levy Correction is a legislative and legal directive to correct a historical undercollection of local property taxes. ● The historical undercollection resulted in districts collecting less in property taxes for education than their voters had approved by de-TABORing. ● Mill Levy Correction is in law, dictated by state statute; it is not a local decision to raise property taxes. ● Mill Levy Correction is a phased approach to restoring local property taxes to the levels voters authorized. ● Mill Levy Correction will result in local taxpayers increasing their taxes to previously approved levels, or to an appropriate level as defined by HB20-1418. ● There are no retroactive payments or penalties--the law only applies to future years. ● Funds generated through Mill Levy Correction will result in more fiscal resources overall being available for education. 55
Other Fiscal Topics

56
Accreditation Report

  • Required by 22-11-206 (4)(a)(I)&(II) C.R.S.
  • Provides assurances that the district is in compliance
    with Article 44: Budget Policies and Procedures and
    Article 45: Accounting and Reporting
  • Signed by Superintendent, Board President, and CFO
  • Submitted with Annual Financial Report (Audit)
  • Additional Information:
         http://www.cde.state.co.us/cdefinance/Accreditation.htm
Audit and Financial December
Local Government Audit Law - 29-1-601 et all C.R.S.
• Audits submitted to school board by November 30th
• Audits submitted to the State Auditor and CDE by December 30th
• Extensions may be requested to February 28th through the Office of the
State Auditor
Charter School Audits
• Each charter school or charter school network is required to provide a
separate independent gov’t audit
• Authorizers may require submission earlier than November 30th
• Charter schools are included as a component unit of the district
• Charter school audits are submitted to CDE with district’s auditAudit and Financial December
If audit is not submitted timely:
• District may be in violation of the accreditation contract
• State Auditor may authorize withholding of property taxes
• CDE may miss deadline for consolidated financial data:
• Federal funds would be withheld from the state and subsequently
districts
Audit must match Financial December data submission
• Optional Financial December Data Checklist
Additional Information:
http://www.cde.state.co.us/cdefinance/sfadministrate
http://www.cde.state.co.us/cdefinance/fpphandbookBudget & Appropriation
• Do not budget a deficit
• Submit proposed budget to BOE by June 1
• Adopt final budget and appropriation resolution by
June 30
• Resolution needed to use beginning fund balance
• Review and change budget any time before January 31
• After January 31, adopt supplemental appropriation to
spend additional funds
• Additional Information:
www.cde.state.co.us/cdefinance/sfbudgettrainingFinancial Transparency for Colorado Schools
House Bill 10-1036 Public School Financial Transparency
Act
House Bill 14-1292 required development of a financial
transparency website
• Translates expenditures for major categories into a format that is
readable by the layperson
• Designed to ensure the greatest degree of clarity and comparability by
laypersons of expenditures among school sites, school districts, and
BOCES
• FY15-16, FY16-17, FY17-18, FY 18-19 data available
https://coloradok12financialtransparency.comESSA Per-Pupil Expenditure Reporting
ESSA requires state report card to include:
the per-pupil expenditures of Federal, State, and local
funds, including actual personnel expenditures and actual
non-personnel expenditures of federal, state, and local
funds, disaggregated by source of funds, for each local
education agency and each school in the state for the
preceding fiscal year.
Colorado began reporting school level data for all school districts
for FY2017-18 on July 1, 2019 through Financial Transparency for
Colorado Schools website discussed aboveOther CDE Offices
Supporting District
Operations
63Capital Construction (BEST) Unit
• Grants are available for any school capital
improvement project with a focus on health, safety,
security, overcrowding, technology and others
• Statewide Facility Assessment
• Periodic site visits by CDE assessors to assess facility conditions and
suitability
• Additional Information:
http://www.cde.state.co.us/cdefinance/
capconstbestSchool Nutrition Unit
• Training and technical assistance is available for food
service departments
• Findings from Administrative Reviews
• Inadequate quantities of food (breakfast & lunch)
• Food Safety – health inspections
• Free and Reduced meal benefits incorrectly approved
• Foods sold a la carte not meeting nutritional standards (cafeteria,
vending machines, school stores, food fundraisers)
• Procurement Concerns
• Additional Information:
http://www.cde.state.co.us/nutrition/nutritrainingsGrants Fiscal Management Unit
• Ensures that state and federal grant funds are
administered in accordance with applicable state and
federal laws and regulations
• Determines local education agency (LEA) allocations
• Provides support and technical assistance to program
managers and grantees
• Additional Information:
http://www.cde.state.co.us/cdefisgrantSchool Auditing Unit
• Audits to ensure accuracy of school finance and
transportation funding
• Audits generally conducted every 1 to 2 years
• BEST practice is to upload documents in real time
• Transportation backup documents before finalizing CDE-40 in
August
• Pupil and at-risk documents after finalizing in November
• Additional Information:
http://www.cde.state.co.us/cdefinance/auditunit.htmSchool Transportation Update
• Regulations on school transportation vehicles and
operations and maintenance
• School Transportation Advisory Reviews (STAR) are
performed on a two-year rotating cycle:
• Fleet/Maintenance
• Operations/Training
• Federal Motor Carrier Safety Administration Rules
effective February 7, 2022 + State Rules In Progress
• Entry Level CDL Training
• Drug and Alcohol Clearinghouse
• Additional Information:
http://www.cde.state.co.us/transportationAdditional Reference
Materials
69Gallagher Amendment - 1982
Intended to set the ratio of property taxes raised from
both residential vs. business properties
• Split – 45% residential vs. 55% business – statewide
• Residential assessment rate – resets every two years potentially
• 7.15% for 2019 (SB19-255)
• 7.20% for 2018
• 7.96% from 2003 to 2017
• 21% in 1985
• Under TABOR, this rate cannot rise without a vote of the people
Has had the impact of lower property taxes contributing
to school funding Total ProgramTABOR Amendment - 1992 Sets limits on the amounts of revenues that can be collected and retained by state and local governments including schools districts Limits local property tax revenue growth Requires voter approval for an increase in mill levies, or assessment rates Most districts have received voter approval to retain excess revenues – the State has not
TABOR Amendment - 1992

  Between 1994 and 2006, school district mill levies were
  decreasing since assessed values were increasing at a
  rate greater than what TABOR allowed – inflation plus
  student growth

  This continued to cause the state portion of school
  funding to increase putting even greater pressure on the
  state budget

  Senate Bill 07-199 froze mill levies for districts at the
  2006-07 levels
     • Total program mill levies cannot go higher than 27 mills – some
       districts may have levies lower than this
A TABOR Simile
From Office of State Planning & Budgeting
TABOR Limit
General Fund
Income and
Sales taxes
Cash Funds
Fees TABOR RefundAmendment 23 - 2000
Requires base per pupil funding to increase by inflation
each year in addition to categorical funding
• Categorical funding is provided for programs such as exceptional
students, transportation and English language learners
An additional one percent was included for 10 years to
attempt to make up losses in funding in prior years
Creates additional pressures on the state budget with
these requirementsMarijuana Tax Revenue and Education
• Excise tax: beginning FY20-21, the lesser of the first $40 million or all of
the money collected in marijuana excise tax is credited to the state’s
Building Excellent Schools Today (BEST) program
• Sales tax: 10% of the revenue from the 15% tax on marijuana retail sales
is allocated to local governments. The remaining 90 percent is credited
to the Marijuana Tax Cash Fund (MTCF), General Fund, and state public
school fund.
• The General Assembly makes appropriations from the MTCF through the Long Bill
or other bills
• In Fiscal Year 2017-18, CDE received almost $90.3 million, including school
construction, early literacy competitive grant program, school health professional
grant program, school bullying prevention and education grant program, drop-out
prevention programs and funding for the State Public School Fund. The overall state K-
12 education funding is $5.6 billion.
• Additional Information:
http://www.cde.state.co.us/communications/20160902marijuanarevenueYou can also read