NEW WORLD DOMINION ROAD RETAIL IMPACT ASEESSMENT - Project No: Date: Client
←
→
Page content transcription
If your browser does not render page correctly, please read the page content below

NEW WORLD DOMINION ROAD                              Project No:      51922

          RETAIL IMPACT ASEESSMENT                             Date:            March 2021

                                                               Client:          Foodstuffs North Island

W: www.propertyeconomics.co.nz E: tim@propertyeconomics.co.nz P: 09 479 9311 PO: Box 331640, Takapuna 0740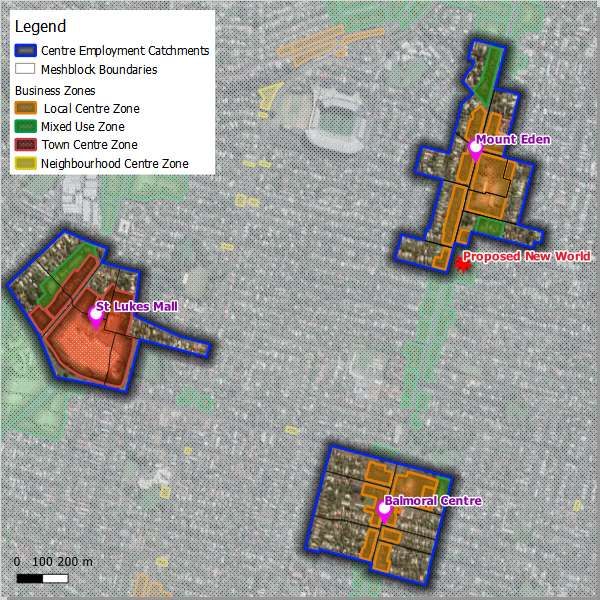
SCHEDULE

             Code          Date                  Information / Comments                  Project Leader

             51922.3       March 2021            Report                                  Tim Heath / Phil Osborne

             DISCLAIMER

             This document has been completed, and services rendered at the request of, and for the
             purposes of Foodstuffs North Island Limited only.

             Property Economics has taken every care to ensure the correctness and reliability of all the
             information, forecasts and opinions contained in this report. All data utilised in this report has
             been obtained by what Property Economics consider to be credible sources, and Property
             Economics has no reason to doubt its accuracy.

             Property Economics shall not be l                                                          sions
             made in reliance of any report by Property Economics. It is the responsibility of all parties acting
             on information contained in this report to make their own enquiries to verify correctness.

             COPYRIGHT

             © 2021 Property Economics Limited. All rights reserved.

             CONTACT DETAILS

             Tim Heath

             Mob: 021 557713

             Email: tim@propertyeconomics.co.nz

             Web: www.propertyeconomics.co.nz

W: www.propertyeconomics.co.nz
                                                                                                                    2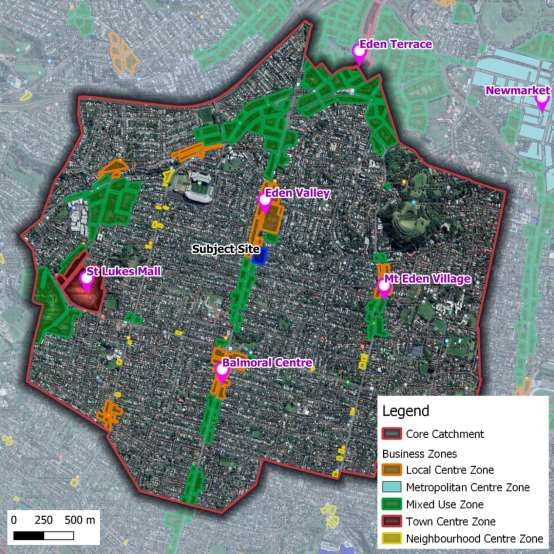
TABLE OF CONTENTS
                INTRODUCTION ................................................................................................... 5

                1.1. DEVELOPMENT OVERVIEW ............................................................................ 6

                1.2. KEY RESEARCH OBJECTIVES ......................................................................... 7

                1.3. INFORMATION & DATA SOURCES ................................................................... 8

                CORE ECONOMIC MARKET ..................................................................................... 9

                DEMOGRAPHIC PROFILE...................................................................................... 11

                POPULATION AND HOUSEHOLD PROJECTIONS ....................................................... 12

                SUPERMARKET EXPENDITURE & SUSTAINABLE GFA................................................ 14

                5.1. RETAIL EXPENDITURE MODEL ...................................................................... 14

                5.2. SUSTAINABLE GFA ..................................................................................... 15

                5.3. SUPERMARKET EXPENDITURE & SUSTAINABLE GFA ....................................... 16

                EXISTING SUPERMARKET SUPPLY ........................................................................ 18

                6.1. LAYERED RETAIL CATCHMENTS ................................................................... 19

                6.2. SUPERMARKET SUPPLY AND DEMAND ........................................................... 20

                SUPERMARKET SUPPLY AND DEMAND DIFFERENTIAL.............................................. 21

                CENTRE COMPOSITION ....................................................................................... 22

                TRADE COMPETITION VS DISTRIBUTION EFFECTS ................................................. 24

                POTENTIAL FOR RETAIL EFFECTS ON CENTRES ...................................................... 26

                OVERVIEW ........................................................................................................ 26

                POTENTIAL IMPACTS .......................................................................................... 26

           APPENDIX 1: DEMOGRAPHIC PROFILING ..................................................................... 28

           APPENDIX 2: FOOD RETAILING – ANZSIC06 ................................................................ 31

           APPENDIX 3: PROPERTY ECONOMICS RETAIL EXPENDITURE MODEL ............................... 33

           APPENDIX 4 – CENTRE EMPLOYMENT CATCHMENTS ...................................................... 39

W: www.propertyeconomics.co.nz
                                                                                                                                       3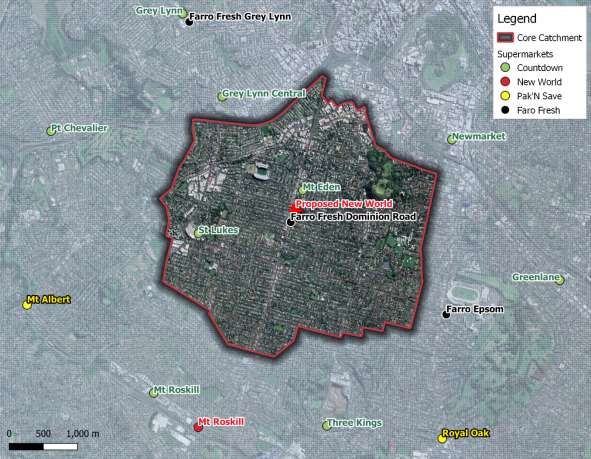
TABLE OF CONTENTS

           LIST OF TABLES

           Table 1: Supermarket Expenditure And Sustainable Gfa Forecasts .................................. 16

           Table 2: Core Catchment Supermarket Supply.............................................................. 20

           Table 3: 2019 Employment Breakdown For Mt Eden, Balmoral And St Lukes Centre’s ........ 22

           Table 4: Employment And Business Count Breakdown At Anzsic Level 2 (2019) ................ 23

           LIST OF FIGURES

           Figure 1: Proposed New World Mt Eden Core Catchment .................................................. 9

           Figure 2 Population Projections And Estimates For Primary Catchment ............................. 12

           Figure 3: Surrounding Supermarket Network................................................................ 18

           Figure 4: Core Catchment Supermarket Supply-Demand Differential ............................... 21

W: www.propertyeconomics.co.nz
                                                                                                                          4
51922.3

                     INTRODUCTION
           Property Economics has been engaged by Foodstuffs North Island Limited to undertake an
           economic assessment on the retail and economic implications of a proposed development
           containing a New World supermarket along Dominion Road, Auckland. While the development
           on the subject site is proposed to include a range of activities including, residential apartments,
           commercial office and retail, this report places a specific focus on the supermarket activity as all
           other activities are permitted under the Auckland Unitary Plan (AUP).

           As a Discretionary activity under the Business - Mixed Use Zone under which this site applies,
           the primary purpose of this report is to address the relevant areas of economic analysis required
           to inform the application and assist                          understanding of potential
           economic effects relevant to the assessment under the COVID-19 Recovery (Fast Track
           Consenting) Act 2020 (CRA). It addresses and provides a detailed understanding of key social
           and economic demographics, market dynamics, projected market growth and the influence
           and implications these factors are likely to have on the relevant retail markets and existing
           centre provision in the surrounding catchment.

           The economic analysis also provides an assessment of the proposed development in the context
           of the relevant Auckland Unitary Plan (AUP) provisions and evaluates whether any significant
           adverse retail distribution effects are likely to be created. Particular focus will be placed on the
           potential impacts on the existing centre network and the criteria for new supermarkets within
           Business Mixed-Use Zone land, outlined under Section H13 of the AUP. Relevant objectives,
           policies, matters of discretion and assessment criteria are outlined as follows:

W: www.propertyeconomics.co.nz
                                                                                                                  5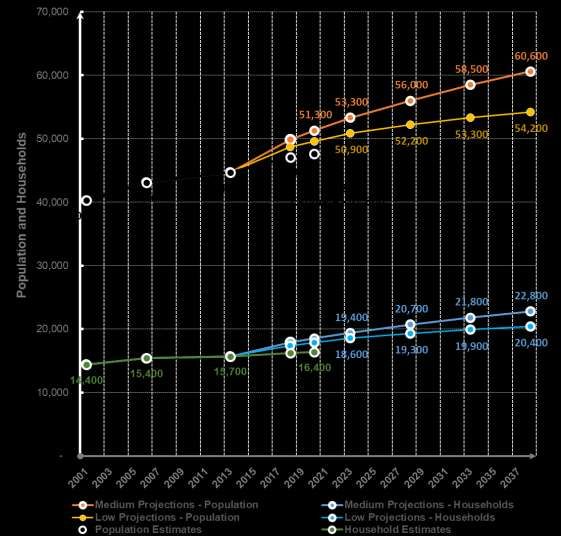
51922.3

           H13. Business    Mixed Use Zone

                     H13.2. Objectives

                             (4) Business activity is distributed in locations, and is of a scale and form, that:

                                       a) provides for the communities social and economic needs.

                             (6) Moderate to high intensity residential activities and employment
                             opportunities are provided for, in areas in close proximity to, or which can
                             support the City Centre Zone, Business Town Centre Zone and the public
                             transport network.

                             (7) Activities within the zone do not comprise the function, role and amenity of
                             the City Centre Zone, Business Metropolitan Centre Zone, Business Town
                             Centre Zone and Business Local Centre Zone.

                     H13.3. Policies

                             (1) Reinforce the function of the city centre, metropolitan centres and town
                             centres as the primary location for commercial activity, according to their role in
                             the hierarchy of centres.

                             (17) Provide for a range of commercial activities that will not compromise the
                             function, role and amenity of the City Centre Zone, Business Metropolitan
                             Centre Zone, Business Town Centre Zone and Business Local Centre Zone,
                             beyond those effects ordinarily associated with trade effects on trade
                             competitors.

           1.1.      DEVELOPMENT OVERVIEW

           Pudong Housing Development Limited and Foodstuffs (NZ) Limited have proposed a mixed-use
           development that will see the construction of a 2,787sqm New World supermarket, 347sqm of
           retail floorspace, 228sqm of commercial office activity and 122 residential units on a large site
           along Dominion Road between Grange Road and Prospect Terrace in Mt Eden.

           Dominion Road is a central arterial road leading into the City Centre that is a focal point for
           business activities, with Mixed-Use or Local Centre zoned across 4km travelling from Mt Roskill.
           Consequently, businesses along this road service not just the local market, but also the large
           volumes of passing traffic heading into or out of the City Centre.

           The site is located behind existing retail shops fronting Dominion Road that contains a variety of
           convenience food and beverage stores and commercial service activities. Although the site is
           zoned as Business Mixed Use, it is directly adjacent to the Eden Village Local Centre and would
           operate as an extension of the zone and centre.

W: www.propertyeconomics.co.nz
                                                                                                                    6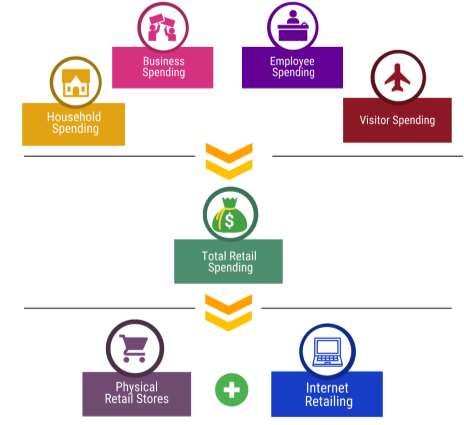
51922.3

           It is understood that the residential product on the subject site is targeted at Young
           Professionals who benefit from the high amenity and public transport access. While being
           introduced as an addition to an established market, the New World will serve to heighten the
           locational benefits for the residential apartments.

           The Proposal is described in detail in the Assessment of Environmental Effects and Architecture
           package prepared by Warren and Mahoney

           1.2.       KEY RESEARCH OBJECTIVES

           The main objectives of the research and analysis include:

           •      Core Trade Area: Delineate and map the geospatial extent of the
                  core retail economic market and the         location within the surrounding competitor
                  network from a localised (Mt Eden and wider surrounds) perspective.

           •      Population Growth: Quantify the current estimated population and household base of
                                         core economic market, and project this out to 2038 based on
                  Statistics New Zealand Medium and Low population projection series. The Low projection
                  series is utilised as the recent growth profile tracks below the low series due to lack of new
                  residential supply in the area.

           •      Demographic Profiling: Undertake profiling of the core economic market in terms of key
                  economic and social characteristics including age, income, employment, household
                  structure and ethnicity to identify and understand the composition of the market at a more
                  detailed level.

           •      Retail Demand: Calculate the level of retail expenditure generated within New World Mt
                         core economic market on an annualised basis in the relevant retail sectors
                  (supermarkets and convenience food & beverage sectors) and forecast this out to 2038.

           •      Sustainable GFA: Determine the amount of sustainable food retailing floorspace that can
                  be supported by the core market of the proposed supermarket out to 2038 in terms of GFA.

           •      Supermarket Supply: Identify the supermarkets within the surrounding core markets by
                  brand and size to determine current supermarket provision in the market.

           •      Retail Demand Supply Differential: Cross-reference existing supply with market demand
                  (current and future) and determine the additional GFA requirement in the market to meet
                  future demand on a timescale basis.

W: www.propertyeconomics.co.nz
                                                                                                                   7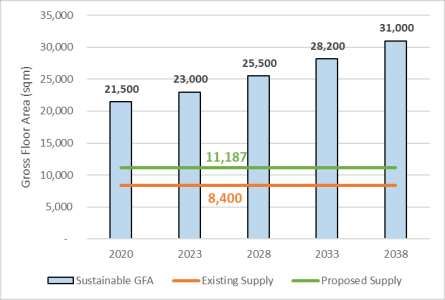
51922.3

           •      Centre Composition: Determine the business and employment breakdown of the St Lukes,
                  Mt Eden and Balmoral centres on a temporal basis (retail and non-retail) to better
                  understand their role and function in the market, general health of the centre, and its ability
                  to absorb any trade diversion effects.

           •      Centre Impacts Analysis: Determine the potential for significant adverse retail distribution
                  effects to be generated on the existing centres as a result of the proposed development,
                  within the context of the broader role and function these centres play in the market, the
                  AUP Mixed Use Zone and COVID-19 Recovery (Fast Track) Act 2020. This includes trade
                  competition vs retail distribution effects.

           1.3.       INFORMATION & DATA SOURCES

           Information has been obtained from a variety of reputable data sources and publications
           available to Property Economics, including:

                  •   Census of Population and Dwellings 2018 - Statistics NZ

                  •   Household and Population Projections Statistics NZ

                  •   Household Economic Survey - Statistics NZ

                  •   Retail Trade Survey - Statistics NZ

                  •   Catchment Map Google Maps

                  •   Employment Data Statistics NZ Business Frame

                  •   Centre Provision NZ Shopping Centre Directory

                  •   Planning Provisions Auckland Unitary Plan

                  •   Supermarket Supply Property Economics

                  •   Centre Visits Property Economics

W: www.propertyeconomics.co.nz
                                                                                                                    8
51922.3
CORE ECONOMIC MARKET
In order to estimate the retail development potential (or opportunity available) for the proposed
New World supermarket and assess its potential impacts, it is necessary to first identify its core
economic market. The core economic market or retail catchment is essentially the geographic
area from which the proposed supermarket is likely to derive the majority of its sales or the area
the store is designed to primarily service, and where the store is considered to have a strategic
locational advantage in terms of proximity over other supermarkets.
Figure 1 illustrates the geospatial extent of the proposed supermarket . This
has been based on the existing and proposed supermarket network, road network, natural and
physical geographical barriers and the professional opinion of Property Economics in known
shopping patterns and trade area dynamics for retail developments in New Zealand.
FIGURE 1: PROPOSED NEW WORLD MT EDEN CORE CATCHMENT
Source: Property Economics, Auckland Council
W: www.propertyeconomics.co.nz
951922.3
Figure 1 also shows the surrounding business zone network, highlighting how the subject site
fits into the business hierarchy. Although the subject site is within a Mixed Use Zone, it is
. Consequently, rather than being in
direct competition with the commercial centres, it is in some respects an extension of this zone.
Supermarkets generally draw from markets in close proximity to the store (surrounding suburbs)
given their inherent role within the market in providing essential day-to-day goods. As this is
not a large supermarket at only 2,787sqm in size, it is well-positioned to attract its local market
rather than trying to be a destination supermarket.
It is important to note however that this catchment is not unique and common to other
supermarkets currently operating within Mt Eden and the surrounding area that will compete
for the generated spend. Residents within this catchment will also shop in supermarkets
outside of the catchment and vice versa. In light of this, the catchment illustrated in Figure 1
represents the core economic market where the proposed New World likely to derive the
majority of its customers, sales and generate more frequent use.
This core retail catchment (the area highlighted with a red outline ) will be used as the basis for
the subsequent supermarket retail analysis.
W: www.propertyeconomics.co.nz
1051922.3
DEMOGRAPHIC PROFILE
An economic and social demographic profile for the core catchment has been complied in
comparison to the wider Auckland average. This is to determine where the market sits in terms
of demographic characteristics and general profile of where the bulk purchases are likely to be
derived.
A more detailed breakdown of the demographic profiles has been attached in Appendix 1.
Some of the salient findings from the demographic profiling include:
• The identified catchment has a current estimated population base of around 47,640
people and 16,360 households. This equates to a household size of 2.91 persons per
dwelling, lower than the wider Auckland region (3.09).
• The median annual household income of $110k in the Dominion Road catchment is
significantly higher than the regional average at $94k. In respect to the proportion of
household earnings over $150k p.a. the core catchment has 35%, compared to only 26%
of regional households.
• These differences in income levels between the catchment and Auckland region
average can be related to the difference in educational attainment. Within the
identified catchment approximately 50% of the working-age population have a
Bachelor s degree qualification or higher, compared to only 31% of the Region.
• On a similar note, the catchment has an unusually high proportion of residents aged
between 20 29 years, an age group that represents 22% of the population in the
catchment compared to 16% across the region. This represents the young professional
target market identified within the design documentation.
• There is a greater difference in the distribution of dwellings by the number of bedrooms
than there is with the average household size distribution. While the households in the
catchment are indeed smaller on average, this difference is marginal. However, 43% of
the dwellings have one or two bedrooms compared to only 27% across the Auckland
Region.
• Compared to the Auckland Region, the catchment has a significantly higher proportion
of residents identifying as European (56% compared to 47% in the region), and
conversely a smaller proportion of people identifying as Maori (6% vs 10%) or Pacifica
(6% vs 14%).
• Overall, the core catchment can be considered a younger, more qualified, higher
income market. Attributes that typically lead to higher discretionary spend potential
than the Auckland Regional average.
W: www.propertyeconomics.co.nz
1151922.3
POPULATION AND HOUSEHOLD PROJECTIONS
Figure 2 displays the population and household growth projections for the New World
Dominion Road catchment. These projections are derived from the latest available Statistics NZ
population growth projections for both the Medium and Low growth series.
As these projection series are yet to be updated to reflect the 2018 Census base, we make a
comparison between the current population estimates determined in the 2018 Census against
the growth that was anticipated.
FIGURE 2 POPULATION PROJECTIONS AND ESTIMATES FOR PRIMARY CATCHMENT
Source: Property Economics, Statistics New Zealand
Figure 2 shows that the estimated population in June 2020 of 47,600 falls short of both Statistics
Medium and Low population projections. Under the Medium projection, the
population within the Dominion Road catchment was expected to grow to 51,300 residents by
2020 and 60,600 by 2038 (an additional 9,300 over 18 years).
W: www.propertyeconomics.co.nz
1251922.3
However, as seen across many of the well-established urban areas in Auckland, a lack of infill
housing development (new residential supply) has led to more reserved population growth than
originally anticipated. In essence, recent growth rates are not a reflection of catchment
demand, but a reflection of a lack of new residential stock being developed in the area.
It is certainly possible that in the future, developments like the apartment complex proposed on
the subject site will bring additional residents into these established urban areas and thereby
meet this projected growth. However, future growth projections are likely to be more reserved
as the potential for infill development is reassessed.
Due to a lack of new homes being developed (relative to demand) and rising house prices, New
Zealand has seen an increase in multi-household and multi-generational dwellings. This is
reflected in the proportionally smaller increase in the household estimates compared to the rise
in population estimates.
Historically, the number of households under the projections series was forecast to increase at a
faster proportional rate than the population due to a projected fall in the person per household
ratio over the forecast period. This anticipated trend was not isolated to the identified
catchment but projected to occur across the whole country due to an ageing population,
However, the results of the 2018 NZ Census and subsequent population estimates have shown
that the reverse has been true. That is, that the population per household ratio has increased
slightly across the country with this catchment being no exception, increasing from 2.84 to 2.91
between 2013 and 2018. This demographic trend shift is likely to continue unless new housing
stock is enabled to be developed at a rate more commensurate with market demand.
W: www.propertyeconomics.co.nz
1351922.3
SUPERMARKET EXPENDITURE & SUSTAINABLE GFA
This section sets out the projected supermarket retail expenditure and sustainable retail GFA
(Gross Floor Area) for the proposed supermarket The forecasts have
been based on the medium population and household growth projections utilising the new
2020 base and have been prepared using Property Economi A
detailed breakdown of the model and its inputs are outlined in Appendix 3.
In this section, retail expenditure and floorspace analysis is focused on supermarket retailing, the
sector considered to be most relevant to this assessment. A more defined breakdown of the
Food Retailing Classification as defined by the ANZSIC1 is attached in Appendix 2.
5.1. RETAIL EXPENDITURE MODEL
The following flow chart provides a graphical representation of the Property Economics Retail
Growth Model to assist in better understanding the methodology and key inputs utilised.
1
Australia New Zealand Industry Classifications
W: www.propertyeconomics.co.nz
1451922.3
GROWTH IN REAL RETAIL EXPENDITURE
For the purposes of projecting retail expenditure, growth in real retail spend has been
incorporated into the model at a rate of 1% per annum over the forecast period. This 1% rate is
based on the level of debt retail spending, interest rates and changes in disposable income
levels, and is the average inflation adjusted increase in spend per household over the assessed
period.
5.2. SUSTAINABLE GFA
This assessment uses a sustainable footprint approach to assess retail demand. Sustainable
s retainable
retail expenditure that is likely to result in an appropriate quality and offer in the retail
environment. This does not necessarily represent the a financial
sales productivity ($/sqm) based on net (and GFA) retail floorspace that allows retail stores in
their respective sectors to trade profitably and provide a good quality retail environment, and
thus economic well-being and amenity.
Many stores may trade comfortably above or below the sustainable level as many do, but its
designed to provide an average lower level 'line in the sand' or minimum standard productivity
level to enable stores to not only trade but trade to a level that enables a reasonable level of
quality (stores, performance and environment).
Some stores trade below these levels, and in my experience, they are lower quality stores
comparatively in built form, fit out, performance and environment which affects the level of
amenity for shoppers, and are often stores not viable for an extended period of time.
It is necessary to separate the Gross Floor Area into:
• Net retail floorspace (Sustainable Floorspace); and
• Back office floorspace that does not generate any retail spend (Back Office Floorspace).
tail floor area (or retail trading area) only includes the area which displays the
goods and services sold and represents the area to which the general public has access. By
contrast, the Gross Floor Area typically represents the total floor area leased or developed by the
retailer. Back Office Floorspace in a retail store is the area used for storage, warehousing, staff
These activities typically occupy around 25- FA. It is important to separate out
such back office floorspace from sustainable floorspace because back office floorspace does not
generate any retail spend. For the purposes of this analysis an average 30% ratio has been
applied.
W: www.propertyeconomics.co.nz
1551922.3
5.3. SUPERMARKET EXPENDITURE & SUSTAINABLE GFA
Table 1 forecasts the total level of Food retailing expenditure generated by the core catchment
from 2020 2038, as well as the level of sustainable GFA that can be supported by the
generated spend within the core catchment on an annualised basis.
Table 1 indicates that around $188m of supermarket retail expenditure is currently generated
within the core catchment annually, with this forecast to increase to around $271m annually by
2038. This equates to a sustainable supermarket GFA provision of 21,500sqm currently,
increasing to 31,000 by 2038. This increase, approximately 9,500sqm in sustainable supermarket
demand, is equivalent to an additional 2-3 modern day full service supermarkets supported by
the spend generated within the identified catchment.
TABLE 1: SUPERMARKET EXPENDITURE AND SUSTAINABLE GFA FORECASTS
2020 2023 2028 2033 2038
Supermarket $188 $202 $223 $247 $271
Specialty Food Retailing $63 $67 $74 $82 $90
Total Food Retail Expenditure
$251 $269 $298 $329 $362
($m)
Supermarket 21,500 23,000 25,500 28,200 31,000
Specialty Food Retailing 10,500 11,300 12,500 13,800 15,200
Total Net Floorspace (sqm) 32,000 34,300 38,000 42,000 46,200
Source: Property Economics
Food retailing expenditure is split into supermarket and speciality stores (e.g. Butcher or Fruit
Grocery). For the purpose of this analysis, Property Economics have assessed 75% of total food
retailing expenditure as supermarket related food retail spend, which is the basis of the
reported figures.
-established / mature market splits spend
at a 3:1 ratio between supermarkets and speciality food retail stores respectively. This can vary
slightly depending on the number of speciality stores within a particular market but is
considered appropriate to adopt for this market.
However, the proposed supermarket is not restricted to 75% of the market, this is simply used as
a benchmark. It is still able to compete with other retailers in the area for the additional 25%. In
this case, there is currently an additional $63m of non-supermarket food related retail
expenditure annually within the core catchment, which is projected to rise to $90 by 2038.
Conversely, other retailers also have the ability to compete for the supermarket related spend.
W: www.propertyeconomics.co.nz
1651922.3
As is shown in Section 7, demand for supermarket retail currently significantly outweighs supply.
Property Economics is of the opinion that there is sufficient capacity so that if spend is to shift
away from the aforementioned 3:1 ratio, due to competition between retailers for example, the
market is unlikely to come to the point where a new supermarket is no longer viable. i.e. it is
unlikely that any discussed competition effects would cause the differential to close
significantly.
W: www.propertyeconomics.co.nz
1751922.3
EXISTING SUPERMARKET SUPPLY
In light of the generated supermarket spend calculated in the previous section, this section
identifies and makes a comparison with the supply against this sustainable floorspace.
Figure 3 shows the existing supermarket network, identifying other competing supermarkets
that would co-exist within the localised market.
FIGURE 3: SURROUNDING SUPERMARKET NETWORK
Source: Property Economics, Auckland Council
There are two within the Core Catchment, one 300m up Dominion Road from the
proposed New World site and another inside the St Lukes Mall. Given its position within the St
Lukes Mall, the latter has the ability to capture spend from a wider area, extending well outside
of the Core Catchment. Being located within a Mall, it is typically less convenient for the weekly
shopping trip than Supermarkets in local centres due to parking and higher traffic volumes.
Additional to this supermarket network is a Farro Fresh grocery store approximately 150m south
of the subject development along Dominion Road. Property Economics classifies Farro Fresh
stores (which are typically have a GFA less than 1000sqm) as Specialty Food Retailing. This retail
expenditure is also included in Table 1. Although these stores would compete for some of the
W: www.propertyeconomics.co.nz
1851922.3
same retail dollars and Farro Frash will likely face direct competition across some product types
from the proposed New World, this impact is minimised by the clear distinction in offer and
product range. Farro Fresh stores do not encompass the same extensive product range seen in
full-service supermarkets, particularly in personal and household product lines.
Outside of this Core Catchment, Property Economics have identified six different Countdowns, a
single New World and two supermarkets that may draw spend from the Core
Catchment to varying degrees.
As a point of note, the closest Supermarket to the proposed New World outside of the
Catchment is Grey Lynn Central at approximately 7-minute drive. Beyond this, Newmarket,
Three Kings and Mt Roskill are roughly 8 away.
Where the P in this instance are furthest away, these supermarkets are larger than
other brands and draw custom from a wider area. What it does highlight is that for those in the
southern section of the catchment, their supermarket options are further away than most.
6.1. LAYERED RETAIL CATCHMENTS
It is important to note that the retail expenditure generated in the identified catchment does
not necessarily equate to the sales within that particular area. Residents can freely travel in and
out of the subject area, and they will typically choose to shop at retail destinations with their
preferred products, brands, proximity, accessibility and price points. A good quality offering will
attract customers from beyond its core market, whereas a low-quality offering is likely to
experience retail expenditure leakage out of its core market.
As Figure 3 shows, there are several Supermarket options available and depending on where
each person works, even the stores furthest away may be convenient to the local residents.
While Supermarket spend is generally drawn from a localised catchment, it is dependent on the
level of competition which exists in the wider market. Often the core catchment of a number of
supermarket provisions will overlap, particularly in areas with relatively high population density
where there are multiple supermarkets in the area. This leaves layered catchments, creating a
situation where a consumer could be in the primary catchment of multiple supermarkets. This
is likely to be the case for the proposed New World supermarket where it is evident on Figure 3
that those on the edge of the catchment would have several options that are similarly
convenient to shop at, hence there is potential for leakage of spend out of the proposed core
economic market.
The retail expenditure generated in an area represents the retail sales centres (or retail stores)
within an area could potentially achieve and is the key influence on what the market can
potentially sustain. This should not be interpreted as a negative for any retail activity in the core
catchment, but simply represents normal commercial market mechanisms (competition) and is
a consideration that needs to be appropriately accounted for in any economic analysis of
market potential and effects.
W: www.propertyeconomics.co.nz
1951922.3
6.2. SUPERMARKET SUPPLY AND DEMAND
TABLE 2: CORE CATCHMENT SUPERMARKET SUPPLY
Supermarket Provision (sqm) GFA
Mt Eden Countdown 4,500
St Lukes Countdown 3,900
Total Existing Supply 8,400
New World Mt Eden 2,600
Proposed Total supply 11,000
Source: Property Economics, New Zealand Shopping Centre Directory
Table 2 shows that currently there is around 8,400sqm of Supermarket GFA operating across
two main supermarkets within the Core Catchment. With the addition of the New World on the
subject site, this will bring total Supermarket floorspace within the Core Catchment to
11,000sqm.
W: www.propertyeconomics.co.nz
2051922.3
SUPERMARKET SUPPLY AND DEMAND DIFFERENTIAL
To provide an overview of the core market current supermarket supply versus demand
dynamics this section cross references the current supermarket provision against sustainable
supermarket demand, outlined in the preceding sections.
FIGURE 4: CORE CATCHMENT SUPERMARKET SUPPLY-DEMAND DIFFERENTIAL
Source: Property Economics
A comparison of demand and supply data shows there is significant potential in the core
catchment for additional supermarket GFA with sustainable demand exceeding supply by a
clear margin. Current supply levels are below the market s sustainable GFA indicating that there
is significant capacity for expansion with this differential increasing moving forward unless new
supply enters the market.
Currently, the Core Catchment supports an additional 13,100sqm of supermarket GFA. Given no
further change in supply, this potential is projected to rise to almost 22,600sqm by 2038. While
these projections were undertaken utilising a Medium Projection series a lower scenario this
does not fundamentally change potential in the market for additional GFA today. Even with the
introduction of the New World on the subject site, this demand / supply differential remains at
just over 10,300sqm in 2020.
The analysis indicates that generated supermarket spend currently outweighs supply, a trend
which is likely to continue. This surplus spend will invariably be directed at other supermarkets
outside of the catchment area such as those shown on Figure 3. While this would lower the real
world supermarket demand / supply differential in the core catchment, it is still highly likely
that an under provision will remain. This is particularly the case moving forward where market
growth will elevate the current situation.
W: www.propertyeconomics.co.nz
2151922.3
CENTRE COMPOSITION
As the centres most at risk of adverse retail impacts, this section outlines the composition of the
St Lukes, Mt Eden and Balmoral centres according to their Employment.
Table 3 shows the employment2 breakdown in 2019 for these three centres and the growth
across each sector over the last 5 years (2014 -2019). Appendix 4 contains a map showing the
extent of the catchments used for the following analysis which were based on covering the
extent of the centre zones given the meshblock3 boundaries.
TABLE 3: 2019 EMPLOYMENT BREAKDOWN FOR MT EDEN, BALMORAL AND ST LUKES CENTRE’S
5 Year 5 Year 5 Year
ANZSIC Mt Eden Balmoral St Lukes
Growth Growth Growth
A - Agriculture, Forestry and Fishing 3 +3 0 +0 6 +6
B - Mining 0 +0 0 +0 0 +0
C - Manufacturing 117 +29 18 -3 18 +0
D - Electricity, Gas, Water and Waste
0 +0 0 +0 0 +0
Services
E - Construction 46 +11 0 -3 15 +3
F - Wholesale Trade 24 -3 15 +3 48 +12
G - Retail Trade 276 +59 18 -15 1,124 -18
H - Accommodation and Food Services 235 +53 377 +150 201 +5
I - Transport, Postal and Warehousing 12 +6 0 +0 9 -3
J - Information Media and
6 +0 15 +0 53 -22
Telecommunications
K - Financial and Insurance Services 42 -46 12 -3 91 -18
L - Rental, Hiring and Real Estate
27 -9 3 -6 102 +75
Services
M - Professional, Scientific and
134 +21 18 -3 62 +35
Technical Services
N - Administrative and Support Services 9 -3 9 +6 34 +19
O - Public Administration and Safety 15 -10 18 -16 0 +0
P - Education and Training 9 +0 12 +3 12 +12
Q - Health Care and Social Assistance 149 +37 70 +19 97 +8
R - Arts and Recreation Services 6 -6 6 -9 38 +26
S - Other Services 18 -6 37 -5 106 +9
Total All Industries 1,128 + 136 628 + 118 2,016 + 149
Source: Property Economics, Statistics New Zealand
Additionally, Table 4 following shows the employment and recorded business counts
(Geographical Units) at a more detail ANZSIC Level 2 for the Retail Trade (G) sector.
2
Employee Counts or ECs are units of employment measure by Statistics NZ
3
Meshblocks are the smallest geographical area for data provided by Statistics New Zealand
W: www.propertyeconomics.co.nz
2251922.3
TABLE 4: EMPLOYMENT AND BUSINESS COUNT BREAKDOWN AT ANZSIC LEVEL 2 (2019)
Employee Business
Centre / ANZSIC Level 2
Count Count
Mt Eden Centre Total Retail Trade 276 30
Food Retailing 216 9
Motor Vehicle and Motor Vehicle Parts Retailing - -
Other Store-Based Retailing 60 21
Balmoral Centre Total Retail Trade 18 33
Food Retailing 9 15
Motor Vehicle and Motor Vehicle Parts Retailing - 3
Other Store-Based Retailing 9 15
St Lukes Total Retail Trade 1,124 96
Food Retailing 113 3
Other Store-Based Retailing 1,011 93
Source: Property Economics, Statistics New Zealand4
Table 4 shows the smallest of these three centres, Balmoral is predominately Accommodation
and Food Services (which is almost entirely Food and Beverage retailers rather than
Accommodation in this case). Interestingly, around 40% retailers have only entered the market
over the past 5 years and this is a trend going back to 2011 where the employment in this
industry was only 94. This rise in Food and Beverage Services has coincided with the decline of
Retail Trade. In 2005 there were 137 Employees in Retail Trade and by 2014 this had declined to
33. Almost half of these remaining stores are Food Retailing stores (15) which, unlike Mt Eden,
may benefit from not having a supermarket within the centre itself.
Conversely, Mt Eden has experienced more Commercial activities like
Professional, Scientific and Technical Services and as Table 4 shows, 60 employees in Non-Food
or Motor Vehicle retailing. In this case, the remaining 216 employees in Retail trade work in the
Food Retailing sector, which is likely to be dominated by the Countdown in this case.
Finally, St Lukes Mall, which is the largest centre and also zoned as a Town Centre, has over half
the employment in Retail Trade at over 1,100 employees. While there is a mix of other activities
(possibly due to coverage of some Mixed Use Zone area within the associated Meshblock
boundaries), this is the clear focal point of this centre.
4
Note that with the Statistics New Zealand Business Demography data, the employee and business counts
that are too small to be reported directly are rounded randomly up or down to base 3. It is also important to
know that the Employee Count does not count non-employing enterprises that are counted in the business
count, hence the potential for more businesses than employees.
W: www.propertyeconomics.co.nz
2351922.3
TRADE COMPETITION VS DISTRIBUTION EFFECTS
The aforementioned economic analysis is based on not promoting a development that would
generate significant adverse retail distribution effects on the centre network in the context of
the CRA and AUP provisions.
In terms of assessing potential retail economic effects under the CRA there is first a need to
differentiate between trade competition effects and flow-on retail distribution effects. By
themselves, trade competition effects are not justification for declining a retail consent
application under the CRA, unless they are of a level that generates significant adverse flow-on
retail distribution effects on the existing centre network of the area. It is within this broader
context that the relative merits of the application need to be considered.
Retail distribution effects are generated by, and are the result of, consequential trade
competition and retail activity disbenefit effects. These effects can range across the spectrum
(positive and negative) depending on the level of effects generated, which are heavily
dependent on the scale, type and location of the proposed activity, among other attributes.
As such, it is accepted case law, that Councils should have regard to significant effects on the
amenity of the public caused by any reductions in the viability or vitality of the commercial
centres that arise as a con
Where the patterns of support and retail activity within an existing centre would not change
dramatically within a locality as a consequence of a proposed activity, then the retail distribution
effects are not considered to be significant.
Justice Randerson J ( High Court, CIV-2003-404- The key point of distinction
between the adverse effects of trade competition on trade competitors and adverse effects
which may properly be considered under the RMA, is that trade competition effects focus
specially on the impacts on individual trade competitors. In contrast, where a proposal is likely
to have a more general effects on the wider community, then the RMA permits consideration of
those effects.
The Supreme Court in the Discount Brands Decision5 stated
f upon was the effect
which the activity proposed might have on the amenity values of the existing centres on the
appreciation of their pleasantness, aesthetic, coherence and cultural and recreational attributes.
Such effects on amenity values would be those which had a greater impact on the people and
their communities than would be caused simply by trade competition
5
Discount Brands Limited v Westfield (New Zealand) Limited (2005) 2 NZLR 597(SC) also reported as Westfield (NZ)
Ltd v North Shore CC [2005] NZSC 17; [2005] NZRMA 337 (SC).
W: www.propertyeconomics.co.nz
2451922.3
Collectively, those decisions emphasise and establish that where trade competition produces
social and economic effects that are not significant and are not beyond the effects ordinarily
associated with trade competition, those effects are to be disregarded when assessing an
application.
Put another way, retail distribution effects would occur where a new business (or cluster of
causing a decline in its function and amenity, and disenabling the people and communities
who rely upon those existing (declining) centres for their social and economic wellbeing.
Retail distributional effects are differentiated from the effects of trade competition on trade
competitors, which are to be disregarded pursuant to s31(5) (a) of the CRA when considering
resource consent applications. Although retail distributional effects are a relevant consideration
for a consent authority, it should be noted that Environment Court case law has made it clear
that those effects must be significant6 (but not necessarily ruinous) before they could properly
be regarded as going beyond the effects ordinarily associated with trade competition.
It is within this context that the potential effects of the proposed New World supermarket is
considered in the following section.
6
Northcote Mainstreet vs North Shore City Council (High Court, CIV-2003-404-5292), Randerson J stated:
“In regard to shopping centres, I would not, with respect, subscribe to the view that the adverse effects of some
competing retail development must be such, as to be ruinous before they could be considered. But they must, at the
least, seriously threaten the viability of the centre as a whole with on-going consequential effects for the community
served by that centre.”
W: www.propertyeconomics.co.nz
2551922.3
POTENTIAL FOR RETAIL EFFECTS ON CENTRES
OVERVIEW
Within the Mixed-Use Zone, there is a provision for up to 2,000sqm of Supermarket retailing as a
Restricted Discretionary activity. As this 2,787sqm New World exceeds this provision, it is
classified as a Discretionary activity.
The site is directly adjacent to the Eden Valley Local Centre zone which contains an estimated
4,500sqm Countdown and a range of retail shops. This is the main supermarket of concern in
regards to the potential for adverse Retail Impacts. Additional stores of interest within the
identified Core Catchment include a Countdown within the St Lukes Mall and a Farro Fresh in
the Business Mixed Use Zone close to the proposed New World.
Additionally, there are three centres identified in section 8 that the New World has the potential
to have adverse retail impacts upon. While there are multiple supermarkets and centres outside
the core catchment in proximity to the subject site that can be considered as potential
competitors to the proposed supermarket, it is to a substantially lesser degree than those within
the core catchment.
POTENTIAL IMPACTS
In Property Economics view, having undertaken the requisite analysis, there is little to no
propensity for this New World to cause any additional trade competition effects that would flow
over into significant retail distribution effects in the context of the CRA.
As our supply and demand calculations have shown, the current generated retail spend within
the Core Catchment significantly outweighs the supermarket supply in the market. While some
of this demand will be absorbed by the supermarkets outside of the Core Catchment, any trade
effects on these stores would be small scale in nature and disbursed over a wide area.
Consequently, the proposed New World would not individually threaten their viability and such
trade effects would be quickly offset by market growth.
Conversely, while the New World is likely to redirect proportionally more spend from the two
Countdowns (and to a lesser extent the Farro Fresh) within the Catchment, there is no reason to
expect this would result in negative trade distribution effects. Having assessed both the
supermarket demand (generated retail spend) and supply (supermarket GFA), and specialty
food retailing demand, the data would suggest that there is more than sufficient retail
expenditure to profitably sustain both of the existing Countdowns, the Farro Fresh store and the
new New World within the Core Catchment.
Any shopper who prefers the New World brand, may currently be required to disperse their
supermarket expenditure to Mt Roskill. Therefore, this New World will provide convenience and
additional choices to the local consumers while supporting the growing population around the
centre.
W: www.propertyeconomics.co.nz
2651922.3
Being located within a Mall means St Lukes would pull
and rely proportionally less on local spend. Regardless, the St Lukes Mall is not defined in any
way or anchored by the Countdown. As Table 4 shows with the 93 retail stores contained within
the catchment, the performance of these large Malls like St Lukes rides on the quality and range
of retailing options.
Given its location directly adjacent to the Eden Valley centre, this New World acts as an
extension of the Local Centre Zone rather than detracting visitors away from the centre. The
Eden Valley Countdown is a high performing supermarket in Auckland which is likely a
reflection of the relatively low supermarket density within the Core Catchment. Therefore, while
the New World would capture some Countdown sales, it is not at the risk of either closing down
or becoming unprofitable.
Where the New World has theoretically some potential impact is on the smaller speciality food
retailers within Mt Eden. While Table 4 shows that there are several of these stores in both the
Mt Eden and Balmoral centres, the centre is not dependent on these smaller stores. Any minor
trade competition effects occurring as a result of any redistribution of spend (potentially
through easier parking and better accessibility) are likely to be quickly offset by market growth.
The Eden Valley local centre does not have sufficient zoned capacity to accommodate a
significant increase in its convenience retail provision being a fully developed zone. Given the
growth in the market and the indication by the market (through the existence of commercial
activities that typically exist in centres on the subject site) that the current Local Centre Zone is
insufficient for such activity, additional convenience provision is required.
As such the proposal, given its underlying Mixed Use Zone is considered well positioned to
provide a portion of this growing requirement to the market in an efficient manner improving
the efficiency of the network and business land provision as a whole.
W: www.propertyeconomics.co.nz
2751922.3
APPENDIX 1: DEMOGRAPHIC PROFILING
Dominon Road Auckland
Population 47,638 1,642,811
GENERAL
Households 16,362 531,779
Person Per Household Ratio 2.91 3.09
Intercensal Population Growth (Total | % p.a.) 1,202 | 0.5% 125,352 | 1.6%
0 - 9 Years 10% 13%
10 - 19 Years 12% 13%
20 - 29 Years 22% 16%
AGE PROFILE
30 - 39 Years 17% 15%
40 - 49 Years 15% 13%
50 - 59 Years 12% 12%
60 - 69 Years 7% 9%
70 - 79 Years 4% 5%
80 Years and Over 2% 3%
Median Age 32.8 34.7
$20,000 or less 7% 8%
$20,001-$30,000 6% 7%
Household
Income
$30,001-$50,000 9% 12%
$50,001-$70,000 10% 11%
$70,001-$100,000 14% 15%
$100,001-$150,000 19% 21%
$150,001 or more 35% 26%
Median Income $111,000 $94,000
Asian 28% 25%
European 56% 47%
ETHNICITY
Maori 6% 10%
Middle Eastern Latin American African 2% 2%
New Zealander 1% 1%
Other Ethnicity 1% 1%
Pacific Peoples 6% 14%
No qualification 7% 15%
QUALIFICATION ATTAINMENT
Overseas secondary school qualification 7% 9%
Level 1 certificate 5% 9%
Level 2 certificate 6% 8%
Level 3 certificate 11% 12%
Level 4 certificate 4% 7%
Level 5 diploma 4% 5%
Level 6 diploma 5% 5%
Bachelor degree and Level 7 qualification 28% 19%
Post graduate and honours degrees 12% 7%
Masters degree 9% 5%
Doctorate degree 2% 1%
Elsewhere in New Zealand 39% 41%
LOCATION 5
YEARS AGO
No fixed abode five years ago 0% 0%
Not born five years ago 5% 8%
Overseas 16% 12%
Same as usual residence 39% 40%
W: www.propertyeconomics.co.nz
2851922.3
Dominon Road Auckland
Employed Full time 58% 52%
EMPLOYMENT
Employed Part time 15% 14%
Not in the Labour Force 24% 30%
Unemployed 4% 4%
0 0
Clerical and Administrative Workers 10% 12%
Community and Personal Service Workers 8% 9%
CLASSIFICATION
EMPLOYMENT
Labourers 4% 8%
Machinery Operators and Drivers 2% 6%
Managers 20% 18%
Professionals 37% 26%
Sales Workers 9% 10%
Technicians and Trades Workers 9% 11%
Wages, Salary, Commissions, Bonuses etc paid by my employer 69% 62%
Interest, Dividends, Rent, Other Investments 20% 15%
PERSONAL INCOME SOURCES
Jobseeker Support 4% 6%
New Zealand Superannuation or Veteran s Pension 9% 13%
Other government benefits, Payments or Pension 3% 4%
Other Sources of Income 2% 2%
Other Superannuation, Pensions or Annuities 1% 2%
Regular payments from ACC or a Private Work Accident Insurer 1% 1%
Self Employment or Business I own and work in 17% 14%
Sole Parent Support 1% 2%
Student Allowance 3% 3%
Supported Living Payment 1% 2%
No source of income during that time 7% 8%
Accommodation and Food Services 8% 6%
Administrative and Support Services 5% 5%
Agriculture Forestry and Fishing 0% 1%
Arts and Recreation Services 2% 2%
Construction 6% 9%
Education and Training 9% 8%
INDUSTRY OF EMPLOYMENT
Electricity Gas Water and Waste Services 1% 1%
Financial and Insurance Services 5% 4%
Health Care and Social Assistance 9% 9%
Information Media and Telecommunications 4% 2%
Manufacturing 6% 10%
Mining 0% 0%
Other Services 3% 4%
Professional Scientific and Technical Services 19% 13%
Public Administration and Safety 4% 4%
Rental Hiring and Real Estate Services 3% 2%
Retail Trade 8% 9%
Transport Postal and Warehousing 3% 5%
Wholesale Trade 5% 7%
W: www.propertyeconomics.co.nz
2951922.3
Dominon Road Auckland
Under $100 3% 6%
WEEKLY RENT PAID
$100 - 149 2% 8%
$150 - 199 2% 3%
$200 - 299 5% 6%
$300 - 399 19% 14%
$400 - 499 23% 25%
$500 - 599 17% 19%
$600 and over 29% 20%
OWNERSHIP
Dwelling held in a family trust 16% 14%
DWELLING
Dwelling not owned and not held in a family trust 49% 41%
Dwelling owned or partly owned 34% 45%
DWELLING TYPE
Joined dwelling 32% 19%
Other private dwelling 0% 0%
Private dwelling not further defined 0% 0%
Separate house 68% 80%
Dwelling Under Construction 1% 1%
OCCUPANCY
DWELLING
Empty Dwelling 2% 3%
Occupied Dwelling 94% 91%
Residents Away 3% 4%
One bedroom 15% 7%
NUMBER OF
BEDROOMS
Two bedrooms 28% 20%
Three bedrooms 29% 39%
Four bedrooms 20% 24%
Five or more bedrooms 8% 10%
STUDYING
Full time study 23% 22%
Not studying 74% 75%
Part time study 3% 3%
One usual resident 20% 18%
Two usual residents 28% 29%
Household Size
Three usual residents 19% 18%
Four usual residents 20% 19%
Five usual residents 8% 9%
Six usual residents 3% 4%
Seven usual residents 1% 2%
Eight or more usual residents 1% 2%
Number of usual residents unidentifiable 3% 4%
W: www.propertyeconomics.co.nz
3051922.3
APPENDIX 2: FOOD RETAILING – ANZSIC06
Division G – Retail Trade
Subdivision 41 – Food Retailing
411 SUPERMARKET AND GROCERY STORES
4110 Supermarket and Grocery Stores
This class consists of units mainly engaged in retailing groceries or non-specialised food lines
(including convenience stores), whether or not the selling is organised on a self-service basis.
Primary activities
• Convenience store operation
• Grocery retailing
• Grocery supermarket operation
Exclusions/References
Units mainly engaged in retailing specialised food lines are included in the appropriate classes of
Group 412 Specialised Food Retailing.
412 SPECIALISED FOOD RETAILING
4121 Fresh Meat, Fish and Poultry Retailing
This class consists of units mainly engaged in retailing fresh meat, fish or poultry.
Primary Activities
•
• Fish, fresh, retailing
• Meat, fresh, retailing
• Poultry, fresh, retailing
• Seafood, fresh, retailing
4122 Fruit and Vegetable Retailing
This class consists of units mainly engaged in retailing fresh fruit or vegetables.
Primary activities
• Fruit, fresh, retailing
• Greengrocery operation (retail)
• Vegetable, fresh, retailing
W: www.propertyeconomics.co.nz
3151922.3
4123 Liquor Retailing
This class consists of units mainly engaged in retailing beer, wine or spirits for consumption off
the premises only.
Primary activities
• Alcoholic beverage retailing (for consumption off the premises only)
Exclusions/References
Units mainly engaged in selling alcoholic beverages for consumption on the premises, such as
hotels, bars and similar units (except hospitality clubs), are included in Class 4520 Pubs, Taverns
and Bars.
4129 Other Specialised Food Retailing
This class consists of units mainly engaged in retailing specialised food lines, such as confectionery
or smallgoods or bread and cakes (not manufactured on the same premises).
Primary activities
• Biscuit retailing (not manufactured on the same premises)
• Bread retailing (not manufactured on the same premises)
• Bread vendor (not manufactured on the same premises)
• Cake retailing (not manufactured on the same premises)
• Confectionery retailing
• Non-alcoholic drinks retailing
• Pastry retailing (not manufactured on the same premises)
• Smallgoods retailing
• Specialised food retailing n.e.c.
Exclusions/References
Units mainly engaged in
• retailing a wide range of food lines are included in Class 4110 Supermarket
and Grocery Stores;
• providing food services for immediate consumption for taking away or
consumption in limited seating areas are included in Class 4512 Takeaway
Food Services;
• manufacturing bakery products and selling those products from the same
premises are included in Class 1174 Bakery Product Manufacturing (Non-
factory based); and
• -store means (except
mobile vans) are included in Class 4310 Non-Store Retailing.
W: www.propertyeconomics.co.nz
3251922.3
APPENDIX 3: PROPERTY ECONOMICS RETAIL EXPENDITURE MODEL
This overview outlines the methodology that has been used to estimate retail spend generated
at Census Area Unit (CAU) level for the identified catchment out to 2038.
MB 2013 Boundaries
All analysis has been based on Meshblock 2013 boundaries, the most recent available.
Permanent Private Households (PPH) 2013
These are the total Occupied Households as determined by the Census 2013. PPHs are the primary
basis of retail spend generation and account for approximately 71% of all retail sales. PPHs have
regard for (exclude) the proportion of dwellings that are vacant at any one time in a locality, which
can vary significantly, and in this respect account for the movement of some domestic tourists.
Permanent Private Household Forecasts 2006-2038
These are based on Statistics NZ Census Area Unit (CAU) Medium Series Population Growth
Projections and have been adjusted to account for residential building consent activity occurring
between 2006 and 2015, with this extrapolated to the year of concern. This accounts for recent
building activity, particularly important for the 5-10 year forecasts, and effectively updates
Statistics NZ projections to reflect recent trends.
International Tourist Spend
The total international tourism retail spend has been derived from the Ministry of Economic
Development Tourism Strategy Group (MEDTSG) estimates nationally. This has been distributed
asis, using regional spend estimates prepared by the
MEDTSG. Domestic and business based tourism spend is incorporated in the employee and PPH
estimates. Employees are the preferred basis for distributing regional spend geo-spatially as
tourists tend to gravitate toward areas of commercial activity, however they are very mobile.
Total Tourist Spend Forecast
Growth is conservatively forecast in the model at 2% per annum for the 2015-2038 period.
W: www.propertyeconomics.co.nz
33You can also read