Newspapers vs. Blogs: Who Gets the Scoop?
←
→
Page content transcription
If your browser does not render page correctly, please read the page content below
Newspapers vs. Blogs: Who Gets the Scoop?

                                        Levon Lloyd, Prachi Kaulgud, Steven Skiena
                                                     Department of Computer Science
                                               State University of New York at Stony Brook
                                                      Stony Brook, NY 11794-4400
                                                 {lloyd, prachik, skiena}@cs.sunysb.edu

                             Abstract                                  forced the mainstream media to revisit the story, which ulti-
  Blogs and formal news sources both monitor the events of the
                                                                       mately lead to the resignation of Trent Lott.
  day, but with substantially different frames of reference. In
  this paper, we report on experiments comparing over 500,000          Main Contributions
  blog postings with the contents of 66 daily newspapers over          • We introduce our Lydia system for analysis of blogs and
  the same six week period. We compare the prevalence of                 online news sources. Lydia performs a variety of inter-
  popular topics in the blogspace and news, and in particular            esting analysis on named entities in text, breaking them
  analyze lead/lag relationships in frequency time series of 197         down by source, location and time. Associations between
  entities in the two corpora. The correlation between news and          entities are identified through juxtaposition analysis.
  blog references proved substantially higher when adjusting
  for lead/lag shifts, although the direction of these shifts varied     Lydia is the foundation of our system for doing real-time
  for different entities.                                                analysis of news streams. We encourage the reader to
                                                                         visit our websites for our latest analysis of roughly 500
                                                                         U.S. daily newspapers (www.textmap.org) and hundreds
                         Introduction                                    of thousands of blog postings (www.textblg.org).
Blogs represent an interesting new frontier for text analyt-           • We discuss the modifications necessary to optimize the
ics. More than just text, they provide significant structural            ability of our existing text analytics system to accurately
information about the author, such as precise timestamps,                process blogs.
geographical location, age, gender, and explicit friendship
links. They also provide a forum for a much larger and po-             • Visualizing the geographic location of the buzz surround-
tentially representative group of correspondents than con-               ing a topic can provide insights into where there is inter-
ventional media. According to (Nardi, Schiano, & Gum-                    est in that topic. We present our system for generating
brecht 2004), people blog to express their opinions on is-               heatmaps (Mehler et al. 2005) and show results of ap-
sues to influence others. They provide examples of bloggers              plying this to blogspace. In particular, we exhibit maps
posting links to on-line publications, and then adding their             showing the geographic distribution of slang terms and
personal commentary. Thus blogging analysis can be used                  entities of local interest.
to determine the collective public opinion on current events.          • We contrast the relative blog/news interest among a wide
   In this paper, we introduce our Lydia text analysis system            range of topics. While certain differences are readily pre-
as a tool for analyzing the blogspace. In particular, we com-            dictable (e.g. greater interest in popular culture on blogs),
pare the content of blogs with that of major U.S. newspapers             we were surprised by the degree of topic coherence be-
over the same time frame. Our analysis helps to shed light               tween news and blogs.
on questions of whether the conventional news media leads              • We study the lead-lag relationship between blogs and
or lags popular opinion as expressed in blogs.                           the news media, by analyzing the reference frequency
   In particular, we present the results of a quantitative anal-         time series of 197 entities which appeared often in both
ysis of the temporal relationship between news and blogs.                sources. Of these, 30 exhibited no lead/lag relationship,
How often do bloggers report a story before newspapers?                  73 had news leading the blogs, and 94 had blogs leading
And conversely, how often do bloggers react to news that                 the news.
has already been reported? There has been at least one well
documented (Ashbee 2003) example of bloggers breaking a                                        Related Work
story and influencing the mainstream media. News media
                                                                       Several existing web services allow users to navigate
gave little initial coverage to controversial comments made
                                                                       blogspace and provide aggregate information on what is
by Trent Lott in December of 2002. However, these com-
                                                                       happening there. Indeed:
ments quickly became the focus of buzz in blogspace. This
                                                                       • Google1 has recently launched a blog only search engine.
Copyright c 2005, American Association for Artificial Intelli-
                                                                          1
gence (www.aaai.org). All rights reserved.                                    http://www.google.com/blogsearch/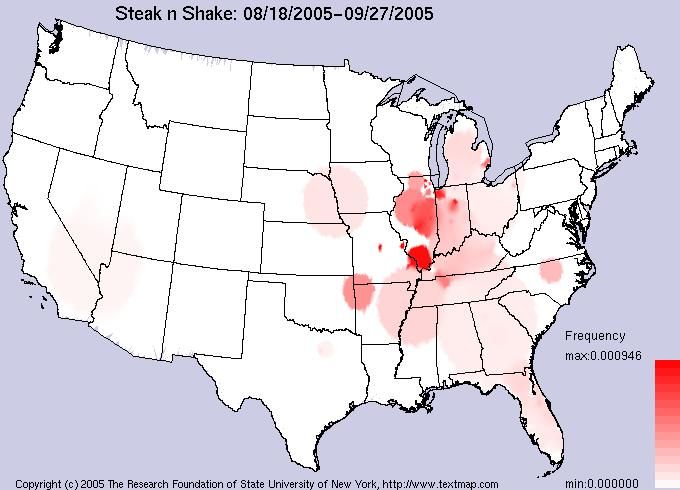
• Technorati2 uses blogger-provided annotation to provide            Type 1
                                                                     Document
                                                                                               Type 2
                                                                                               Document
  a Yahoo! style directory of blogs. They also provide links
  to the most popular news stories, books, and movies men-
                                                                    Type 1                    Type 2                                    Juxtaposition   Synset
  tioned in blogs and rank blogs based on the number of             Reformatter               Reformatter
                                                                                                                 Applications           Analysis        Identification

  other blogs that link to it.
• Blogrunner3 correlates news headlines with blog postings,                       Document                                                               Heatmap
                                                                                                                                                         Generation
                                                                                  Identity                                  Database
  providing links both to news articles and blog postings on                      Extractor

  the news item.
• Blogstreet4 provides a few different services. Blog neigh-
                                                                             Part−Of−Speech
                                                                             Tagging

  borhoods clusters blogs based on blogroll links between
  them. Blog influence quotient(BIQ) is their method of                           Syntactic
  ranking blogs based on the link structure of blogspace.                         Tagging
                                                                                                                           Geographic
                                                                                  Pipeline
  They also show the top books, DVDs, and CDs mentioned                                                                    Normalization

  in blogs.
                                                                              Actor                         Rule−Based      Alias
   (Gruhl et al. 2005) show that increased chatter about a                    Classification                Processing      Expansion

book in blogs can predict an increase in the Amazon sales
rank for that book. They correlate a time series representing                 Figure 1: Block diagram of the Lydia Pipeline
the number of blogs that mention a book’s title with a time
series representing the sales rank of the book and show that
for a certain fraction of the books, the two time series were      son blogs about a topic based on the probability that one of
highly correlated, with the blog time series leading the sales     his friends blogs on that topic and then validate this model
rank time series more than half the time.                          with both synthetic and real data.
   (Liben-Nowell et al. 2005) study friendship links between          The Newsblaster project (McKeown et al. 2002; Barzi-
bloggers and their corresponding geography. They show              lay, Elhadad, & McKeown 2002) provides summaries of the
that a large fraction of friendship links can be explained ge-     day’s news that it obtains from a set of online newspapers.
ographically. Further, they show that geographic distance          Applying state-of-the-art techniques in topic detection and
is not the correct way to calculate the probability that two       tracking, they cluster articles by event, group these clusters
people are friends, but rather the number of people that live      into groups of articles about related events, and categorize
closer to one person than the other.                               each event into pre-determined top-level categories(U.S.,
   (Kumar et al. 2003; 2004) give an overview of the charac-       World, Sports, Entertainment, Science/Technology, and Fi-
teristics of blogs and bloggers. They studied the personal in-     nance). They have recognized different classes of articles:
formation provided by bloggers, including age, geographic          articles about a single event, articles about multiple events,
location, and personal interests. They show correlations be-       biographical articles, and articles that do not fit into any of
tween friendship, location, age and shared interests. A study      the other categories. Different multi-document summarizers
of blogspace on the community level is also presented. Al-         are used, one designed for each class of article. Each cluster
gorithms for identifying these communities and temporal            of articles is routed to one of these summarizers to produce
bursts of activity within these communities are given.             the summary for that event.
   (Lin & Halavais 2004) study the geographic information
that is attached to blogs. They present an algorithm that                                                            Lydia
looks not only at the profile page of a blogger, but also at       Lydia (Lloyd, Kechagias, & Skiena 2005) is a system de-
other clues such as Who-is data for self-hosted blogs and          signed for high-speed analysis of online text. We seek to
links to local weather and news present in the blog. The           analyze hundreds of text feeds daily. Lydia is capable of
first three digits of the zip code of a blogger is proposed as a   retrieving a daily newspaper like The New York Times and
way to more robustly represent the location of a blogger for       then analyzing the resulting stream of text in roughly one
studying the geography of blogs.                                   minute of computer time. We are capable of processing over
   (Gruhl et al. 2004) presents a study on information dif-        500, 000 blog postings per day on a single commodity com-
fusion in blogspace along two dimensions, topical and in-          puter.
dividual. First, they present a model of day-to-day changes           A block diagram of the Lydia processing pipeline appears
in the number of blog postings about a topic, showing that         in Figure 1. The major phases of our analysis are:
this is the sum of background chatter about the topic and
                                                                   • Spidering and Article Classification – We obtain our
event based spikes. Then they study the propagation of top-
                                                                     newspaper and blog text via spidering and parsing pro-
ics from blogger to blogger by comparing this propagation
                                                                     grams which require surprisingly little customization for
to the spread of an infectious disease through a population.
                                                                     different news sources. We also attempt to classify source
They present a model describing the probability that a per-
                                                                     articles by news type (e.g. business, sports, entertain-
   2
     http://www.technorati.com/                                      ment).
   3
     http://www.blogrunner.com/                                    • Named Entity Recognition – Identifying where entities
   4
     http://www.blogstreet.com/                                      (people, places, companies, etc.) are mentioned in news-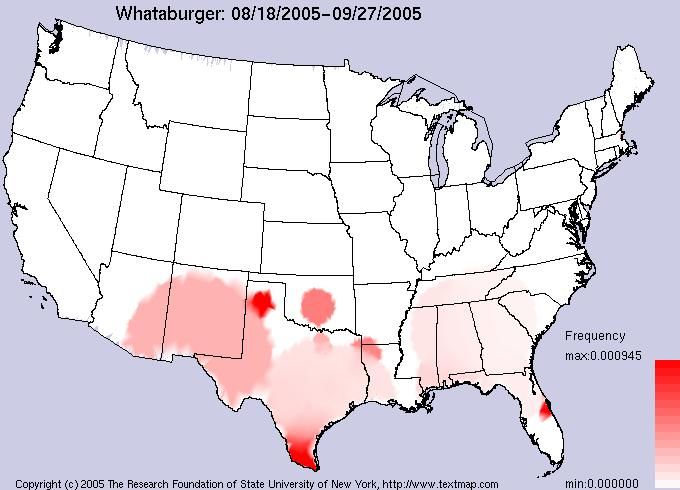
Figure 2: Blog post classifications for Jamie Foxx
Figure 4: Map of locations of all of the bloggers in our
database
Figure 3: Blog post classifications for Michael Brown
which it was not trained. For example, observe how the ref-
erence frequency classifications (denoted by line colors) dif-
paper articles is a critical first step in extracting informa- fer for entities such as entertainer Jamie Foxx (Figure 2) and
tion from them. government official Michael Brown (Figure 3).
• Juxtaposition Analysis – For each entity, we wish to iden- Table 1 shows how blog postings and news articles are
tify what other entities occur near it in an overrepresented distributed into each of our classes. The two most interesting
way. We use statistical methods for ranking such co- differences are the larger number of blog posting classified
occurrence relations. as entertainment and the small number of blog postings clas-
sified as business. This is one way of comparing the content
• Co-reference Set Identification – A single entity is often of news to that of blogs and shows that people blog more
mentioned using multiple variations on their name. For about the entertainment world and less about the business
example, George Bush is commonly referred to as Bush, world.
President Bush and George W. Bush. Further the abun- Examining our article classification more closely, we
dance of misspellings in blogs leads to multiple varia- found that entertainment figures had most postings in the en-
tions of the same name (e.g. Britney Spears, Brittany tertainment category, and political figures had most postings
Spears). Our methods for identifying such co-reference in the news category. Table 2 shows that we can catego-
sets are discussed in more detail in (Lloyd, Mehler, & rize people based on the predicted type of the blog postings
Skiena 2005), with a performance evaluation. that they appear in. Entertainment figures (Jamie Foxx, Jes-
• Temporal and Spatial Analysis – We can establish local sica Alba, . . . ), political figures ( Michael Brown, President
biases in the news by analyzing the relative frequency Bush, Cindy Sheehan ), and sports figures ( Derek Jeter, Ter-
with which given entities are mentioned in different news rell Owens ) have most mentions classified in entertainment,
sources. news, and sports respectively.
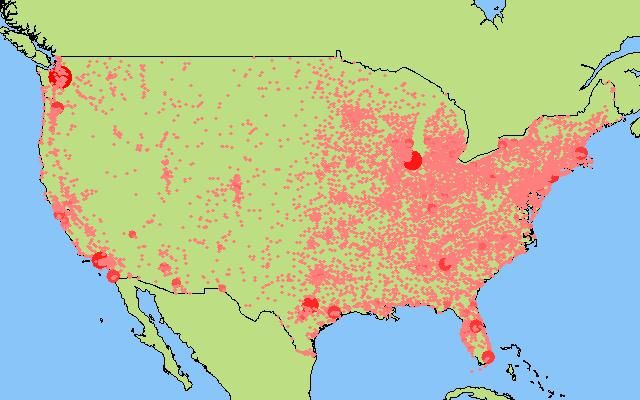
Classification of News/Blog Entries Heatmaps
Our system for analyzing newspapers includes Bayesian Visualizing the geographic location of the buzz surrounding
classification of newspaper articles into one of news, busi- a topic can provide insights into where there is interest in
ness, entertainment, sports, and other. We were pleasantly that topic. Such analysis requires a geographically diverse
surprised with how well our classifier worked on blog post- set of bloggers. Figure 4 gives the geographic coverage of
ings, for which a priori classifications did not exist and on our set of bloggers, where we drew a dot at each city that has
a blogger in it scaled according to the number of local blog-
Class % of Blog % of News gers. Figure 4 shows heavy coverage of the Eastern United
Entries Articles States but the apparently low uniform coverage in the West
business 1.44% 28.89% reflects population density. Indeed, our database has at least
entertainment 42.81% 12.31% one blogger in 9, 485 of the roughly 25, 000 different cities
news 35.71% 33.97% in the U.S.
other 4.80% 6.52% Our heatmaps do show interesting geographic distribu-
sports 15.23% 18.31% tions of both slang and certain entities. Figure 5 shows the
heatmap for Steak N Shake, a fast-food restaurant with most
Table 1: Percent of blog entries and news articles classified of its locations in the Mid-West5 . The buzz correlates well
in each class 5
http://www.steaknshake.com/states/location.asp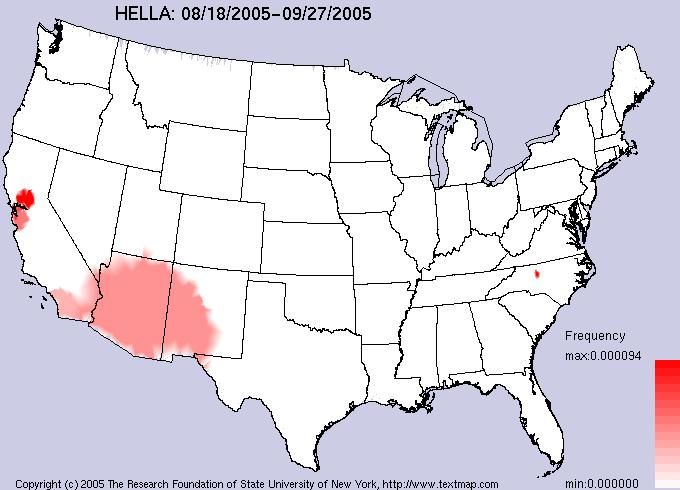
Entity Name         News       Business    Entertainment    Sports     Other
                               Articles   Articles    Articles         Articles   Articles
           Michael Brown       180        81          14               0          22
           President Bush      716        809         106              3          103
           Cindy Sheehan       251        93          36               3          29
           Jamie Foxx          5          0           39               2          0
           Jessica Alba        8          0           84               5          3
           Martha Stewart      33         8           190              4          6
           Michael Jackson     41         3           649              15         14
           Derek Jeter         7          0           3                22         0
           Terrell Owens       1          0           1                17         0

                  Table 2: Number of blog postings in each class for a given entity.

                                                                      Figure 7: Heatmap for Hella

Figure 5: Heatmap for Steak N Shake
                                                      with where its locations are. The same phenomenon holds
                                                      for Whataburger, a Texas-based restaurant chain. Figure 7
                                                      shows the heatmap of the slang term hella, used primarily
                                                      on the West Coast. Our analysis reflects this, showing usage
                                                      concentrated around San Francisco and Los Angeles.
                                                         To produce heatmaps, we extract the location of the blog-
                                                      ger from their user-information page. For each city, we
                                                      approximate a sphere of influence based on the number of
                                                      bloggers there, its population, and the populations of sur-
                                                      rounding cities. The heat an entity is generating in a city is
                                                      now a function of the number of times it is mentioned in the
                                                      other cities that have influence over that city.
                                                         To draw the map, we triangulate the cities in the continen-
                                                      tal U.S.. Then we determine the heat at each city. Finally, we
                                                      color each triangle by interpolating the heat at each vertex.
                                                      Details appear in (Mehler et al. 2005).

                                                      Blog Specific Processing
                                                      Blogs are more difficult to analyze using traditional natural
                                                      language processing techniques than professional news re-
                                                      ports. While newspapers adhere to standard usage of gram-
                                                      mar, punctuation and capitalization, blogs are seldom gram-
Figure 6: Heatmap for Whataburger
                                                      matically correct, often use inconsistent capitalization and
                                                      punctuation, and contain typos, misspellings, and unique
                                                      abbreviations. Adapting our Lydia text analysis pipeline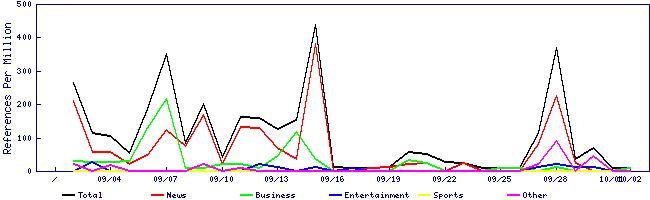
from newspapers to blogs required a modest amount of cus-
tomization, which we report on in this section.
    The first adaptation necessary for blogs was to account
for inconsistent capitalization. In newspaper articles, words
entirely in upper case are usually acronyms. In the informal
language of blogs, some write in a uniform case, while oth-
ers use capitalization to express their emotions such as hap-
piness or anger (”Im SO excited!” or ”I HATE you”) or to                     Figure 8: Time series for sore throat
convey a certain tone of speech (”There was NO way I was
going to the party”). We explicitly remove named entity tags
from any stop-word or emotion-conveying word that was
tagged because of capitalization. Many bloggers use uni-
form case leaving us unable to use capitalization to identify
named entities. Our remedy was to use a gazetteer-based
approach to identify classes of named entities (e.g. cities,
companies, universities, etc).
    A potential problem here is the ambiguity of some of
these tokens. For example, Gary is both a popular male first       Figure 9: Blog and News time series for Britney Spears
name and the name of a city in Indiana. We handle this
situation by tagging the entity as ambiguous, and then run
                                                                 Popular Entities in News vs. Blogs
a Bayesian classifier that is trained to identify the semantic
class of an entity based on its context.                         One simple way to capture the differences in the topics that
    The second necessary change was to account for the           are prominent in the news and in blogs is by looking at the
heavy usage of emoticons6 (:), :(, etc.) and Instant Mes-        differences in the lists of the most popular entities that are
saging short forms7 ( “b4 = before”, “2nite = tonight”, etc.).   referred to in both corpora.
Emoticons interfere with the part-of-speech tagger because          Table 3 shows both the most popular people in the news
it interprets them as weird punctuation. Further, without de-    and in blogs. Not surprisingly, all but one of the top people
termining their meaning, the presence of emoticons is irrele-    in the news are political figures. What may be surprising
vant. Gazetteers of commonly used emoticons were used to         are the relatively low prominence of these figures in blogs.
identify and eliminate them from the text. Similarly, Instant    For example, Ariel Sharon does not appear in a single blog
Messaging short forms confuse the part of speech tagger be-      in our corpus! Alternatively, looking at the top people in
cause they are not words in its lexicon. To resolve these        blogs, it immediately becomes clear that bloggers are more
problems, the commonly used short forms are recognized           interested in the entertainment world than current events and
and expanded to their normal English equivalents.                politics. George Bush, Michael Brown, and Cindy Sheehan
                                                                 are the only non-entertainment people on the list.
    One interesting direction of future work in this arena is       Table 4 shows the most referenced drugs. The blog list
to use both the emotion-conveying capitalization and emoti-      features a lot of drugs that people use on a daily basis
cons in the development of a sentiment extraction system         (Tylenol, Advil, Sudafed) showing how people use blogs to
that can capture the strong emotions that are often commu-       document their daily lives. In contrast, the news list features
nicated in blogs.                                                a lot of drugs that are currently getting press like Tamiflu,
                                                                 which is being touted as the only effective medicine for a
       Experiments, Results, and Discussion                      potential flu epidemic, and Vioxx, whose maker is currently
                                                                 under investigation for failing to disclose information about
Here we describe experiments that we performed on                its safety.
news/blog data. First, we compare the most popular entities         The most referenced companies in both corpora are shown
in each corpus. Then, we examine individual entities and         in Table 5. An interesting similarity between the two lists
compare how the number of references to an entity changes        is the prominence of technology companies. Further, the
with time in the two corpora.                                    appearance of grocery stores (Kroger, Safeway) reinforces
   All of the experiments in this paper used two sources. For    the fact that bloggers blog to document their everyday lives.
blogs, we downloaded Livejournal’s8 latest posts RSS feed
of the most recent blog postings every 15 minutes between        Comparing Time Series
August 18, 2005 and September 27, 2005. This totals over         We compared the time series of reference frequency to enti-
500, 000 blog posts. Our newspaper analysis was performed        ties over time in blogs and in the news. There are a variety of
on a set of 66 of the most important daily U.S. newspapers       interesting phenomena reflected in these time series, such as
in the same time frame.                                          the increase in illness (sore throats) as the weather changes
                                                                 from summer to fall (Figure 8). Figure 9 shows the two time
   6
     http://www.netlingo.com/smiley.cfm                          series for Britney Spears. From this picture a few things
   7
     http://www.netlingo.com/emailsh.cfm                         are evident. (1) The background interest in Britney Spears
   8
     http://www.livejournal.com/                                 is much higher in blogs than in the news. (2) The news of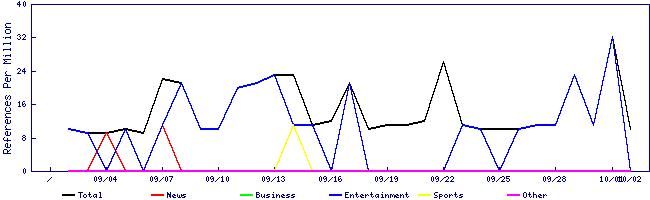
Top People in News Top People in Blogs
Rank in Rank in Name Rank in Rank in Name
News Blogs Blogs News
1 2 George Bush 1 380 Harry Potter
2 48 John Roberts 2 1 George Bush
3 2498 Ray Nagin 3 359 Britney Spears
4 7 Michael Brown 4 177 Michael Jackson
5 765 Arnold Schwarzenegger 5 421 Tim Burton
6 2975 Steve Spurrier 6 439 Kelly Clarkson
7 324 William Rehnquist 7 4 Michael Brown
8 192 Kathleen Blanco 8 16 Cindy Sheehan
9 N/A Ariel Sharon 9 N/A Brad Renfro
10 109 Pat Robertson 10 1921 Rick Perry
Table 3: Top People in the News and in Blog Postings
Top Drugs in News Top Drugs in Blogs
Rank in Rank in Name Rank in Rank in Name
News Blogs Blogs News
1 47 Vioxx 1 6 Tylenol
2 80 Tamiflu 2 63 Advil
3 80 Zyprexa 3 63 Vicodin
4 9 Viagra 4 49 Allegra
5 53 Lipitor 5 56 Prozac
6 1 Tylenol 6 72 Benadryl
7 195 Plavix 7 28 Zoloft
8 53 OxyContin 8 23 Valium
9 88 Celebrex 9 4 Viagra
10 195 Bextra 10 24 Sudafed
Table 4: Top Drugs in the News and in Blog Postings
Figure 10: Blog and News time series for New Orleans Figure 11: Blog and News time series for World Trade Cen-
ter
her giving birth on September 14 caused some early buzz in
blogspace on that day, but was not fully reported in the news To study these correlation effects more rigorously, we
until the next day. (3) The amount and duration of the buzz constructed a set of 197 entities that are popular in both cor-
in both corpora was quite similar (relative to the amount of pora and computed the correlation coefficient between the
background noise). In the rest of this section we will discuss time series for each entity in the set. Surprisingly, the aver-
similar experiments to explore the relationships between the age correlation was only .085.
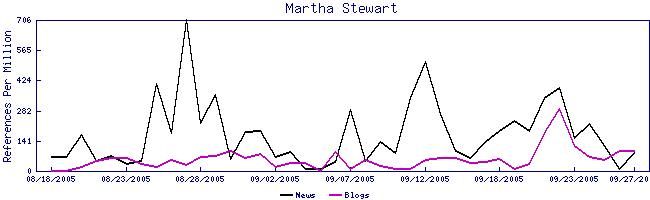
time series in the news and blogs. We noticed one interesting departure from highly corre-
We explored the correlation between news/blog reference lated pictures that we were able to learn something from.
time series, expecting high correlation. In Figure 10, we Figure 12 shows the time series for Martha Stewart. The
see that New Orleans rose to prominence during and imme- news time series shows three prominent spikes, while the
diately after Hurricane Katrina and then slowly fell back blog time series only shows one, which is highly correlated
down to the background level of discussion. In Figure 11, with the last of the news time series. The first spike in the
we see how the World Trade Center quickly came into and news series corresponds to reporting on a few details about
then left prominence around the anniversary of the terrorist one of her upcoming television shows, while the second and
attack on it. third spikes correspond to the premiere of her shows. It ap-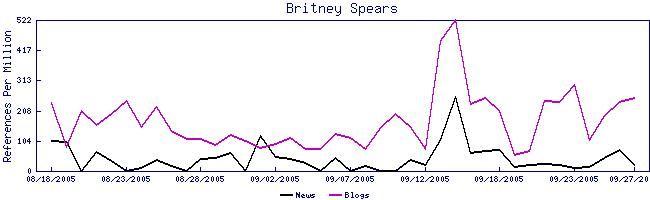
Top Companies in News                Top Companies in Blogs
                         Rank in     Rank in         Name           Rank in Rank in       Name
                         News        Blogs                          Blogs    News
                         1           17             Boeing          1        2          Microsoft
                         2           1             Microsoft        2        4            Oracle
                         3           30              Merck          3        8         Home Depot
                         4           2               Oracle         4        40          Safeway
                         5           8            Walt Disney       5        23          Comcast
                         6           244            Chevron         6        54           Kroger
                         7           10               Intel         7        36         Coca-cola
                         8           3            Home Depot        8        5         Walt Disney
                         9           121         Exxon Mobil        9        13         Motorola
                         10          244      Northwest Airlines    10       7             Intel

                                    Table 5: Top Companies in the News and in Blog Postings

Figure 12: Blog and News time series for the Martha Stewart          Figure 15: Blog and News time series for Barbara Bush

                                                                             Correlation    Best    Name
                                                                             Coefficient    Lag
                                                                                  0.990        0    Don Adams
                                                                                  0.898        0    Pat Robertson
                                                                                  0.876        1    Galveston, TX
                                                                                  0.857       -1    Mobile, AL
                                                                                  0.855        0    New Orleans, LA
                                                                                  0.838       -1    Barbara Bush
     Figure 13: Blog and News time series for Ophelia                             0.823        3    Baton Rouge, LA
                                                                                  0.776        1    Houston, TX
                                                                                  0.775       -2    Tim Burton
pears that the lack of a corresponding spike in the blogs for                     0.738        0    North Korea
the premiere of her television show displays a lack of inter-
est in the show from blogspace.                                    Table 6: Entities with the highest correlations between the
   Perhaps this surprising lack of correlation was due to          news and blogs
time-shifts between the two time series? Maybe blogs re-
port things first because it is easier to post a blog entry than
to publish a newspaper article, or maybe the news reports
things first and bloggers subsequently comment on what             It appears that bloggers began discussing the storm about
they have seen in the news. Both phenomena appear to               5 days before it hit the mainstream media. On the other
be at work. Figure 13 shows the time series for Ophelia,           hand, Figures 14 and 15 show cases where bloggers lagged
a storm that hit the east coast of the U.S. in early September.    behind the news. The spike on September 23 for Tim Bur-
                                                                   ton corresponds to the release of his new movie, ”Corpse
                                                                   Bride”, with the corresponding spike in blogspace happen-
                                                                   ing the next day and lasting for the weekend. Presumably,
                                                                   this is caused by people seeing the movie on the few days
                                                                   after its release and commenting on it in their blogs. Fig-
                                                                   ure 15 shows the time series for Barbara Bush. The spike
                                                                   in the news on September 5 corresponds to reports of con-
                                                                   troversial comments she made regarding Hurricane Katrina.
                                                                   These comments did not cause a buzz in blogspace until the
                                                                   next day.
   Figure 14: Blog and News time series for Tim Burton                To explore this relationship statistically, we computed the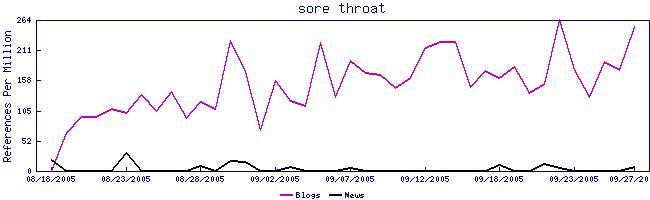
-5       -4       -3       -2         -1        0         1         2        3         4         5
       No. of Entities      20       14       14       23         23        30        12        17       13        15        16
       Avg. Correlation     0.313    0.244    0.303    0.311      0.407     0.395     0.376     0.274    0.295     0.249     0.218

                        Table 7: Number of entities with each optimal lag and there average correlation

                                                                      and rules processor, Izzet Zorlu for his web interface design,
                                                                      Namrata Godbole for her work on text markup and Michael
                                                                      Papile for his geographic normalization routine.

                                                                                                  References
                                                                          Ashbee, E. 2003. The Lott resignation, ’Blogging’, and American
                                                                          Conservatism. Political Quarterly 74(3):361–370.
 Figure 16: Blog and News time series for Pat Robertson                   Barzilay, R.; Elhadad, N.; and McKeown, K. 2002. Inferring
                                                                          strategies for sentence ordering in multidocument news summa-
                                                                          rization. Journal of Artifical Intelligence Research (JAIR) 17:35–
                                                                          55.
optimum lag and its corresponding correlation coefficient
for each entity in our set. Here a positive lag means that                Gruhl, D.; Guha, R.; Liben-Nowell, D.; and Tomkins, A. 2004.
                                                                          Information diffusion through blogspace. In Proceedings of the
the newspapers are leading the blogs. The resulting average
                                                                          13th international conference on World Wide Web.
optimal correlation coefficient is .317, which is much higher
than with no lags. The average optimal lag is −0.213 which                Gruhl, D.; Guha, R.; Kumar, R.; Novak, J.; and Tomkins, A.
                                                                          2005. The predictive power of online chatter. In Proceedings of
suggests that there are about the same number of entities                 the Eleventh ACM SIGKDD Conference on Knowledge Discovery
for which the optimum correlation coefficient has the blogs               and Data Mining(KDD).
leading as trailing.
                                                                          Hatzivassiloglou, V.; Gravano, L.; and Maganti, A. 2000. An
   Table 6 shows the optimum lag and corresponding cor-                   investigation of linguistic features and clustering algorithms for
relation coefficient for the most correlated entities. From               topical document clustering. In Proceedings of the 23rd ACM
this we can see that the most correlated entities are ones                SIGIR Conference on Research and Development in Information
which have spikes during our time period. For example, Pat                Retrieval, 224–231.
Robertson, whose time series is shown in figure 16, got cov-              Kumar, R.; Novak, J.; Raghavan, P.; and Tomkins, A. 2003. On
erage for controversial comments that he made. We also can                the bursty evolution of blogspace. In Proceedings of the Twelfth
see that the optimum lag for theses entities is almost always             International World Wide Web Conference.
almost 0 or 1.                                                            Kumar, R.; Novak, J.; Raghavan, P.; and Tomkins, A. 2004.
   Table 7 shows how many of our entities had each optimum                Structure and evolution of blogspace. Communications of the
lag and the average correlation coefficient for each of them.             ACM 47:35–39.
While most of the entities had an optimum lag of zero, the                Liben-Nowell, D.; Novak, J.; Kumar, R.; Raghavan, P.; and
entities are well distributed among the different optimal lags.           Tomkins, A. 2005. Geographic routing in social networks. Pro-
Also, while there are slightly more entities for which the                ceedings of the National Academy of Science 102:11623–11628.
blogs lead the news, there is no clear trend of blogs leading             Lin, J., and Halavais, A. 2004. Mapping the blogosphere in amer-
the news or news leading the blogs. A nearly equal number                 ica. In Workshop on the Weblogging Ecosystem, 13th Interna-
of entities fall on both sides.                                           tional World Wide Web Conference.
                                                                          Lloyd, L.; Kechagias, D.; and Skiena, S. 2005. Lydia: A system
                      Future Work                                         for large-scale news analysis. In String Processing and Informa-
                                                                          tion Retrieval(SPIRE 2005).
We leave many interesting directions of future work. First,
                                                                          Lloyd, L.; Mehler, A.; and Skiena, S. 2005. Finding sets of
we will explore how what is popular in the news and blogs
                                                                          synonymous names across documents in a large corpus. in prepa-
over a larger time scale (weekly, monthly, yearly) changes.               ration.
We will also try to separate background noise from discus-
                                                                          McKeown, K.; Barzilay, R.; Evans, D.; Hatzivassiloglou, V.; Kla-
sion that is generated by outside events in blogspace and                 vans, J.; Nenkova, A.; Sable, C.; Schiffman, B.; and Sigelman,
correlate these events with reporting in the news. Finally,               S. 2002. Tracking and summarizing news on a daily basis with
we are building a sentiment extraction system tuned to work               columbia’s newsblaster. In Proceedings of HLT 2002 Human
well on blogs, taking into account features that are unique to            Language Technology Conference.
blogs such as emoticons and emotion-conveying capitaliza-                 Mehler, A.; Wang, Y.; Bao, Y.; Li, X.; and Skiena, S. 2005.
tion.                                                                     Heatmaps: Showing the geographic location of interest in entities
                                                                          in the news. in preparation.
                  Acknowledgements                                        Nardi, B.; Schiano, D.; and Gumbrecht, M. 2004. Blogging as
We thank Alex Kim for his help in developing the pipeline,                social activity, or, would you let 900 million people read your
Manjunath Srinivasaiah for his work on making the pipeline                diary? In ACM Conference on Computer Supported Cooperative
                                                                          Work, 222–231.
more efficient, Andrew Mehler for his Bayesian classifier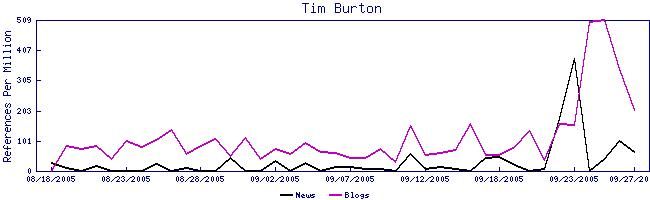
You can also read