NextEra Energy Partners, LP - October 2017 Investor Presentation
←
→
Page content transcription
If your browser does not render page correctly, please read the page content below
NextEra Energy Partners, LP
    October 2017 Investor Presentation

1
Cautionary Statements And Risk Factors That May Affect Future Results This presentation includes forward-looking statements within the meaning of the federal securities laws. Actual results could differ materially from such forward- looking statements. The factors that could cause actual results to differ are discussed in the Appendix herein and in NextEra Energy Partners’ SEC filings. Non-GAAP Financial Information This presentation refers to certain financial measures that were not prepared in accordance with U.S. generally accepted accounting principles. Reconciliations of historical non-GAAP financial measures to the most directly comparable GAAP financial measures can be found in the Appendix herein. Other See Appendix for definition of Adjusted EBITDA and CAFD expectations. 2
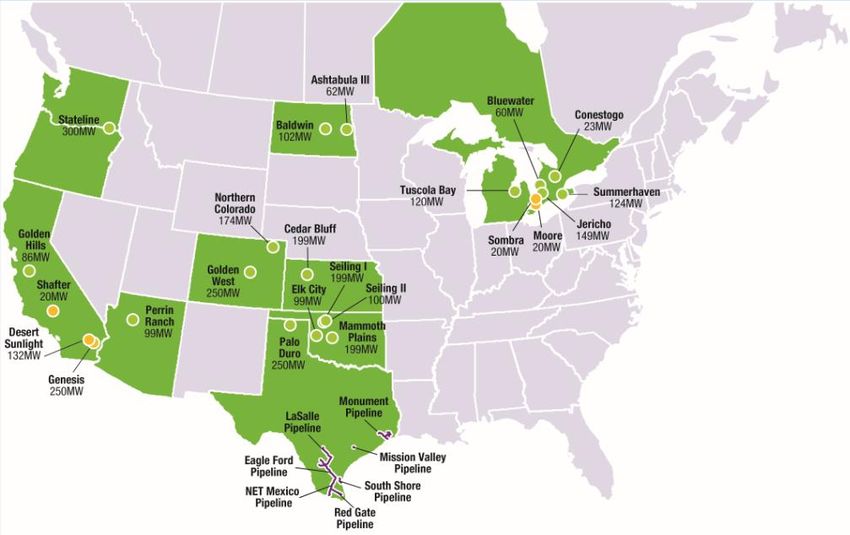
NextEra Energy Partners is a best-in-class diversified clean
        energy growth company

                             NextEra Energy Partners’ Portfolio(1)
•       Stable cash flows supported by:
         – Long-term contracts with credit-
           worthy counterparties
         – Geographic and asset diversity
•       ~3,700 MW of renewables(2)
         – ~3,100 MW wind
         – ~600 MW solar
•       ~4 Bcf total natural gas pipeline
        capacity
         – Seven natural gas pipelines
         – ~542 miles
                                                                                                                      •   Wind assets
         – ~3 Bcf of contracted capacity                                                                              •   Solar assets
                                                                                                                      •   Pipeline assets

                      Solid distribution growth through accretive acquisitions

         1) Portfolio as of October 26, 2017; excludes non-economic ownership interest in equity method investments
    3    2) Includes acquisition of 691 MW announced on October 26, 2017 that is expected to close by year-end 2017
Since the IPO, NEP has grown distributions by ~109% and
delivered total unitholder return of 71%
Annualized Total Unitholder Return
LP Distributions(1) NEP vs. Indices
$1.57
100%
90%
80% 71%
70%
60%
50%
40% 40%
40%
30%
$0.75
20%
10%
Yie
0%
-10% (6%)
(2)
NEP S&P 500 S&P 500 YieldCo
(3)
Utilities Average
Index
1) Annualized basis; refer to distributions payable on the NextEra Energy Partners Investor Relations website
2) Reflects total unitholder return, assuming dividend reinvestment, as of October 26, 2017 since the IPO dated June
27, 2014 based on the IPO price of $25
3) Reflects average total shareholder return, assuming dividend reinvestment, for CAFD, TERP, ABY, PEGI,
NYLD.A as of October 26, 2017 since the IPO date assuming IPO price
4 Note: All other data is total shareholder return, assuming dividend reinvestment, as of October 26, 2017 since June
27, 2014. Source: BloombergNEP’s value proposition is built upon four core strengths
NextEra Energy Partners’ Core Strengths
High-Quality Portfolio(1) Financial Strength and Flexibility
Issuer Credit
~3.7 GW Rating(4) Year-end 2017E
18-Yr A3 Renewables >90% Ba1/BB/BB+
Remaining Counterparty
Capacity of Project Debt ~1.2x
& Tax Equity supports 4x-5x Coverage
Contract Life(2) Credit(2,3) ~4 Bcf Is Amortizing(1) Holdco debt / project Ratio(5)
Pipeline Capacity CAFD
Tax-Advantaged Structure(6) Opportunities For Growth
≥8 years Treated as C-Corp Clean energy
assets at
≥15 years Potential return of for U.S federal tax
Energy Organic
Not expected to
capital treatment purposes with
prospects for 3rd Party
pay significant
for distributions to
the extent of
Form 1099 Resources, Texas Pipelines acquisitions
U.S. federal taxes for investors including future and Repowerings
investor’s tax development
basis (vs K1)
1) Includes acquisition of 691 MW announced on October 26, 2017 that is expected to close by year-end 2017
2) Weighted on calendar year 2018 Cash Available for Distribution (CAFD) expectations for expected portfolio as of December 31, 2017
3) Moody’s Rating related to firm contract counterparties
4) Moody’s, Standard & Poor’s, and Fitch ratings, respectively
5) Assumes calendar year 2018 expectations for forecasted portfolio as of 12/31/17, divided by the product of
annualized LP distributions of $1.58-1.62 and 156 MM outstanding units, plus distributions made to the Series A
Preferred Units
6) As of September 30, 2017, except otherwise noted; should not be construed as tax advice
5NEP’s structure creates tax advantages similar to MLPs
Structural Tax Advantages
Federal Income Earnings & Profits C-Corp for Tax
Tax Shield Tax Shield Purposes
• Driven by existing and • NEP distributions are • Investors receive a
future NOLs treated as “return of 1099-DIV as opposed
generated primarily capital” up to an to K-1
through MACRS investor’s outside basis
depreciation of • Receipt of 1099
acquired assets • Return of capital avoids issues with
offsetting taxable treatment applies as holding NEP in a
income long as NEP has deferred tax account
negative current (IRA or 401K) that are
“earnings and profits” common to K-1s
NEP is not expected to pay LP investors are not expected NEP has a broad universe of
meaningful U.S. taxes for at to pay taxes on distributions potential investors
least 15 years for at least 8 years
6 Note: As of September 30, 2017; should not be construed as tax adviceNEP continues to focus on investing in clean energy assets
with stable cash flows
Asset Suitability
Long-Term Contract
Clean Energy Technology
Creditworthy Counterparty “NEP-Able”
Asset
Stable Regulatory Environment
Limited or Monetized Tax Credits
Strong Operations
Any clean energy asset that fits these criteria may be suitable for
acquisition by NEP
7With continued technology improvements and cost
declines, wind and solar are expected to be competitive into
the next decade
Wind and Solar Technology
Levelized Cost of Levelized Cost of
Electricity from Wind Electricity from Solar
(Including Production Tax Credits) (Including Investment Tax Credits)
$/MWh $/MWh
$70 $160
$140-$150
$55-$65 $140
$60
$120
$50
$100 $95-$105
$40 $36-$42
$80 $73-$83
$30
$21-$27 $60
$20 $16-$22 $39-$47
$12-$18 $40 $25-$35
$10 $20
$0 (2)
$0
(1) (1) (1) (1)
2010 2012 2014 2016 2020 2010(3) 2012 (3) 2014 (3) 2016(3) 2020(2)
1) Source: U.S. Department of Energy, 2015 Wind Technologies Market Report – August 2016
2) Energy Resources’ estimate
3) Source: IHS Markit. The use of this content was authorized in advance. Any further use or redistribution of this
8 content is strictly prohibited without written permission by IHS Markit. All rights reservedDemand for both wind and solar energy is expected to be
robust through the end of the decade
Industry Estimates of
Wind & Solar Market Potential 2017 - 2020(1)
Wind Additions Solar Additions
45 45
40
40 37 Avg: 36 GW 40
35
35 32 35
30 30
25 26
GW 25 GW 25 24
Avg: 22 GW
20 20
15 15 13
10 10
5 5
0 0
BNEF IHS MAKE
Make ABB/Ventyx BNEF IHS GTM ABB/Ventyx
Roughly 60 GW of combined wind and solar are projected to be added in
the U.S. through 2020
1) Sources: Bloomberg New Energy Finance; IHS Markit. The use of this content was authorized in advance. Any
further use or redistribution of this content is strictly prohibited without written permission by IHS Markit; MAKE;
ABB EPM Advisors Spring 2017 North American Reference Case; GTM Research U.S. Solar Market Insight
9 Report, Q2 2017Battery efficiency improvements and cost declines are
expected to expand the storage market and enable even
greater renewables expansion
Storage Technology
Lithium-ion 4-Hour
Battery Pack Cost(1) Battery Storage Adder(2)
$/kWh $/MWh
$1,200 $80 $71-$81
$1,000 $70
$1,000
$60
$800 $45-$55
$50
$642 $38- $48
$600 $540 $40
$30
$400 $19-$29
$273 $20 $12-$22
$200 $172
$10
$0 $0
2010 2012 2014 2016 2020 2010 2012 2014 2016 2020
1) Source: Bloomberg New Energy Finance
2) Energy Resources’ Estimate. Assumes: 4 hour battery storage at 40% of nameplate solar capacity. Total battery
10 system costs calculated as two times Bloomberg New Energy Finance battery pack costThe all-in cost of wind and solar will continue to compete
with existing generation resources as tax credits phase
down
Estimated Costs of Generation Resources Post – 2020(1)
(cents/kWh)
4 - 5¢ w/
storage adder 4 - 5¢
3.5 - 5¢
3 - 4¢ w/
storage adder 3 - 4¢
3 - 4¢
2 - 3¢
(2) (2)
New Wind New Solar New Combined Existing Coal Existing Nuclear
Cycle Gas
Excludes Tax Credits
Wind and solar combined with storage to firm and shape production is
expected to compete economically with other generation in the next decade
1) Energy Resources’ estimate
11 2) Represents operating cost per kWh including fuelAcquisitions from Energy Resources, organic growth and
third party M&A all provide NEP with clear visibility to future
growth
Growth Opportunities
Potential
Acquisition of
Potential Organic
Clean Energy Potential for 3rd
Prospects for
Assets at Energy Party
Texas Pipelines
Resources, Acquisitions
and Repowerings
Including Future
Development
12We have implemented certain governance changes at NEP
in order to enhance LP unitholder rights
Enhancing Unitholder Governance Rights
Prior Structure New Structure
• BOD at NEP GP • New BOD at NEP LP
Board of • Three Directors appointed by GP (NEE)
Directors • NEE appointed all Directors
• • Four Directors to be elected by LP unitholders
(BOD) NEP GP BOD oversees
management of NEP • NEP LP BOD oversees management of NEP
• NEP CEO nominates and NEP LP BOD approves a
slate of four Directors to stand for election
Nomination annually
• NEE nominates all Directors
Process • LP Unitholders with 10% voting interest given
proxy access rights to nominate up to two
Directors
• NEE and LP unitholders with more than 5% voting
power limited to 5% of votes for Directors
Voting • LP unitholders do not elect • First annual meeting of unitholders to elect
Process directors directors will be held on December 21, 2017
• LP unitholders elect the majority of the NEP LP
BOD
Governance changes give LP unitholders the ability to elect a majority of
NEP’s board
13NEP’s ongoing financing optimization is expected to
minimize the need for common equity
Optimizing The Capital Structure
Investor IDR Fee Low double-digit
Investor
Demand Modification ROEs on acquisitions
Demand
Access
Access to Utilized high-yield
Dividend Alternative
to Low
Low Cost Financing debt, convertible
Growth Cost of Sources debt, and convertible
of Capital
Capital preferred units
Credit ratings
Accretive Credit &
Accretive Leverage support flexibility to
Acquisitions
Acquisitions Targets finance 2018-2019
growth
14NEP’s credit ratings increase financing flexibility and debt
capacity due to greater market access
Corporate Credit Rating and Debt Capacity
• NEP corporate credit
ratings:
High-Yield
Term Loan B
Moody’s S&P Fitch Debt Revolving
Credit
Ba1 BB BB+ Convertible
Facility
Stable Stable Stable Preferred
Optimal Capital Structure Bank
for Distribution Growth Term
Loans
• Credit profile should Convertible
support HoldCo debt of 4.0x Debt PAYGO
Tax
Project
to 5.0x project distributions Equity Financing/ Equity
Refinancing
New Opportunities Utilized Products
NEP continues to analyze and evaluate new opportunities for financing its
long-term growth
15NEP’s ongoing financing initiatives are expected to
minimize the need for common equity
NEP Financing Update
• $550 MM Convertible Preferred Offering
– 4.50% coupon
– 15% conversion premium
• $300 MM Convertible Debt/Capped Call Transaction
– 1.5% coupon for 3 years
– Initial conversion rate represents a 25% premium to closing unit price
– Capped call could provide upside similar to notes being offered with a 50%
conversion premium
• Refinanced ~$1.1 B HoldCo debt balance with senior unsecured
notes at historically low yields
– 4.25% coupon, 7-year tranche for $550 MM
– 4.50% coupon, 10-year tranche for $550 MM
• Amendments to existing revolving credit facility
– Upsizing from $250 MM to $750 MM
– Extending maturity from 2019 to 2022
16NextEra Energy Partners
Adjusted EBITDA and CAFD Expectations(1)
Adjusted
EBITDA CAFD
12/31/17 Run Rate(2) $875 - $975 MM $310 - $340 MM
12/31/18 Run Rate(3) $1,050 - $1,200 MM $360 - $400 MM
Unit Distributions
2017(4) $1.58 - $1.62 annualized rate by year-end
2016 – 2022(5) 12% - 15% average annual growth
1) See Appendix for definition of Adjusted EBITDA and CAFD expectations
2) Reflects calendar year 2018 expectations for forecasted portfolio as of 12/31/17
3) Reflects calendar year 2019 expectations for forecasted portfolio as of 12/31/18; includes announced portfolio,
plus expected impact of additional acquisitions not yet identified
4) Represents expected fourth quarter annualized distributions payable in February of the following year
17 5) From a base of our fourth quarter 2016 distribution per common unit at an annualized rate of $1.41We believe NEP offers a superior value proposition and is
better positioned than ever to deliver upon its long-term
expectations
Investor Total Return Potential
•
Opportunity to earn a total return of
~4% 16% - 19% roughly 16% - 19% per year through
at least 2022
12% - 15% • Diversified portfolio with stable cash
flows
• High visibility into available growth
options to support DPU growth
• Disciplined approach to capital
allocation
• Flexible capital structure to finance
future growth
Distribution Distribution Annual Total
• Strong corporate governance
Growth Yield(1) Return • A proven and experienced
Through At Potential
Least 2022
management team that has a long
track record of delivering results
Aside from any modest issuances executed through the ATM, NEP is not
expected to need to sell common equity until 2020 at the earliest
18 1) Based on NextEra Energy Partners‘ distribution yield as of October 26, 2017Appendix 19
We continue to execute on our plan to expand NextEra Energy
    Partners’ portfolio

                 NextEra Energy Partners – Portfolio Additions
•   Acquisition from NEE is expected to close by year-end
                                                                                                               Contract
                      Project                      Resource                MW               COD               Expiration(1)
                Desert Sunlight                      Solar                142.5             2014                 2037
                Brady I                              Wind                 149.7             2016                 2046
                Brady II                             Wind                 149.0             2016                 2046
                Javelina I                           Wind                 249.7             2015                 2031
•   Expected purchase price:
         – Total consideration of ~$812 MM plus:
              – Assumption of ~$459 MM in tax equity liabilities
              – Considers ~$268 MM of existing non-recourse project debt related to Desert Sunlight
              – Subject to working capital and other adjustments
•   Expected 5-year average annual run rate contribution beginning
    12/31/2017:
         – Adjusted EBITDA $185 – $205 MM
         – CAFD of $79 – $89 MM
         1) Weighted average contract expiration for Desert Sunlight and Javelina power purchase agreements
    20
NEP’s portfolio is comprised of ~3.7 GW of renewable
assets plus seven natural gas pipelines with a ~18 year
weighted average remaining contract life
Portfolio Overview(1)
Project COD Location Net MW Technology Counterparty Credit PPA Life
Ashtabula III Dec-10 ND 62 Wind A3 21
Baldwin Dec-10 ND 102 Wind Baa1 24
Bluewater Jul-14 ON 60 Wind Aa2 17
Brady I Nov-16 ND 150 Wind Baa1 29
Brady II Dec-16 ND 149 Wind Baa1 29
Cedar Bluff Dec-15 KS 199 Wind Baa1 18
Conestogo Dec-12 ON 23 Wind Aa2 15
Elk City Dec-10 OK 99 Wind A3 12
Golden West Oct-15 CO 249 Wind A2 23
Golden Hills Dec-15 CA 86 Wind Aa2, N/A 18
Javelina Dec-15 TX 250 Wind Baa2, Aa2 14
Jericho Nov-14 ON 149 Wind Aa2 17
Mammoth Plains Dec-14 OK 199 Wind Baa1 17
N. Colorado Aug-09 CO 174 Wind A3 16
Palo Duro Dec-14 TX 250 Wind Baa1 17
Perrin Ranch Jan-12 AZ 99 Wind A2 20
Seiling I Nov-14 OK 199 Wind A3 18
Seiling II Nov-14 OK 100 Wind A2 17
Stateline Dec-02 WA 300 Wind Baa2 9
Summerhaven Sep-13 ON 124 Wind Aa2 16
Tuscola Bay Dec-12 MI 120 Wind A2 15
Desert Sunlight 250 Dec-14 CA 125 Solar A2 17
Desert Sunlight 300 Dec-14 CA 150 Solar A2 22
Genesis Mar-14 CA 250 Solar A2 21
Shafter May-15 CA 20 Solar A2 18
Moore Feb-12 ON 20 Solar Aa2 14
Sombra Feb-12 ON 20 Solar Aa2 14
Total Renewables 3,727 19
Net Midstream Dec-14 TX 3.6 Bcf/d(2)
Natual Gas Pipeline Baa3(3) 14
Total Portfolio 18(4)
1) Includes acquisition of 691 MW announced on October 26, 2017 that is expected to close by year-end 2017
2) Contracted pipeline capacity
3) Average rating of NET Midstream contract counterparties
4) Weighted on calendar year 2018 Cash Available for Distribution (CAFD) expectations for portfolio as of
12/31/2017. See appendix for definition of CAFD expectationsU.S. Federal tax incentives for renewables projects have
been extended into the next decade
Extended U.S. Federal Tax Credits
Wind Production Solar Investment
Tax Credit (PTC) Tax Credit (ITC)
Start of Start of
Construction COD Wind Construction Solar
Date Deadline PTC Date ITC
During 2016 12/31/2020 100% Prior to 1/1/2020 30%
During 2017 12/31/2021 80% During 2020 26%
During 2018 12/31/2022 60% During 2021 22%
During 2019 12/31/2023 40% 2022 and beyond 10%
• For wind PTC, the IRS provided additional guidance in 2016
– Continuity of safe harbor is satisfied for a facility if COD occurs no more
than four calendar years after the calendar year that construction began
– Safe harbor is provided for certain repowered facilities
Energy Resources’ safe harbor purchases could qualify over
10 GW of new wind for 100% of the PTC from 2017 to 2020
22NEP’s tax shield creates the need to employ tax equity
financing for projects that generate a large portion of their
economics from tax credits
PAYGO Tax Equity Financing
• Tax equity financing is used Project Cash Flow Split(1)
to monetize tax attributes
• Under tax equity, an investor
makes an up-front payment 8%-12%
– Pre-payment for tax 30%-35%
depreciation, 70% - 75% of
expected PTCs, and a small
portion of project cash Reported
NEP
• Additionally, the investor 55%-60% CAFD
makes PAYGO payments
– 25% - 30% of annual PTCs that
enhance asset cash flow profile
• Project cash not paid to the
investor and PAYGO Tax Equity Share of Project Cash
payments make up total NEP's Cash From PAYGO Payments
CAFD NEP's Share of Project Cash
23 1) Cash flow splits are shown on a pre-tax basisIn June 2017, NEP announced an agreement to issue
$550 MM of convertible preferred securities
Convertible Preferred Offering(1)
• NEP’s 4.50% coupon is the Coupon at Issuance(2)
lowest ever for a preferred
security in the MLP or Yieldco 10.75%
sector 9.5%
10.0%
• Provides a low cash cost of 8.0% 8.0%
8.5% 8.5%
funds that is comparable to 6.5%
Holdco debt
4.5% 4.75%
• No right to convert to common
equity until 2019
– 15% conversion premium
– NEP forced conversion rights NEP
begin in 2018 at up 20%
• Receives various levels of
treatment from credit rating
agencies
1) Refer to SEC filings for additional detail of convertible preferred offering
2) Source: Company filings
24 Note: Funds to be drawn by 12/31/17NEP has issued $300 MM of convertible debt and entered
into a capped call transaction in connection with the offering
Convertible Debt/Capped Call Transaction
• Low 1.5% coupon for 3 years Impact of NEP Unit Price
• Initial conversion rate At Conversion(1)
represents a 25% premium $65 Cap Price ~$63.44 (up 50%)
to closing unit price
$60 Bond converts up 25%,
– Priced near 52-week high NEP receives additional consideration under
• Structured to allow an capped call between up 25% and up 50%
$55
approximate 15% annualized Conversion Rate/Lower Strike ~$52.86 (up 25%)
growth rate in distributions
$50
• Capped call could provide Bond settles in cash,
upside to NEP similar to NEP receives no value for capped call
notes being offered with a $45
Issuance Price $42.29
50% conversion premium
$40
1 2 3 4 5 6 7
Structured to provide potential equity upon conversion at a 25%
premium, while preserving economics as if issued up 50%
1) Capped call is settled over an 80 day period post conversion of the notes; NEP has the option to receive
settlement in cash or units to reduce dilution as if units were issued with a higher premium
25NEP has further de-risked LP distributions by refinancing its
existing ~$1.1 B HoldCo debt balance at attractive rates and
pushing its maturity into the middle of the next decade
NEP HoldCo Debt Refinancing
• NEP refinanced its ~$1.1 B NEP HoldCo Debt Maturity Profile
HoldCo debt balance with
$ MM
senior unsecured notes $700 Average maturity increased
by ~6.75 years
– 7-year tranche for $550 MM $600
– 10-year tranche for $550 MM $500
• The notes were priced at $400
historically low yields(1)
$300
– Tightest coupon and implied
credit spread for a Ba1/BB $200
USD 7-year issue at 4.25% $100
– Tightest coupon for a Ba1/BB
$0
USD 10-year issue at 4.50% 2018 2020 2022 2024 2026
Pre-Refinance Post Refinance
The transaction drew strong demand with ~5.5x subscription and
ultimate placement with over 140 accounts
26 1) Analysis obtained from Bank of America Merrill Lynch and BarclaysNEP has upsized its revolving credit facility while also
reducing borrowing costs, extending the maturity date and
increasing the size of its bank group
NEP Credit Revolver Changes
Old Revolver Amended Revolver
Facility Size $250 MM $750 MM
Pricing 3.0x Leverage Ratio(2): 225 bps 175 bps
4.0x Leverage Ratio(2): 250 bps 200 bps
(LIBOR+)(1) Max Leverage Ratio(2,3): 275 bps 225 bps
# of Banks 9 20
Maturity July 2019 October 2022
The new terms reduce NEP’s cost of capital and provide
additional liquidity consistent with NEP’s size and growth needs
1) Pricing includes facility fee + margin based on leverage ratio
2) Leverage ratio measured by HoldCo debt over project distributions (as adjusted under the Credit Agreement)
27 3) Maximum leverage ratio is 5.5xNEP’s holdco leverage to project distributions metric target
of 4.0x – 5.0x is consistent with its strong mid– to high–BB
credit ratings
Credit Metrics(1)
BB Target Target
(2)
S&P Range YE 2017 YE 2018
Holdco Debt/EBITDA 4.0x - 5.0x 3.0x - 4.0x 4.0x - 5.0x
Ba1 Target Target
(3)
Moody's Range YE 2017 YE 2018
Total Consolidated Debt/EBITDAExpected Cash Available for Distribution(1)
(December 31, 2017 Run Rate CAFD)
$960-$1,060 ($15-$25) ($60-$70)
$875-$975 ($240-$290)
($270-$320)
$ MM
($30-$35)
($3-$8) $310-$340
Project-Level Corporate IDR Fees Adjusted Debt Pre-Tax Non-Cash Maintenance Estimated
Adjusted Expenses EBITDA Service (2) Tax Credits (3) Income (4) Capital Pre-Tax
EBITDA CAFD (5)
1) See Appendix for definition of Adjusted EBITDA and CAFD expectations. Project-Level Adjusted EBITDA
represents Adjusted EBITDA before IDR Fees and Corporate Expenses
2) Debt service includes principal and interest payments on existing and projected third party debt and distributions
net of contributions to/from tax equity investors; excludes distributions to preferred equity investors
3) Pre-tax tax credits include investment tax credits, production tax credits earned by NEP, and production tax
credits allocated to tax equity investors
4) Primarily reflects amortization of CITC
29 5) CAFD excludes proceeds from financings and changes in working capitalExpected Cash Available for Distribution(1)
(December 31, 2018 Run Rate CAFD)
$1,150-$1,300 ($20-$30) ($75-$85)
$1,050-$1,200 ($240-$320)
($380-$460)
($30-$35) ($5-$15) $360-$400
Project-Level Corporate IDR Fees Adjusted Debt Pre-Tax Non-Cash Maintenance Estimated
(2) (3)
Adjusted Expenses EBITDA Service Tax Credits Income (4) Capital Pre-Tax
EBITDA CAFD (5)
1) See Appendix for definition of Adjusted EBITDA and CAFD expectations. Project-Level Adjusted EBITDA
represents Adjusted EBITDA before IDR Fees and Corporate Expenses
2) Debt service includes principal and interest payments on existing and projected third party debt and distributions
net of contributions to/from tax equity investors; excludes distributions to preferred equity investors
3) Pre-tax tax credits include investment tax credits, production tax credits earned by NEP, and production tax
credits allocated to tax equity investors
4) Primarily reflects amortization of CITC
30 5) CAFD excludes proceeds from financings and changes in working capitalDefinitional information NextEra Energy Partners, LP. Adjusted EBITDA and CAFD Expectations This presentation refers to adjusted EBITDA and CAFD expectations. NEP’s adjusted EBITDA expectations represent projected (a) revenue less (b) fuel expense, less (c) project operating expenses, less (d) corporate G&A, plus (e) other income less (f) other deductions including IDR fees. Projected revenue as used in the calculations of projected EBITDA represents the sum of projected (a) operating revenues plus (b) a pre-tax allocation of production tax credits, plus (c) a pre-tax allocation of investment tax credits plus (d) earnings impact from convertible investment tax credits and plus (e) the reimbursement for lost revenue received pursuant to a contract with NextEra Energy Resources. CAFD is defined as cash available for distribution and represents adjusted EBITDA less (1) a pre-tax allocation of production tax credits, less (2) a pre-tax allocation of investment tax credits, less (3) earnings impact from convertible investment tax credits, less (4) debt service, less (4) maintenance capital, less (5) income tax payments less, (6) other non-cash items included in adjusted EBITDA if any. CAFD excludes changes in working capital and distributions to preferred equity investors. Project-level CAFD is defined as project-level cash available for distribution and represents CAFD plus (1) corporate expenses, plus (2) IDR fees, plus (3) HoldCo interest expense. NextEra Energy Partners' expectations of 12/31/17 and 12/31/18 run rate adjusted EBITDA and CAFD reflect the consummation of forecasted acquisitions. These measures have not been reconciled to GAAP net income because NextEra Energy Partners did not prepare estimates of the effect of these acquisitions on certain GAAP line items that would be necessary to provide a forward-looking estimate of GAAP net income, and the information necessary to provide such a forward-looking estimate is not available without unreasonable effort. 31
Cautionary Statement And Risk Factors That May Affect
   Future Results
This presentation contains “forward-looking statements” within the meaning of the federal securities laws. Forward-looking statements are
not statements of historical facts, but instead represent the current expectations of NextEra Energy Partners, LP (together with its
subsidiaries, NEP) regarding future operating results and other future events, many of which, by their nature, are inherently uncertain and
outside of NEP’s control. Forward-looking statements in this presentation include, among others, statements concerning cash available
for distributions expectations and future operating performance. In some cases, you can identify the forward-looking statements by words
or phrases such as “will,” “may result,” “expect,” “anticipate,” “believe,” “intend,” “plan,” “seek,” “aim,” “potential,” “projection,” “forecast,”
“predict,” “goals,” “target,” “outlook,” “should,” “would” or similar words or expressions. You should not place undue reliance on these
forward-looking statements, which are not a guarantee of future performance. The future results of NEP and its business and financial
condition are subject to risks and uncertainties that could cause NEP’s actual results to differ materially from those expressed or implied
in the forward-looking statements, or may require it to limit or eliminate certain operations. These risks and uncertainties include, but are
not limited to, the following: NEP has a limited operating history and its projects include renewable energy projects that have a limited
operating history. Such projects may not perform as expected; NEP's ability to make cash distributions to its unitholders is affected by
wind and solar conditions at its renewable energy projects; NEP's business, financial condition, results of operations and prospects can
be materially adversely affected by weather conditions, including, but not limited to, the impact of severe weather; Operation and
maintenance of renewable energy projects involve significant risks that could result in unplanned power outages, reduced output,
personal injury or loss of life; Natural gas gathering and transmission activities involve numerous risks that may result in accidents or
otherwise affect the Texas pipelines’ operations; NEP depends on the Texas pipelines and certain of the renewable energy projects in its
portfolio for a substantial portion of its anticipated cash flows; NEP is pursuing the expansion of natural gas pipelines in its portfolio that
will require up-front capital expenditures and expose NEP to project development risks; NEP's ability to maximize the productivity of the
Texas pipeline business and to complete potential pipeline expansion projects is dependent on the continued availability of natural gas
production in the Texas pipelines’ areas of operation; Terrorist or similar attacks could impact NEP's projects, pipelines or surrounding
areas and adversely affect its business; The ability of NEP to obtain insurance and the terms of any available insurance coverage could
be materially adversely affected by international, national, state or local events and company-specific events, as well as the financial
condition of insurers. NEP's insurance coverage does not insure against all potential risks and it may become subject to higher insurance
premiums; Warranties provided by the suppliers of equipment for NEP's projects may be limited by the ability of a supplier to satisfy its
warranty obligations, or by the terms of the warranty, so the warranties may be insufficient to compensate NEP for its losses; Supplier
concentration at certain of NEP's projects may expose it to significant credit or performance risks; NEP relies on interconnection and
transmission facilities of third parties to deliver energy from its renewable energy projects and, if these facilities become unavailable,
NEP's wind and solar projects may not be able to operate or deliver energy; If third-party pipelines and other facilities interconnected to
the Texas pipelines become partially or fully unavailable to transport natural gas, NEP's revenues and cash available for distribution to
unitholders could be adversely affected; NEP's business is subject to liabilities and operating restrictions arising from environmental,
health and safety laws and regulations, compliance with which may require significant capital expenditures, increase NEP’s cost of
operations and affect or limit its business plans; NEP's renewable energy projects may be adversely affected by legislative changes or a
failure to comply with applicable energy regulations;

    32
Cautionary Statement And Risk Factors That May Affect
Future Results (cont.)
A change in the jurisdictional characterization of some of the Texas pipeline entities' assets, or a change in law or regulatory policy, could
result in increased regulation of these assets, which could have a material adverse effect on NEP's business, financial condition, results
of operations and ability to make cash distributions to its unitholders; NEP may incur significant costs and liabilities as a result of pipeline
integrity management program testing and any necessary pipeline repair or preventative or remedial measures; The Texas pipelines’
operations could incur significant costs if the Pipeline and Hazardous Materials Safety Administration or the Railroad Commission of
Texas adopts more stringent regulations; Petroleos Mexicanos (Pemex) may claim certain immunities under the Foreign Sovereign
Immunities Act and Mexican law, and the Texas pipeline entities' ability to sue or recover from Pemex for breach of contract may be
limited and may be exacerbated if there is a deterioration in the economic relationship between the U.S. and Mexico; NEP does not own
all of the land on which the projects in its portfolio are located and its use and enjoyment of the property may be adversely affected to the
extent that there are any lienholders or leaseholders that have rights that are superior to NEP's rights or the U.S. Bureau of Land
Management suspends its federal rights-of-way grants; NEP is subject to risks associated with litigation or administrative proceedings that
could materially impact its operations, including, but not limited to, proceedings related to projects it acquires in the future; NEP's wind
projects located in Canada are subject to Canadian domestic content requirements under their Feed-in-Tariff contracts; NEP's cross-
border operations require NEP to comply with anti-corruption laws and regulations of the U.S. government and non-U.S. jurisdictions;
NEP is subject to risks associated with its ownership or acquisition of projects or pipelines that remain under construction, which could
result in its inability to complete construction projects on time or at all, and make projects too expensive to complete or cause the return
on an investment to be less than expected; NEP relies on a limited number of customers and is exposed to the risk that they are unwilling
or unable to fulfill their contractual obligations to NEP or that they otherwise terminate their agreements with NEP; NEP may not be able
to extend, renew or replace expiring or terminated power purchase agreements (PPA) at favorable rates or on a long-term basis; NEP
may be unable to secure renewals of long-term natural gas transportation agreements, which could expose its revenues to increased
volatility; If the energy production by or availability of NEP's U.S. renewable energy projects is less than expected, they may not be able to
satisfy minimum production or availability obligations under the U.S. Project Entities’ PPAs; NEP's growth strategy depends on locating
and acquiring interests in additional projects consistent with its business strategy at favorable prices; NextEra Energy Operating Partners’
(NEP OpCo) partnership agreement requires that it distribute its available cash, which could limit NEP’s ability to grow and make
acquisitions; Lower prices for other fuel sources may reduce the demand for wind and solar energy; Reductions in demand for natural gas
in the United States or Mexico and low market prices of natural gas could materially adversely affect the Texas pipelines’ operations and
cash flows; Government laws, regulations and policies providing incentives and subsidies for clean energy could be changed, reduced or
eliminated at any time and such changes may negatively impact NEP's growth strategy; NEP's growth strategy depends on the
acquisition of projects developed by NextEra Energy, Inc. (NEE) and third parties, which face risks related to project siting, financing,
construction, permitting, the environment, governmental approvals and the negotiation of project development agreements; Acquisitions
of existing clean energy projects involve numerous risks; Renewable energy procurement is subject to U.S. state and Canadian provincial
regulations, with relatively irregular, infrequent and often competitive procurement windows; NEP may continue to acquire other sources
of clean energy and may expand to include other types of assets. Any further acquisition of non-renewable energy projects may present
unforeseen challenges and result in a competitive disadvantage relative to NEP's more-established competitors; NEP faces substantial
competition primarily from regulated utilities, developers, independent power producers, pension funds and private equity funds for
opportunities in North America;
33Cautionary Statement And Risk Factors That May Affect
Future Results (cont.)
The natural gas pipeline industry is highly competitive, and increased competitive pressure could adversely affect NEP's business; NEP
may not be able to access sources of capital on commercially reasonable terms, which would have a material adverse effect on its ability
to consummate future acquisitions; Restrictions in NEP and its subsidiaries‘ financings could adversely affect NEP's business, financial
condition, results of operations and ability to make cash distributions to its unitholders; NEP's cash distributions to its unitholders may be
reduced as a result of restrictions on NEP's subsidiaries’ cash distributions to NEP under the terms of their indebtedness; NEP's
subsidiaries’ substantial amount of indebtedness may adversely affect NEP's ability to operate its business, and its failure to comply with
the terms of its subsidiaries' indebtedness could have a material adverse effect on NEP's financial condition; Currency exchange rate
fluctuations may affect NEP's operations; NEP is exposed to risks inherent in its use of interest rate swaps; NEE exercises significant
influence over NEP; NEP receives credit support from NEE and its affiliates. NEP's subsidiaries may default under contracts or become
subject to cash sweeps if credit support is terminated, if NEE or its affiliates fail to honor their obligations under credit support
arrangements, or if NEE or another credit support provider ceases to satisfy creditworthiness requirements, and NEP will be required in
certain circumstances to reimburse NEE for draws that are made on credit support; NextEra Energy Resources, LLC (NEER) or one of its
affiliates is permitted to borrow funds received by NEP's subsidiaries and is obligated to return these funds only as needed to cover
project costs and distributions or as demanded by NEP OpCo. NEP's financial condition and ability to make distributions to its unitholders,
as well as its ability to grow distributions in the future, is highly dependent on NEER’s performance of its obligations to return all or a
portion of these funds; NEP may not be able to consummate future acquisitions; NEER's right of first refusal may adversely affect NEP's
ability to consummate future sales or to obtain favorable sale terms; NextEra Energy Partners GP, Inc. (NEP GP) and its affiliates may
have conflicts of interest with NEP and have limited duties to NEP and its unitholders; NEP GP and its affiliates and the directors and
officers of NEP are not restricted in their ability to compete with NEP, whose business is subject to certain restrictions; NEP may only
terminate the Management Services Agreement among, NEP, NextEra Energy Management Partners, LP (NEE Management), NEP
OpCo and NextEra Energy Operating Partners GP, LLC (NEP OpCo GP) under certain specified conditions; If the agreements with NEE
Management or NEER are terminated, NEP may be unable to contract with a substitute service provider on similar terms; NEP's
arrangements with NEE limit NEE’s potential liability, and NEP has agreed to indemnify NEE against claims that it may face in connection
with such arrangements, which may lead NEE to assume greater risks when making decisions relating to NEP than it otherwise would if
acting solely for its own account; NEP's ability to make distributions to its unitholders depends on the ability of NEP OpCo to make cash
distributions to its limited partners; If NEP incurs material tax liabilities, NEP's distributions to its unitholders may be reduced, without any
corresponding reduction in the amount of the IDR fee; Holders of NEP’s common units may be subject to voting restrictions; NEP’s
partnership agreement replaces the fiduciary duties that NEP GP and NEP’s directors and officers might have to holders of its common
units with contractual standards governing their duties; NEP’s partnership agreement restricts the remedies available to holders of NEP's
common units for actions taken by NEP’s directors or NEP GP that might otherwise constitute breaches of fiduciary duties; Certain of
NEP’s actions require the consent of NEP GP;
34Cautionary Statement And Risk Factors That May Affect
Future Results (cont.)
Holders of NEP's common units currently cannot remove NEP GP without NEE’s consent; NEE’s interest in NEP GP and the control of
NEP GP may be transferred to a third party without unitholder consent; The IDR fee may be assigned to a third party without unitholder
consent; NEP may issue additional units without unitholder approval, which would dilute unitholder interests; Reimbursements and fees
owed to NEP GP and its affiliates for services provided to NEP or on NEP's behalf will reduce cash distributions to or from NEP OpCo
and from NEP to NEP's unitholders, and the amount and timing of such reimbursements and fees will be determined by NEP GP and
there are no limits on the amount that NEP OpCo may be required to pay; Discretion in establishing cash reserves by NEP OpCo GP may
reduce the amount of cash distributions to unitholders; NEP OpCo can borrow money to pay distributions, which would reduce the
amount of credit available to operate NEP's business; Increases in interest rates could adversely impact the price of NEP's common units,
NEP's ability to issue equity or incur debt for acquisitions or other purposes and NEP's ability to make cash distributions to its unitholders;
The price of NEP's common units may fluctuate significantly and unitholders could lose all or part of their investment; The liability of
holders of NEP's common units, which represent limited partnership interests in NEP, may not be limited if a court finds that unitholder
action constitutes control of NEP's business; Unitholders may have liability to repay distributions that were wrongfully distributed to them;
Provisions in NEP’s partnership agreement may discourage or delay an acquisition of NEP that NEP unitholders may consider favorable,
which could decrease the value of NEP's common units, and could make it more difficult for NEP unitholders to change NEP's board of
directors; NEP’s board of directors, a majority of which may be affiliated with NEE, decides whether to retain separate counsel,
accountants or others to perform services for NEP; The New York Stock Exchange does not require a publicly traded limited partnership
like NEP to comply with certain of its corporate governance requirements; Issuance of the Series A convertible preferred units will dilute
common unitholders’ ownership in NEP and may decrease the amount of cash available for distribution for each common unit; The Series
A convertible preferred units will have rights, preferences and privileges that are not held by, and will be preferential to the rights of,
holders of the common units; NEP's future tax liability may be greater than expected if NEP does not generate net operating losses
(NOLs) sufficient to offset taxable income or if tax authorities challenge certain of NEP's tax positions; NEP's ability to use NOLs to offset
future income may be limited; NEP will not have complete control over NEP's tax decisions; A valuation allowance may be required for
NEP's deferred tax assets; Distributions to unitholders may be taxable as dividends; Unitholders who are not resident in Canada may be
subject to Canadian tax on gains from the sale of common units if NEP’s common units derive more than 50% of their value from
Canadian real property at any time. NEP discusses these and other risks and uncertainties in its current report on Form 8-K filed August
7, 2017, and other SEC filings, and this presentation should be read in conjunction with such SEC filings made through the date of this
presentation. The forward-looking statements made in this presentation are made only as of the date of this presentation and NEP
undertakes no obligation to update any forward-looking statements.
35You can also read