NLRC5/CITA expression correlates with efficient response to checkpoint blockade immunotherapy - Nature
←
→
Page content transcription
If your browser does not render page correctly, please read the page content below
www.nature.com/scientificreports
OPEN NLRC5/CITA expression
correlates with efficient
response to checkpoint blockade
immunotherapy
Sayuri Yoshihama1,2, Steven X. Cho3, Jason Yeung1, Xuedong Pan4, Gregory Lizee 5
,
Kranti Konganti6, Valen E. Johnson4 & Koichi S. Kobayashi1,3*
Checkpoint blockade-mediated immunotherapy is emerging as an effective treatment modality for
multiple cancer types. However, cancer cells frequently evade the immune system, compromising the
effectiveness of immunotherapy. It is crucial to develop screening methods to identify the patients
who would most benefit from these therapies because of the risk of the side effects and the high
cost of treatment. Here we show that expression of the MHC class I transactivator (CITA), NLRC5,
is important for efficient responses to anti-CTLA-4 and anti-PD1 checkpoint blockade therapies.
Melanoma tumors derived from patients responding to immunotherapy exhibited significantly higher
expression of NLRC5 and MHC class I-related genes compared to non-responding patients. In addition,
multivariate analysis that included the number of tumor-associated non-synonymous mutations,
predicted neo-antigen load and PD-L2 expression was capable of further stratifying responders and
non-responders to anti-CTLA4 therapy. Moreover, expression or methylation of NLRC5 together with
total somatic mutation number were significantly correlated with increased patient survival. These
results suggest that NLRC5 tumor expression, alone or together with tumor mutation load constitutes
a valuable predictive biomarker for both prognosis and response to anti-CTLA-4 and potentially
anti-PD1 blockade immunotherapy in melanoma patients.
Checkpoint blockade immunotherapy has emerged as one of the most promising strategies to treat patients with
various cancers1,2. Although many successes in single or combinatory use of anti-CTLA-4, PD-1 or PD-L1/2
antibodies have been documented in a variety of malignancies, responses are only typically observed in a minor-
ity of patients for any given regimen3,4. Considering the substantial risk of autoimmune side effects and the high
cost of the t reatment5–7, it is critical to develop screening methods to identify the subsets of patients who would
most benefit from these therapeutics. While immunohistochemistry for PD-1/PD-L1 has been approved by the
FDA, neo-antigen load, copy number alterations, TCR sequencing, multi-parameter flow cytometry, SERPINB
mutations or nCounter gene expression profiling have been assessed for predicting responses to checkpoint
blockade therapies, their predictive power and usefulness as potential biomarkers are l imited8–11.
Successful cancer growth and progression relies on the combination of both suppression and evasion of the
host immune s ystem12. One of the major mechanisms of immune suppression in the tumor microenvironment
is through impaired effector T cell function and can occur through multiple mechanisms such as increased
expression of inhibitory immune checkpoint molecules, immunosuppressive enzymes and recruitment of immu-
nosuppressive immune c ells13. Similarly, immune evasion from CD8+ T cells through defects in the MHC class
I-mediated antigen presentation pathway is a common occurrence14–16, with MHC class I loss or reduction
reported in lung cancer (93%), prostate cancer (91%), cervical cancer (90%), pancreas cancer (86%), breast
cancer (84%), colorectal cancer (78%), among o thers14,17–21. Impaired MHC class I may manifest through many
1
Department of Microbial Pathogenesis and Immunology, Texas A&M Health Science Center, 415A Reynolds
Medical Building, College Station, TX 77843, USA. 2Department of Gastroenterology and Nephrology, Graduate
School of Medicine, Chiba University, Chiba 260‑8670, Japan. 3Department of Immunology, Graduate School of
Medicine, Hokkaido University, Kita 15, Nishi 7, Kita‑ku, Sapporo 060‑8638, Japan. 4Department of Statistics,
Texas A&M University, College Station, TX 77843, USA. 5Departments of Melanoma Medical Oncology and
Immunology, The University of Texas MD Anderson Cancer Center, Houston, TX 77054, USA. 6Texas A&M Institute
for Genome Science and Society, Texas A&M University, College Station, TX 77843, USA. *email: kskobayashi@
med.hokudai.ac.jp
Scientific Reports | (2021) 11:3258 | https://doi.org/10.1038/s41598-021-82729-9 1
Vol.:(0123456789)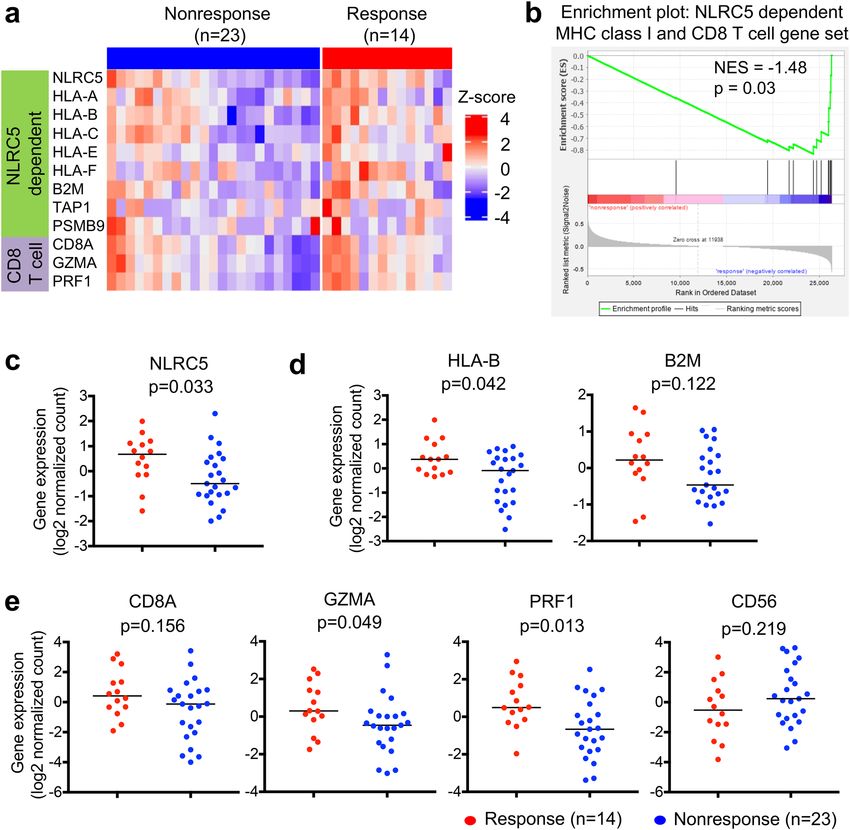
www.nature.com/scientificreports/
mechanisms such as loss of heterozygosity, gene mutations, epigenetic suppression or most importantly, down-
regulation at the transcriptional level14. Indeed it has recently been shown that the MHC class I transactivator
(CITA), NLRC522,23 is a major suppression target to facilitate immune evasion in multiple c ancers24. CITA/NLRC5
is an IFN-γ-inducible nuclear p rotein25–27 and transcriptionally regulates MHC class I gene activation via a CITA
enhanceosome complex that specifically associates with MHC class I gene promoters26,28,29. As a master transcrip-
tional activator of the MHC class I antigen presentation pathway, CITA/NLRC5-dependent MHC class I genes
include HLA-A,-B,-C,-E,-F as well as the immunoproteasome component LMP2 (PSMB9), peptide transporter
TAP1 and β2-microglobulin (B2M)23,26,29,30. The functional consequences of NLRC5 deficiency in vivo constitutes
failure of effective immune responses, accompanied with increased susceptibility to pathogen infection due to
reduced constitutive and inducible expression of MHC class I gene expression and subsequently poor CD8+ T
cell activation31–35. On the other hand, overexpression of NLRC5 in cancer models has demonstrated improved
tumor immunogenicity36. In human cancers, genetic and epigenetic changes in NLRC5 gene are associated with
impaired expression of MHC class I and related genes and reduced activity of CD8+ cytotoxic T cells24. Strik-
ingly, increased expression of NLRC5 is highly associated with improved 5-year survival of patients with skin,
rectal, bladder, uterine, cervical or head/neck cancers, thus showing NLRC5 expression is potentially valuable
as a prognostic m arker37.
Results
The expression of NLRC5 and MHC class I associated genes are correlated with response to
anti‑CTLA‑4 antibody therapy. Since NLRC5 expression is required for efficient cytotoxic CD8+ T cell
responses, we hypothesized that NLRC5 may be important for mediating the clinical benefits of cancer patients
treated with checkpoint inhibitors24,37. We analyzed and compared the gene expression level of NLRC5 and its
dependent genes in melanoma between the groups who benefitted from the treatment (responder) and who
did not benefit (non-responder). Among the melanoma patient cohort who received anti-CTLA-4 checkpoint
blockade therapy, we observed a reduction in the gene expression level of NLRC5-dependent MHC class I and
CD8+ T cell genes in non-responders versus responders (Fig. 1a). Gene set enrichment analysis indicated that
this NLRC5-dependent MHC class I and CD8+ T cell gene set was upregulated in responders (Fig. 1b). Among
these, we found that NLRC5 expression was significantly elevated in the group who benefitted from the anti-
CTLA-4 therapy (Fig. 1c). Because of the role of NLRC5 as a major regulator of MHC class I and related genes,
the expression of NLRC5 is correlated with HLA-B and B2M in various cancers24 as well as in this melanoma
patient cohort (Fig. S1). In addition to NLRC5, the responder group exhibited higher expression of HLA-B than
the non-responder group, and B2M showed a similar trend although it was not statistically significant with this
cohort size (Fig. 1d). NLRC5 is required for optimal recruitment and activation of CD8+ cytotoxic T cells in
cancers24,37. As expected, the expression of NLRC5 in various c ancers24 and in this melanoma cohort was also
correlated with the expression level of markers for CD8+ T cell activation, CD8A and granzyme A (GZMA)/
perforin (PRF1), but not CD56, a marker for NK cells (Fig. S1). The responder group exhibited higher expression
of GZMA and PRF1 (Fig. 1e). Although GZMA and PRF1 are expressed in both CD8+ T cells and NK cells, the
high expression of GZMA and PRF1 was likely due to activated CD8+ T cells rather than NK cells, since CD56
expression in the responder group was not significantly different than that of the non-responder group (Fig. 1e).
These data suggest that NLRC5 and NLRC5-mediated MHC class I dependent CD8+ T cell activation is impor-
tant for effective response to anti-CTLA-4 checkpoint blockade immunotherapy.
NLRC5 expression and load of mutation or neoantigen provide predictive information for the
response to anti‑CTLA‑4 therapy. It has been shown recently that neoantigen load is an important pre-
dictor of responses to anti-CTLA-4 therapy; high neoantigen loads in melanoma are correlated with favorable
responses to anti-CTLA-4 t herapy38. Similarly, the number of total mutations (mutation load), which has been
demonstrated to be highly correlated with neoantigen load in various cancers as well as samples in this cohort
(Fig. S2), is important in predicting response38,39. In order to test if the addition of mutation/neoantigen load to
NLRC5 expression would improve predictions, we performed multivariate analysis by logistic regression treating
these variables as covariates. Consistent with a previous r eport38, responding patients in this study also showed
higher neoantigen load and number of tumor-associated mutations (Fig. 2a). Scatter plots for NLRC5 expres-
sion combined with neoantigen load or mutation number showed non-responder groups were clearly separated
from responders (Fig. 2b). Patients were then stratified by NLRC5 expression and neoantigen load or number
of mutations, yielding four groups (high/high, high/low, low/high, and low/low). The response rate in the group
with low NLRC5 expression and low neoantigen load (or low mutation number) was significantly less than that
of the group with high NLRC5 expression and high neoantigen load (or high mutation number) (Fig. 2c). These
results suggest that two variables, NLRC5 expression and neoantigen load (or mutation number) may be use-
ful to jointly identify non-responders. ROC analysis based on the prediction equation from logistic regression
showed a substantial increase in the area under the curve (AUC) when mutation/neoantigen load was included
as a predictor in the regression model (Fig. 2d). For the model that included NLRC5 and mutation load, 100%
sensitivity was obtained at a 46% false positive rate (Fig. 2d, left). Without mutation load, a false positive rate of
91% was required to achieve 100% sensitivity. Similarly, false positive rate with 100% sensitivity was improved to
64% when neoantigen load was included as a predictor (Fig. 2d, right). These data further indicate that analysis
with two variables are useful to predict the patient population who will not respond to anti-CTLA-4 therapy.
Combination of PD‑L2 expression with NLRC5 expression and mutation or neoantigen load
are sensitive predictors for responses to anti‑CTLA‑4 therapy. Based on the superior performance
of our ROC curve analyses using NLRC5 and mutation or neoantigen load (Fig. 2d), we sought to further
Scientific Reports | (2021) 11:3258 | https://doi.org/10.1038/s41598-021-82729-9 2
Vol:.(1234567890)
www.nature.com/scientificreports/
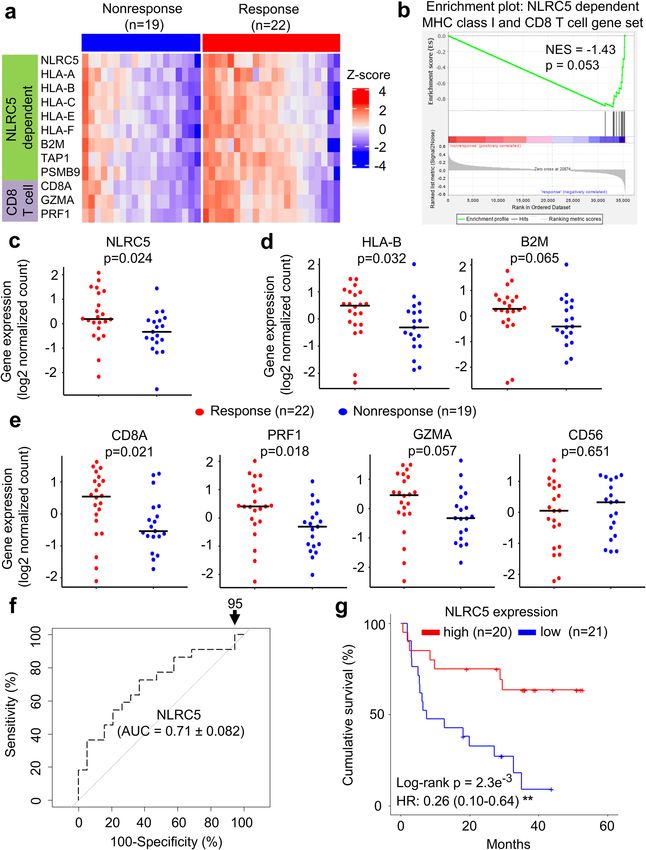
Figure 1. The expression of NLRC5-dependent MHC class I and CD8+ T cell genes are correlated with
response to anti-CTLA-4 antibody therapy. Patients groups who benefitted from anti-CTLA4 antibody therapy
(Response, n = 14) and who did not (Nonresponse, n = 23) were analyzed for differential gene set enrichment
by (a) heatmap and (b) GSEA as well as individual gene expression levels of (c) NLRC5, (d) HLA-B, B2M, (e)
CD8A, granzyme A (GZMA), perforin (PRF1) and CD56. Bar represents the median value. P-values calculated
using Mann–Whitney U test. NES, normalized enrichment score.
improve prediction by adding more variables. We reasoned that CTLA-4, PD-1, PD-L1 or PD-L2 might be good
candidates because their expression has been proposed to be correlated with responses to checkpoint blockade
immunotherapies38,40,41; therefore, we first examined the correlation between NLRC5 expression and the expres-
sion of these genes. The expression of NLRC5 exhibited intermediate to high correlation with the expression of
CTLA-4 (Pearson’s correlation coefficient 0.70) and PD-1 (0.83), while the correlation between NLRC5 expres-
sion and expression of PD-L1 (0.44) and PD-L2 (0.54) was lower (Fig. S3), suggesting that CTLA-4 and PD-1
might not be good predictive variables to partner with NLRC5. ROC curve analyses revealed that the AUC was
the highest when NLRC5 expression, mutation load and PD-L2 expression were included as covariates (Table S1).
Scatter plots with NLRC5 expression, PD-L2 expression and mutation load/neoantigen load suggests that a part
of the non-responder group did not overlap with the responder group (Fig. 3a, Supplementary video1-8). ROC
curve analysis using these variables showed improvement of the false positive rate, which decreased from 86%
using the single variable (PD-L2 expression) to 46% or 55% using three variables (PD-L2, NLRC5 expression and
Scientific Reports | (2021) 11:3258 | https://doi.org/10.1038/s41598-021-82729-9 3
Vol.:(0123456789)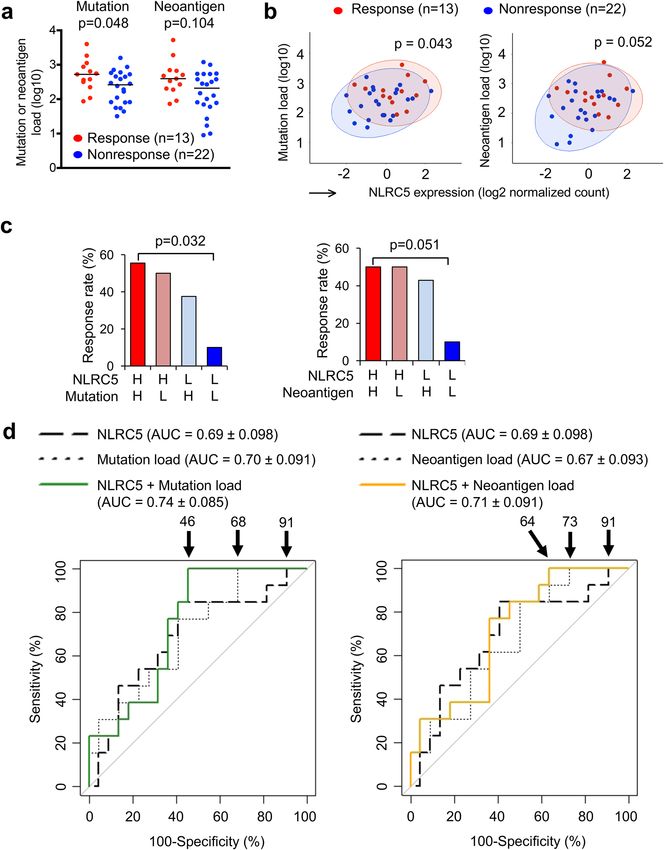
www.nature.com/scientificreports/

          Scientific Reports |   (2021) 11:3258 |   https://doi.org/10.1038/s41598-021-82729-9   4

Vol:.(1234567890)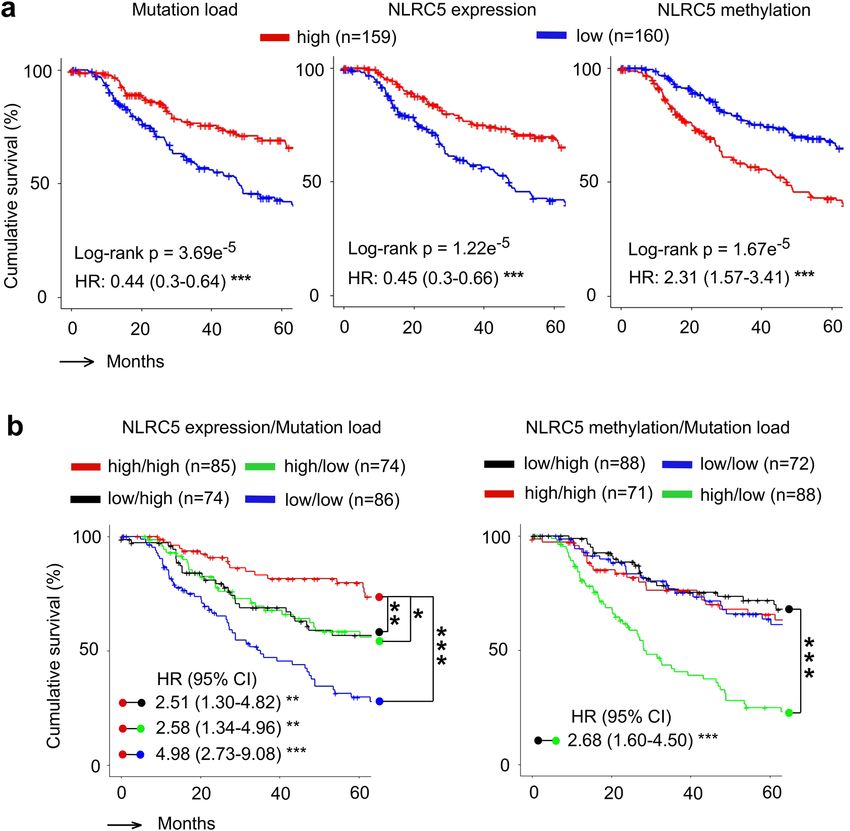
www.nature.com/scientificreports/
◂Figure 2. Multivariate analysis with NLRC5 expression and load of mutation or neoantigen provide predictive
information for the response to anti-CTLA-4 therapy. (a) Comparison of mutation and neoantigen load between
response (n = 13) and non-response (n = 22) groups. P-values were calculated using Mann–Whitney U test. (b)
Scatterplots for NLRC5 expression and mutation or neoantigen load. 95% confidence ellipses about the centroids
were drawn for both response (red circle) and non-response group (blue circle). P-values were calculated using
Hotelling’s Test. (c) Response rate to anti-CTLA-4 therapy in the four groups stratified by NLRC5 expression and
mutation/neoantigen load. Cohort was divided into four groups based on the level of NLRC5 expression and
mutation or neoantigen load. The response rate (%) to the therapy among each group was calculated. Patients
carrying higher value of the median are defined as high group (H), those carrying lower value of the median
are defined as low group (L) in respective variables. Statistical significance between the groups of high NLRC5
expression/high mutation or neoantigen load and low NLRC5 expression/low mutation or neoantigen load were
determined by the χ2 test. (d) ROC curves for logistic regression models using the respective combination of
NLRC5 expression, mutation load and neoantigen load. The numbers with arrow are showing false positive rate
with 100% sensitivity. AUC (area under the curve) ± SE (standard error) is depicted.
mutation load or neoantigen load, respectively) (Fig. 3b). This analysis suggests that the combination of three
variables are also useful in identifying the patient population that does not respond to anti-CTLA-4 therapy.
Combination of NLRC5 expression and load of mutation or neoantigen provide prognostic
information for the response to anti‑CTLA‑4 therapy. Previously it was shown that NLRC5 expres-
sion is correlated with prognosis of patients with multiple cancer types24. The multivariable logistic regression
including NLRC5 expression together with mutation load or neoantigen load indicated that the analysis of two
variables would be superior to predict responses to anti-CTLA-4 checkpoint blockade therapy (Fig. 2b–d). Since
these variables are critical for immune surveillance against cancer, we hypothesized that an association would be
observed with patient prognosis and overall survival. Using melanoma patient data from the TCGA database,
we performed a survival curve analysis using Kaplan–Meier estimates for overall survival and a multivariate Cox
proportional hazards model for hazard ratios. The cohort was divided into two groups based on values higher or
lower than the median for mutation load, NLRC5 expression and NLRC5 promoter methylation. The high muta-
tion patient group demonstrated better prognosis than the low mutation group (HR = 0.44) (Fig. 4a). The groups
with high NLRC5 expression and low NLRC5 methylation showed significantly better prognosis than the low
NLRC5 expression group and high NLRC5 methylation group respectively (HR = 0.45 and HR = 2.31) (Fig. 4a),
supporting previous reports that NLRC5 expression and methylation is correlated with prognosis of melanoma
patients24. Survival curve analysis of four groups stratified by the level of NLRC5 expression and mutation load
demonstrated that the high NLRC5 expression/high mutation load group showed better prognosis than the low
NLRC5 expression/low mutation load group (Fig. 4b). Similarly, survival curve analysis for four groups stratified
by the level of NLRC5 promoter methylation and mutation load showed that NLRC5 methylation high/mutation
low group is a high risk group with poor prognosis, and the NLRC5 methylation low/mutation high group is a
lower risk group with better prognosis (Fig. 4b). Taken together, these data indicate that multivariate analysis
using NLRC5 expression/methylation status with mutation load is superior to single variable analysis and may
be of value as a prognostic biomarkers in melanoma.
The expression of NLRC5 and MHC class I‑associated genes are correlated with response to
anti‑PD1 antibody therapy. Based on our observations of the potential value of NLRC5 as a biomarker in
the anti-CTLA4 treatment cohort, we were inspired to extend the analysis to melanoma patient cohorts treated
with anti-PD1 therapy. Gene set enrichment analysis indicated that the NLRC5-dependent MHC class I and
CD8+ T cell gene set was also shown to be reduced in patients who did not respond to anti-PD-1 therapy
(Fig. 5a,b). Similar to anti-CTLA4-treated patient cohort, NLRC5 and HLA-B was reduced in non-responders
(Fig. 5c), along with a similar trend for B2M in anti-PD1-treated melanoma patients (Fig. 5d). Similarly, CD8+
T cell markers, CD8A, PRF1 and GZMA were decreased with no change to CD56 (Fig. 5e). The predictive value
of NLRC5 expression alone in the anti-PD1 cohort was comparable (AUC = 0.71) to what was observed in anti-
CTLA4 (Fig. 5f) and NLRC5 expression clearly stratified patients into a high and low overall survival group
upon Kaplan–Meier analysis (Fig. 5g). These data indicate that NLRC5 expression level may also be important
for effective response to anti-PD1 monotherapy and may provide predictive information.
Discussion
Discovery of inhibitory receptors on T cells and development of monoclonal antibodies against them has led to
widespread usage of checkpoint blockade therapy in various c ancers2. Although these therapies are effective for
many cancer patients, complete response rate ranges from around 20% for anti-CTLA-4 antibody therapy42,43
to 30% for anti-PD/anti-PD-L1 therapy in the case of melanoma41,43. These treatments are quite expensive and
when ineffective create a significant financial burden on patients and the health care system44. Although it is
known that the expression of PD-1/PD-L1, mutation and neoantigen load correlate with responses checkpoint
blockade therapy, their predictive power is low, resulting in the treatment of many patients for whom these
therapies are ineffective.
This study suggests that NLRC5 is a biomarker to predict the outcome of CTLA-4 blockade therapy. Since
checkpoint therapy relies on T cell activation and NLRC5 is critical for MHC class I-dependent cytotoxic T cell
activation, it is not unexpected that NLRC5 may play an important role in the response to checkpoint blockade
therapy. Indeed, reduced MHC class I immunostaining and gene expression in pretreatment biopsies from
Scientific Reports | (2021) 11:3258 | https://doi.org/10.1038/s41598-021-82729-9 5
Vol.:(0123456789)www.nature.com/scientificreports/
Figure 3. Combination of PD-L2 expression with NLRC5 expression and mutation or neoantigen load are
sensitive predictors for responses to anti-CTLA-4 therapy. (a) Scatterplots for NLRC5 and PD-L2 expression
with mutation load (left panel) or neoantigen load (right panel) for response (n = 13) and nonresponse (n = 22)
groups. (b) ROC curves for logistic regression models using the respective combination of PD-L2 expression,
NLRC5 expression, mutation load and neoantigen load. The numbers with arrow are showing false positive rate
with 100% sensitivity. AUC (area under the curve) ± SE (standard error) is depicted.
anti-CTLA-4 treated melanoma patients predicts resistance to therapy and reduced s urvival45. Similarly, others
have independently shown that increased immunoproteasome expression (PSMB8, PSMB9) is correlated with
better response to anti-CTLA-4 or anti-PD-1 therapy46. Although NLRC5 expression alone has relatively weak
predictive power (Fig. 2d), in combination with other variables it yields improved predictive performance. In
particular, NLRC5 expression and neoantigen load/mutation number exhibited a low degree of multi-collinearity
and are weakly correlated (Pearson’s coefficient 0.3 and 0.27, respectively, Fig. S3). Combining NLRC5 expression
Scientific Reports | (2021) 11:3258 | https://doi.org/10.1038/s41598-021-82729-9 6
Vol:.(1234567890)www.nature.com/scientificreports/
Figure 4. Combination of NLRC5 expression and load of mutation or neoantigen provide prognostic
information. (a) Kaplan–Meier estimates of five year overall survival of patients with high and low mutation
load (Left), NLRC5 gene expression (Middle), and NLRC5 methylation (Right). Patients in the TCGA melanoma
cohort were stratified by medians into high and low groups (n = 159 and n = 160). (b) Kaplan–Meier estimates
of five year overall survival of patients with varying levels of two factors, NLRC5 expression and mutation
load (Left) and NLRC5 methylation and mutation load (Right). Patients were stratified by two factors (NLRC5
expression/NLRC5 methylation and mutation load) in a similar fashion with (a), yielding four groups (high
NLRC5 expression/NLRC5 methylation and high mutation load, likewise, high and low, low and high, low and
low). Pairwise log-rank test was used to analyze the survival in indicated pairs. Hazard ratio (HR) and 95%
confidence interval (CI) was determined by multivariate analysis using Cox regression model (see Methods).
*p < 0.05; **p < 0.01; ***p < 0.001.
and mutation numbers demonstrated better AUC values and a lower false positive rate at 100% sensitivity
(Fig. 2d). These data indicate that the combination of NLRC5/mutation load is superior to these variables alone
in identifying non-responders. In contrast to the low correlation between NLRC5 expression and mutation
load, the expression of CTLA-4, PD-1, PD-L1 or PD-L2 relative to NLRC5 expression carry high to intermedi-
ate correlation (Pearson’s coefficient 0.70, 0.83, 0.44 or 0.54, Fig. S3). It appears that PD-L2 is the best variable
to combine with NLRC5 and mutation number for purposes of prediction (Table S1) and is in line with PD-L2
being a predictive marker in anti-PD-1 checkpoint therapy47. Future discovery of other variables will further
Scientific Reports | (2021) 11:3258 | https://doi.org/10.1038/s41598-021-82729-9 7
Vol.:(0123456789)www.nature.com/scientificreports/
Figure 5. The expression of NLRC5 and NLRC5-dependent MHC class I and CD8+ T cell genes as a predictor to anti-PD1 therapy.
Patients groups who benefitted from anti-PD1 therapy (Response, n = 22) and who did not (Nonresponse, n = 19) were analyzed for
differential gene set enrichment by (a) heatmap and (b) GSEA as well as individual gene expression levels of (c) NLRC5, (d) HLA-B,
B2M, (e) CD8A, granzyme A (GZMA), perforin (PRF1) and CD56. Bar represents the median value. P-values calculated using Mann–
Whitney U test. NES, normalized enrichment score. (f) ROC curve for logistic regression model using NLRC5 expression. The
numbers with arrow are showing false positive rate with 100% sensitivity. AUC (area under the curve) ± SE (standard error) is depicted.
(g) Kaplan–Meier estimates of five year overall survival of patients with high and low NLRC5 gene expression, stratified by median
expression (n = 20 and n = 21). Hazard ratio (HR) and 95% confidence interval (CI) was determined by multivariate analysis using Cox
regression model (see Methods). **p < 0.01.
Scientific Reports | (2021) 11:3258 | https://doi.org/10.1038/s41598-021-82729-9 8
Vol:.(1234567890)www.nature.com/scientificreports/
increase predictive power for response to the checkpoint therapy in melanoma. Although this study involved
only a relatively small number of melanoma patients who received anti-CTLA-4 checkpoint therapy, we demon-
strated an almost identical relationship between NLRC5 and differentiation of non-responders from responders
of anti-PD-1 checkpoint therapy, albeit mutation/neoantigen load data was not available for us to fully replicate
our model (Fig. 5). Anti-PD-1/PD-L1 antibody therapy is based on similar mechanisms to increase anti-tumor
immune responses. Thus, it is feasible that NLRC5 expression / mutation load might also be useful for predicting
outcomes of other cancer patients treated with anti-PD-1/PD-L1 antibody therapy. Checkpoint blockade therapy
was initially tested in melanoma patients, but has been expanded to a dozen cancer types including lung, breast
and kidney. Therefore, investigations into the role of NLRC5 expression and mutation load for the prediction of
treatment outcomes in these cancers is of interest.
In summary, this study identified the expression of NLRC5 as a novel predictive biomarker for immune check-
point blockade therapies in melanoma. Multivariate analysis using NLRC5 seems to have significant potential
as a predictor of patient response to checkpoint blockade therapy. Validation studies using a larger independent
cohort is needed to corroborate these results and to further refine the predictive relationships for checkpoint
blockade treatment outcomes.
Materials and methods
Data sets. Clinical data for anti‑CTLA4 therapy. The cohort for the analysis of response to anti-CTLA-4
therapy (ipilimumab) was obtained through Database of Genotypes and Phenotypes (dbGaP)48,49, accession
number phs000452.v2.p138.
TCGA. Data for survival analysis of melanoma was obtained through the Cancer Genome Atlas (TCGA)
data portal (https://tcga-data.nci.nih.gov/tcga), Skin Cutaneous Melanoma (SKCM). Gene expression data
(mRNASeq; illuminahiseq_rnaseqv2-RSEM_genes_normalized_data), DNA methylation data (humanmethyl-
ation450-within_bioassay_data_set_function) and clinical data (Merge_Clinical) were accessed through GDAC
Firehose (gdac.broadinstitute.org). Somatic mutation data were accessed through the c BioPortal50.
Clinical data for anti‑PD1 therapy. The raw sequence files for the cohort of response to anti-PD1 therapy was
obtained from the European Nucleotide Archive (ENA) under accession PRJEB23709 and matched to clinical
data from source study51.
Patient profiling. dbGap dataset (anti‑CTLA4 therapy). A patient population of 37 metastatic melanoma
patients who had taken ipilimumab monotherapy was analyzed. Patients were stratified by clinical benefit sta-
tus as described previously38. Response to ipilimumab was defined as CR (complete response) or PR (partial
response) by Response Evaluation Criteria in Solid Tumors (RECIST) criteria or SD (stable disease) by RECIST
criteria52 with overall survival greater than 1 year. Non-response to ipilimumab was defined as PD (progressive
disease) or SD (stable disease) by RECIST criteria with overall survival less than 1 year.
ENA dataset (anti‑PD1 therapy). A patient population of 41 melanoma patients treated with anti-PD1 therapy
using either nivolumab (n = 9) or pembrolizumab (n = 32) with available pre-treatment sampled tumor RNA-
seq data was analyzed. Patient stratification into responder and non-responders was performed under the same
criteria used with the anti-CTLA-4 patients.
Gene expression analysis. RNA sequences were downloaded and converted to FastQ file format using
SRA Toolkit v2.6.3. Paired-end reads were checked to trim for low quality bases and adaptor sequences using
Trimmomatic53. For the dbGap dataset, filtered reads were mapped to the GRCh37/hg19 assembly using
TopHat v2.0.1354 and H TSeq55 was then used to generate raw read counts per gene using intersection-nonempty
parameter to account for ambiguous read mappings. For the ENA dataset, filtered reads were mapped to the
GRCh38/hg19 assembly using H ISAT256 with GNU-parallel57 and BAM files indexed and sorted by S AMtools58.
featureCounts59 was used to count reads mapped to each gene. Gene expression values were generated for further
analyses using DESeq260, following recommended guidelines by the authors. The expression levels of NLRC5,
HLA-B, B2M, CD8A, granzyme A (GZMA), perforin (PRF1) and CD56 measured by RNA sequencing (RNA-seq)
were compared between responders and non-responders using the Mann–Whitney U Test.
Gene set enrichment analysis (GSEA). Gene Set Enrichment Analysis (GSEA, http://www.broad.mit.
edu/gsea/) 61 was used to assess differential expression of NLRC5-dependent MHC class I and CD8+ T cell gene
set between response and non-response group to anti-CTLA4 or anti-PD1 therapy. The gene set tested was based
on knowledge of the literature concerning NLRC5 and the MHC class I antigen presentation p athway23,24,37.
Mutation and neoantigen analysis. For analyses involving numbers of mutation and neoantigen
(mutation load and neoantigen load, respectively), 35 of the 37 melanoma patients treated with ipilimumab
had data a vailable38. Those were compared between responders and non-responders to ipilimumab using the
Mann–Whitney U Test. The bidimensional combination of NLRC5 expression and mutation or neoantigen load
was assessed and p-values were calculated using Hotelling’s T 2 Test to compare between responder and non-
responder to ipilimumab. Next, to evaluate the influence of those variables for response to ipilimumab, cohort
was divided into four groups based on the level of NLRC5 expression and mutation or neoantigen load and
was calculated for the response rate to ipilimumab. Patients carrying higher value of the median are defined as
Scientific Reports | (2021) 11:3258 | https://doi.org/10.1038/s41598-021-82729-9 9
Vol.:(0123456789)www.nature.com/scientificreports/
high group, those carrying lower value of the median are defined as low group in respective variables. Statistical
significance between the groups of high NLRC5 expression/high mutation or neoantigen load and low NLRC5
expression/low mutation or neoantigen load was determined by the χ2 test.
Expression values for other genes known as predictors of response to anti-CTLA-4 therapies, such as CTLA-4,
PD-1, PD-L1 and PD-L2 were combined with NLRC5 expression and mutation or neoantigen load and repre-
sented in a three-dimensional scatterplot.
Logistic regression analysis. Logistic regression models were fitted with different combinations of the
following covariates: the values for expression of 5 genes (NLRC5, PD-L1, PD-L2, CTLA-4 and PD-1), mutation
load, and neoantigen load. Up to 3 of these variables were considered for the regression models at a time. Sam-
ples with missing values were eliminated before fitting the regression. Multicollinearity was assessed through
calculation of variance inflation factors and Pearson’s correlation coefficient (Fig. S3). A scatterplot matrix was
created with fitted curves and regression lines and the distribution of each variable was inspected. An ROC curve
was generated for each combination of covariates and AUC ± standard error (SE) generated using the pROC
package (version 1.8)62 in R. The training data was used as the prediction data for the ROC curves. Threshold
values were determined at points where the sensitivity is 100%. These curves were plotted and a selection were
reported. A bootstrapping procedure with 10,000 repetitions was used to estimate 95% confidence intervals for
the curves as well as calculate a mean AUC. This was accomplished by sampling the cohort with replacement to
create new groupings of data (the same size as the original cohort) then used to construct ROC curves. The AUC
was calculated for each of these new curves. The confidence interval was determined by ordering the AUCs by
value and returning the value at the index 2.5% of the length of the list away from the beginning and end. The
best prediction model was chosen based on the highest mean AUC.
Survival analysis. Survival analysis was performed on a cohort of melanoma patients obtained from TCGA
(n = 319) or ENA (n = 41). The TCGA cohort was filtered to only include patients who had had all three data types
available (RNA-seq, mutation load and methylation) as well as clear cancer tumor stage record. NLRC5 methyla-
tion was assessed as the sum of the methylation of probe sites (cg08159663, cg07839457 and cg16411857) that
negatively correlated with NLRC5 gene expression (Fig. S4). Survival curves were calculated using the Kaplan–
Meier method depicting the difference in survival between the groups through division of the cohort into top
and bottom 50% based on median NLRC5 expression, NLRC5 methylation or mutation load. Patients were
stratified in a similar fashion by two variables (NLRC5 expression and mutation load) yielding four groups (high
NLRC5 expression/high mutation load, high/low, low/high, low/low, respectively). The same was also performed
for NLRC5 methylation and mutation load (high NLRC5 methylation/high mutation load, high/low, low/high,
low/low, respectively). For univariate survival curves, statistical significance was assessed by log-rank test and
for multivariate survival curves, pairwise log-rank test with Benjamini–Hochberg FDR correction was used. A
Cox proportional hazard regression model was used to evaluate the effects of age and cancer stage as additional
covariates. Cancer stage was not available for patients in the anti-PD-1 dataset.
Statistical analysis. Statistical analysis was performed using R 3.6.0 and RStudio 1.1.463.
Ethical approval and ethical standards. The data used in our study were obtained from public data-
bases, therefore, ethical approval was not required.
Received: 3 January 2020; Accepted: 21 January 2021
References
1. Pardoll, D. M. The blockade of immune checkpoints in cancer immunotherapy. Nat. Rev. Cancer 12, 252–264. https://doi.
org/10.1038/nrc3239 (2012).
2. Sharma, P. & Allison, J. P. The future of immune checkpoint therapy. Science 348, 56–61. https://doi.org/10.1126/science.aaa8172
(2015).
3. Postow, M. A., Callahan, M. K. & Wolchok, J. D. Immune checkpoint blockade in cancer therapy. J. Clin. Oncol. 33, 1974–1982.
https://doi.org/10.1200/JCO.2014.59.4358 (2015).
4. Swart, M., Verbrugge, I. & Beltman, J. B. Combination approaches with immune-checkpoint blockade in cancer therapy. Front.
Oncol. 6, 233. https://doi.org/10.3389/fonc.2016.00233 (2016).
5. Weber, J. S., Kahler, K. C. & Hauschild, A. Management of immune-related adverse events and kinetics of response with ipilimumab.
J. Clin. Oncol. 30, 2691–2697. https://doi.org/10.1200/JCO.2012.41.6750 (2012).
6. Choudhury, N. & Nakamura, Y. Importance of immunopharmacogenomics in cancer treatment: Patient selection and monitoring
for immune checkpoint antibodies. Cancer Sci. 107, 107–115. https://doi.org/10.1111/cas.12862 (2016).
7. Hamid, O. et al. Safety and tumor responses with lambrolizumab (anti-PD-1) in melanoma. N. Engl. J. Med. 369, 134–144. https
://doi.org/10.1056/NEJMoa1305133 (2013).
8. Masucci, G. V. et al. Validation of biomarkers to predict response to immunotherapy in cancer: Volume I—pre-analytical and
analytical validation. J. Immunother. Cancer 4, 76. https://doi.org/10.1186/s40425-016-0178-1 (2016).
9. Ma, W., Gilligan, B. M., Yuan, J. & Li, T. Current status and perspectives in translational biomarker research for PD-1/PD-L1
immune checkpoint blockade therapy. J. Hematol. Oncol. 9, 47. https://doi.org/10.1186/s13045-016-0277-y (2016).
10. Khagi, Y., Kurzrock, R. & Patel, S. P. Next generation predictive biomarkers for immune checkpoint inhibition. Cancer Metastasis
Rev. 36, 179–190. https://doi.org/10.1007/s10555-016-9652-y (2017).
11. Riaz, N. et al. Recurrent SERPINB3 and SERPINB4 mutations in patients who respond to anti-CTLA4 immunotherapy. Nat. Genet.
48, 1327–1329. https://doi.org/10.1038/ng.3677 (2016).
Scientific Reports | (2021) 11:3258 | https://doi.org/10.1038/s41598-021-82729-9 10
Vol:.(1234567890)www.nature.com/scientificreports/
12. Schreiber, R. D., Old, L. J. & Smyth, M. J. Cancer immunoediting: Integrating immunity’s roles in cancer suppression and promo-
tion. Science 331, 1565–1570. https://doi.org/10.1126/science.1203486 (2011).
13. Tang, S., Ning, Q., Yang, L., Mo, Z. & Tang, S. Mechanisms of immune escape in the cancer immune cycle. Int. Immunopharmacol.
86, 106700. https://doi.org/10.1016/j.intimp.2020.106700 (2020).
14. Garrido, F., Cabrera, T. & Aptsiauri, N. “Hard” and “soft” lesions underlying the HLA class I alterations in cancer cells: Implications
for immunotherapy. Int. J. Cancer 127, 249–256. https://doi.org/10.1002/ijc.25270 (2010).
15. Campoli, M. & Ferrone, S. HLA antigen changes in malignant cells: epigenetic mechanisms and biologic significance. Oncogene
27, 5869–5885. https://doi.org/10.1038/onc.2008.273 (2008).
16. Lampen, M. H. & van Hall, T. Strategies to counteract MHC-I defects in tumors. Curr. Opin. Immunol. 23, 293–298. https://doi.
org/10.1016/j.coi.2010.12.005 (2011).
17. Vermeulen, C. F. et al. Frequent HLA class I loss is an early event in cervical carcinogenesis. Hum. Immunol. 66, 1167–1173. https
://doi.org/10.1016/j.humimm.2005.10.011 (2005).
18. Djajadiningrat, R. S. et al. Classic and nonclassic HLA class I expression in penile cancer and relation to HPV status and clinical
outcome. J. Urol. 193, 1245–1251. https://doi.org/10.1016/j.juro.2014.11.057 (2015).
19. Inoue, M. et al. Expression of MHC Class I on breast cancer cells correlates inversely with HER2 expression. Oncoimmunology 1,
1104–1110. https://doi.org/10.4161/onci.21056 (2012).
20. Hanagiri, T. et al. Clinical significance of expression of cancer/testis antigen and down-regulation of HLA class-I in patients with
stage I non-small cell lung cancer. Anticancer Res. 33, 2123–2128 (2013).
21. Qifeng, S., Bo, C., Xingtao, J., Chuanliang, P. & Xiaogang, Z. Methylation of the promoter of human leukocyte antigen class I in
human esophageal squamous cell carcinoma and its histopathological characteristics. J. Thorac. Cardiovasc. Surg. 141, 808–814.
https://doi.org/10.1016/j.jtcvs.2010.04.031 (2011).
22. Meissner, T. B., Li, A. & Kobayashi, K. S. NLRC5: A newly discovered MHC class I transactivator (CITA). Microbes Infect. 14,
477–484 (2012).
23. Kobayashi, K. S. & van den Elsen, P. J. NLRC5: A key regulator of MHC class I-dependent immune responses. Nat. Rev. Immunol.
12, 813–820 (2012).
24. Yoshihama, S. et al. NLRC5/MHC class I transactivator is a target for immune evasion in cancer. Proc. Natl. Acad. Sci. U.S.A. https
://doi.org/10.1073/pnas.1602069113 (2016).
25. Kuenzel, S. et al. The nucleotide-binding oligomerization domain-like receptor NLRC5 is involved in IFN-dependent antiviral
immune responses. J. Immunol. 184, 1990–2000 (2010).
26. Meissner, T. B. et al. NLR family member NLRC5 is a transcriptional regulator of MHC class I genes. Proc. Natl. Acad. Sci. U.S.A.
107, 13794–13799 (2010).
27. Meissner, T. B., Li, A., Liu, Y. J., Gagnon, E. & Kobayashi, K. S. The nucleotide-binding domain of NLRC5 is critical for nuclear
import and transactivation activity. Biochem. Biophys. Res. Commun. 418, 786–791 (2012).
28. Meissner, T. B. et al. NLRC5 cooperates with the RFX transcription factor complex to induce MHC class I gene expression. J.
Immunol. 188, 4951–4958 (2012).
29. Ludigs, K. et al. NLRC5 exclusively transactivates MHC class I and related genes through a distinctive SXY module. PLoS Genet.
11, e1005088. https://doi.org/10.1371/journal.pgen.1005088 (2015).
30. Downs, I., Vijayan, S., Sidiq, T. & Kobayashi, K. S. CITA/NLRC5: A critical transcriptional regulator of MHC class I gene expres-
sion. BioFactors https://doi.org/10.1002/biof.1285 (2016).
31. Staehli, F. et al. NLRC5 deficiency selectively impairs MHC class I- dependent lymphocyte killing by cytotoxic T cells. J. Immunol.
188, 3820–3828. https://doi.org/10.4049/jimmunol.1102671 (2012).
32. Biswas, A., Meissner, T. B., Kawai, T. & Kobayashi, K. S. Cutting edge: Impaired MHC class I expression in mice deficient for nlrc5/
class I transactivator. J. Immunol. 189, 516–520 (2012).
33. Tong, Y. et al. Enhanced TLR-induced NF-kappaB signaling and type I interferon responses in NLRC5 deficient mice. Cell Res.
22, 822–835 (2012).
34. Yao, Y. et al. NLRC5 regulates MHC class I antigen presentation in host defense against intracellular pathogens. Cell Res. 22,
836–847 (2012).
35. Robbins, G. R. et al. Regulation of class I major histocompatibility complex (MHC) by nucleotide-binding domain, leucine-rich
repeat-containing (NLR) proteins. J. Biol. Chem. 287, 24294–24303 (2012).
36. Rodriguez, G. M. et al. NLRC5 elicits antitumor immunity by enhancing processing and presentation of tumor antigens to CD8(+)
T lymphocytes. Oncoimmunology 5, e1151593. https://doi.org/10.1080/2162402X.2016.1151593 (2016).
37. Yoshihama, S., Vijayan, S., Sidiq, T. & Kobayashi, K. S. NLRC5/CITA: A key player in cancer immune surveillance. Trends Cancer
3, 28–38. https://doi.org/10.1016/j.trecan.2016.12.003 (2017).
38. Van Allen, E. M. et al. Genomic correlates of response to CTLA-4 blockade in metastatic melanoma. Science 350, 207–211. https
://doi.org/10.1126/science.aad0095 (2015).
39. Snyder, A. et al. Genetic basis for clinical response to CTLA-4 blockade in melanoma. N. Engl. J. Med. 371, 2189–2199. https://
doi.org/10.1056/NEJMoa1406498 (2014).
40. Brahmer, J. R. et al. Phase I study of single-agent anti-programmed death-1 (MDX-1106) in refractory solid tumors: safety, clinical
activity, pharmacodynamics, and immunologic correlates. J. Clin. Oncol. 28, 3167–3175. https: //doi.org/10.1200/JCO.2009.26.7609
(2010).
41. Topalian, S. L. et al. Survival, durable tumor remission, and long-term safety in patients with advanced melanoma receiving
nivolumab. J. Clin. Oncol. 32, 1020–1030. https://doi.org/10.1200/JCO.2013.53.0105 (2014).
42. Schadendorf, D. et al. Pooled analysis of long-term survival data from phase II and Phase III trials of ipilimumab in unresectable
or metastatic melanoma. J. Clin. Oncol. 33, 1889–1894. https://doi.org/10.1200/JCO.2014.56.2736 (2015).
43. Maio, M. et al. Five-year survival rates for treatment-naive patients with advanced melanoma who received ipilimumab plus
dacarbazine in a phase III trial. J. Clin. Oncol. 33, 1191–1196. https://doi.org/10.1200/JCO.2014.56.6018 (2015).
44. Andrews, A. Treating with checkpoint inhibitors-figure $1 Million per patient. Am. Health Drug Benefits 8, 9 (2015).
45. Rodig, S. J. et al. MHC proteins confer differential sensitivity to CTLA-4 and PD-1 blockade in untreated metastatic melanoma.
Sci. Transl. Med. https://doi.org/10.1126/scitranslmed.aar3342 (2018).
46. Kalaora, S. et al. Immunoproteasome expression is associated with better prognosis and response to checkpoint therapies in
melanoma. Nat. Commun. 11, 896. https://doi.org/10.1038/s41467-020-14639-9 (2020).
47. Hoffmann, F. et al. Prognostic and predictive value of PD-L2 DNA methylation and mRNA expression in melanoma. Clin. Epigenet.
12, 94. https://doi.org/10.1186/s13148-020-00883-9 (2020).
48. Mailman, M. D. et al. The NCBI dbGaP database of genotypes and phenotypes. Nat. Genet. 39, 1181–1186. https: //doi.org/10.1038/
ng1007-1181 (2007).
49. Tryka, K. A. et al. NCBI’s database of genotypes and phenotypes: dbGaP. Nucleic Acids Res. 42, D975-979. https://doi.org/10.1093/
nar/gkt1211 (2014).
50. Cerami, E. et al. The cBio cancer genomics portal: an open platform for exploring multidimensional cancer genomics data. Cancer
Discov. 2, 401–404. https://doi.org/10.1158/2159-8290.CD-12-0095 (2012).
51. Gide, T. N. et al. Distinct immune cell populations define response to anti-PD-1 monotherapy and anti-PD-1/anti-CTLA-4 com-
bined therapy. Cancer Cell 35, 238–255. https://doi.org/10.1016/j.ccell.2019.01.003 (2019).
Scientific Reports | (2021) 11:3258 | https://doi.org/10.1038/s41598-021-82729-9 11
Vol.:(0123456789)www.nature.com/scientificreports/
52. Eisenhauer, E. A. et al. New response evaluation criteria in solid tumours: Revised RECIST guideline (version 1.1). Eur. J. Cancer
45, 228–247. https://doi.org/10.1016/j.ejca.2008.10.026 (2009).
53. Bolger, A. M., Lohse, M. & Usadel, B. Trimmomatic: A flexible trimmer for Illumina sequence data. Bioinformatics 30, 2114–2120.
https://doi.org/10.1093/bioinformatics/btu170 (2014).
54. Trapnell, C., Pachter, L. & Salzberg, S. L. TopHat: Discovering splice junctions with RNA-Seq. Bioinformatics 25, 1105–1111. https
://doi.org/10.1093/bioinformatics/btp120 (2009).
55. Anders, S., Pyl, P. T. & Huber, W. HTSeq—A python framework to work with high-throughput sequencing data. Bioinformatics
31, 166–169. https://doi.org/10.1093/bioinformatics/btu638 (2015).
56. Kim, D., Paggi, J. M., Park, C., Bennett, C. & Salzberg, S. L. Graph-based genome alignment and genotyping with HISAT2 and
HISAT-genotype. Nat. Biotechnol. 37, 907–915. https://doi.org/10.1038/s41587-019-0201-4 (2019).
57. Tange, O. GNU Parallel - The Command-Line Power Tool. ;login: The USENIX Magazine 36, 42–47 (2011).
58. Li, H. et al. The sequence alignment/map format and SAMtools. Bioinformatics 25, 2078–2079. https: //doi.org/10.1093/bioinf orma
tics/btp352 (2009).
59. Liao, Y., Smyth, G. K. & Shi, W. featureCounts: An efficient general purpose program for assigning sequence reads to genomic
features. Bioinformatics 30, 923–930. https://doi.org/10.1093/bioinformatics/btt656 (2014).
60. Love, M. I., Huber, W. & Anders, S. Moderated estimation of fold change and dispersion for RNA-seq data with DESeq2. Genome
Biol. 15, 550. https://doi.org/10.1186/s13059-014-0550-8 (2014).
61. Subramanian, A. et al. Gene set enrichment analysis: A knowledge-based approach for interpreting genome-wide expression
profiles. Proc. Natl. Acad. Sci. U.S.A. 102, 15545–15550. https://doi.org/10.1073/pnas.0506580102 (2005).
62. Robin, X. et al. pROC: An open-source package for R and S+ to analyze and compare ROC curves. BMC Bioinform. 12, 77. https
://doi.org/10.1186/1471-2105-12-77 (2011).
Author contributions
S.Y., J.Y., G.L., V.E.J. and K.S.K. designed studies. S.Y., S.X.C., X.P., J.Y. and K.S.K. performed analysis. S.Y., S.X.C.,
J.Y. and K.S.K. wrote the paper.
Funding
This work was supported by grants from the American Lung Association LCD-507710, National Multiple Sclero-
sis Society, CSTR, TAM Genomics, Japan Society for the Promotion of Science (JSPS) Grant Number: 18H06135,
SENSHIN Medical Research Foundation, Takeda Science Foundation to KSK, fellowship from Sumitomo Life
Welfare and Culture Foundation to SY and JSPS Grant Number: 20K16271 to SXC.
Competing interests
The authors declare no competing interests.
Additional information
Supplementary Information The online version contains supplementary material available at https://doi.
org/10.1038/s41598-021-82729-9.
Correspondence and requests for materials should be addressed to K.S.K.
Reprints and permissions information is available at www.nature.com/reprints.
Publisher’s note Springer Nature remains neutral with regard to jurisdictional claims in published maps and
institutional affiliations.
Open Access This article is licensed under a Creative Commons Attribution 4.0 International
License, which permits use, sharing, adaptation, distribution and reproduction in any medium or
format, as long as you give appropriate credit to the original author(s) and the source, provide a link to the
Creative Commons licence, and indicate if changes were made. The images or other third party material in this
article are included in the article’s Creative Commons licence, unless indicated otherwise in a credit line to the
material. If material is not included in the article’s Creative Commons licence and your intended use is not
permitted by statutory regulation or exceeds the permitted use, you will need to obtain permission directly from
the copyright holder. To view a copy of this licence, visit http://creativecommons.org/licenses/by/4.0/.
© The Author(s) 2021
Scientific Reports | (2021) 11:3258 | https://doi.org/10.1038/s41598-021-82729-9 12
Vol:.(1234567890)You can also read