"No Entry into New South Wales": COVID-19 and the Historic and Contemporary Trajectories of the Effects of Border Closures on an Australian ...
←
→
Page content transcription
If your browser does not render page correctly, please read the page content below
land
Article
“No Entry into New South Wales”: COVID-19 and the Historic
and Contemporary Trajectories of the Effects of Border Closures
on an Australian Cross-Border Community
Dirk H. R. Spennemann

                                          Institute for Land, Water and Society, Charles Sturt University, P.O. Box 789, Albury 2640, Australia;
                                          dspennemann@csu.edu.au

                                          Abstract: Given its intensity, rapid spread, geographic reach and multiple waves of infections, the
                                          COVID-19 pandemic of 2020/21 became a major global disruptor with a truly cross-sectoral impact,
                                          surpassing even the 1918/19 influenza epidemic. Public health measures designed to contain the
                                          spread of the disease saw the cessation of international travel as well as the establishment of border
                                          closures between and within countries. The social and economic impact was considerable. This paper
                                          examines the effects of the public health measures of “ring-fencing” and of prolonged closures of
                                          the state border between New South Wales and Victoria (Australia), placing the events of 2020/21
                                          into the context of the historic and contemporary trajectories of the border between the two states. It
                                          shows that while border closures as public-health measures had occurred in the past, their social and
                                          economic impact had been comparatively negligible due to low cross-border community integration.

                                   Concerted efforts since the mid-1970s have led to effective and close integration of employment
                                          and services, with over a quarter of the resident population of the two border towns commuting
Citation: Spennemann, D.H.R. “No
                                          daily across the state lines. As a result, border closures and state-based lockdown directives caused
Entry into New South Wales”:
COVID-19 and the Historic and
                                          significant social disruption and considerable economic cost to families and the community as a
Contemporary Trajectories of the          whole. One of the lessons of the 2020/21 pandemic will be to either re-evaluate the wisdom of a
Effects of Border Closures on an          close social and economic integration of border communities, which would be a backwards step, or
Australian Cross-Border Community.        to future-proof these communities by developing strategies, effectively public health management
Land 2021, 10, 610. https://doi.org/      plans, to avoid a repeat when the next pandemic strikes.
10.3390/land10060610
                                          Keywords: geographic borders; urban geography; public health measures; contagious disease
Academic Editor:                          management
Thomas Panagopoulos

Received: 20 April 2021
Accepted: 3 June 2021
                                          1. Introduction
Published: 7 June 2021
                                               Soon after its existence became public in late January 2020, COVID-19, the disease
Publisher’s Note: MDPI stays neutral
                                          caused by the coronavirus SARS-CoV-2 [1], rapidly developed into a pandemic in the
with regard to jurisdictional claims in
                                          globally interconnected world of business and leisure travel [2]. At each national level, gov-
published maps and institutional affil-   ernment reactions to curb or slow the progress of COVID-19 have involved the reduction
iations.                                  of international arrivals to repatriation flights, limitations to domestic travel, limitations to
                                          crowd sizes, the temporary shut-down of non-essential businesses and the restriction of
                                          human movement during periods of “lockdown” (stay-at-home orders) [3–5]. In addition,
                                          in some jurisdictions, lockdown orders were applied at the sub-national level [6]. As the
Copyright: © 2021 by the author.
                                          year 2020 progressed, many countries experienced a second and even a third wave of
Licensee MDPI, Basel, Switzerland.
                                          infections [7,8] with recurrences of small clusters even where COVID-19 could be largely
This article is an open access article
                                          suppressed. At the time of paper acceptance (on 2 June 2021), 165.2 million people had been
distributed under the terms and           infected on all continents in all but seven countries, with a global death toll of 3.4 million [9].
conditions of the Creative Commons        The recurrence of COVID-19 infections led to a renewal of lockdown orders and movement
Attribution (CC BY) license (https://     restrictions, including border closures. There is only limited literature on the effects of
creativecommons.org/licenses/by/          border closures on the actual movement of people and the social and economic costs this
4.0/).                                    caused. The impact has been profound, however, knowing that international movement of

Land 2021, 10, 610. https://doi.org/10.3390/land10060610                                                           https://www.mdpi.com/journal/land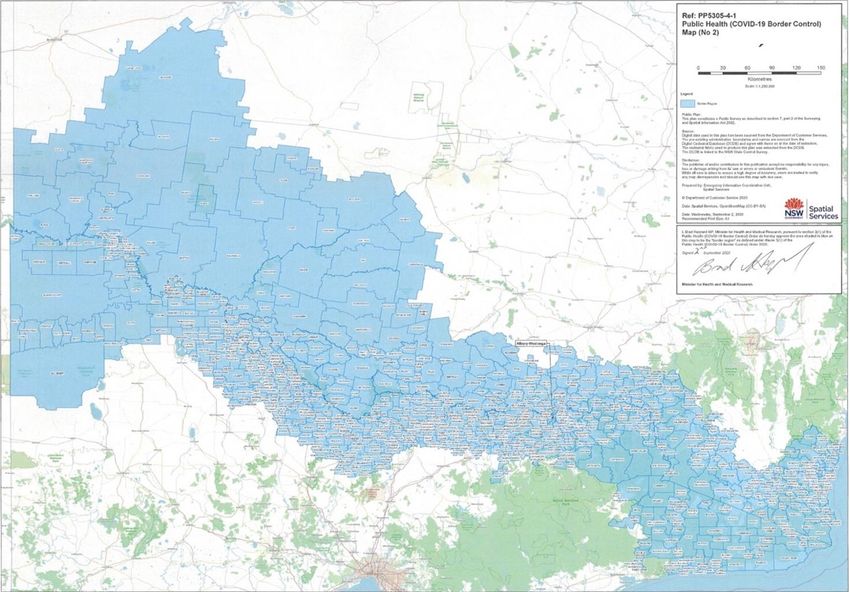
Land 2021, 10, 610                                                                                            2 of 26

                     people had become increasingly free of restrictions, with many countries having bilateral
                     agreements on visa-exempt travel.
                           Cross-border communication and integration flourished in Europe in the post-Cold
                     War era [10]. Globalisation has seen an intermeshing and horizontal integration of national
                     economies and trade, as exemplified by the proliferation of just-in-time supply chains and
                     goods and food supplies. During the heyday of the globalisation movement, expressed in
                     the plethora of free trade agreements and bi-lateral agreements on visa-exempt travel, phys-
                     ical national borders were on a trajectory to obsolescence. The European Union’s Schengen
                     agreement of 1985 is a case in point [11]. The free flow of goods and services, coupled
                     with increased affordability of air travel, was poised to generate a seamlessly integrated
                     world—at least for the developed countries [12]. Civil unrest in the Near and Middle East
                     as well as Northern Africa, coupled with extreme economic inequalities in Sub-Saharan
                     Africa and Central America, resulted in an increased movement of political, humanitarian
                     and economic refugees [13]. Some countries responded with the reestablishment of some
                     hard borders replete with barbed wire fencing [14,15].
                           The COVID-19 pandemic acted as a major disruptor to globalization and borderless
                     travel. The public health measures enacted as a response to the COVID-19 pandemic
                     have entailed the reduction of privacy (via contact tracing registers) and limitations on
                     the freedom of movement and assembly. Some authors have posited that a resurgence
                     of enforceable borders may become the “new normal” [16]. Setting aside the actions to
                     prevent the arrival and initial seeding of the disease in a country [17,18], many countries
                     imposed domestic and cross-border travel restrictions to prevent new strains from arriving,
                     or to maintain a disease-free state in cases where suppression had been effected (e.g.,
                     Australia and New Zealand) [19].
                           Movement restrictions were not only imposed on international travel, but also on
                     movement within a given country, breaking the tenet of unfettered freedom of movement
                     and choice of abode that had been a civil right for many generations. To combat the
                     spread of COVID-19, many countries resorted to tried-and-true personal movement control
                     and limitation measures, such as ring-fencing [20,21] and border closures (this paper).
                     While ring-fencing within states may encounter practical problems of compliance and
                     policing [22], border closures are more effective as natural or anthropogenic barriers may
                     inhibit population movement. Suddenly, borders became en vogue again.
                           In the Australian setting, the country experienced a full national lockdown between
                     31 March and mid-May 2020 [23], with a subsequent gradual easing of restrictions. Re-
                     peated localised outbreaks led to the imposition of temporary lockdown provisions in
                     numerous states, which resulted in restrictions to assembly and movement, including
                     cross-border traffic. The post-World War II generations of Australians had always en-
                     joyed a high percentage of car ownership and the freedom of movement that entailed [24].
                     Moreover, the country, spanning four major environmental zones from the equatorial
                     tropics to cool temperate [25], had become reliant on interstate commerce of food, goods
                     and services [26,27]. While some residents were aware of differences between the states
                     (e.g., differences in road rules or high school leaving certificates), these differences rarely
                     impacted on the personal lives of the majority. Suddenly that would come to an end, with
                     the COVID-19 pandemic starkly exposing the realities of the states imposing their own,
                     different public health measures.
                           Using the cross-border community of Albury (New South Wales, Australia) and
                     Wodonga (Victoria) as a case in point, this paper will focus on the social and community
                     impacts of the public health measures of “ring-fencing”[22] and the prolonged 2020 and
                     the shorter 2021 closure of the state border between New South Wales and Victoria. It will
                     place the events of 2020/21 into the context of the historic and contemporary trajectories
                     of the border between the colonies (later states), focussing on the impact of the border
                     on inter-community communications and commerce. It will show that while closures of
                     colonial/state borders had been employed as public-health measures in the past, their social
                     and economic impact had been negligible at the time due to low cross-border community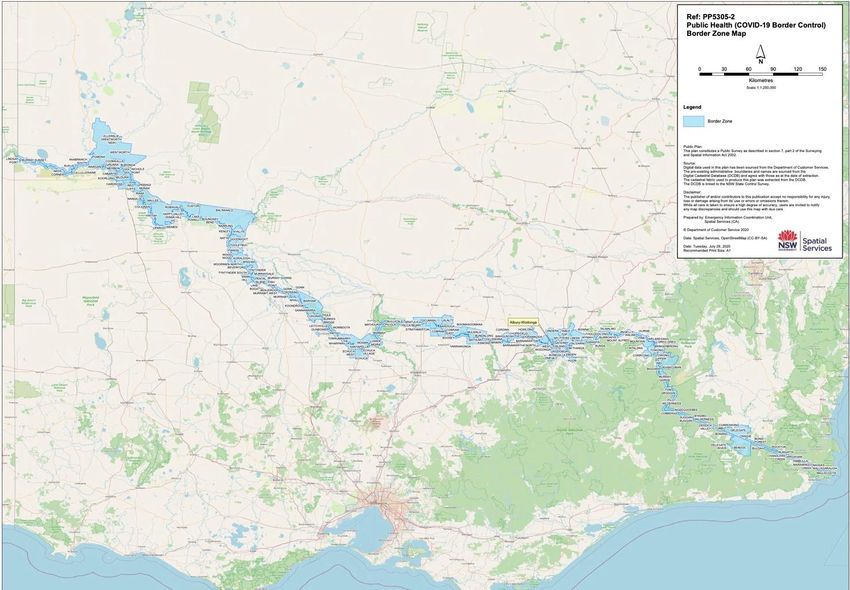
Land 2021, 10, x FOR PEER REVIEW 3 of 28
Land 2021, 10, 610 3 of 26
colonial/state borders had been employed as public-health measures in the past, their so-
cial and economic impact had been negligible at the time due to low cross-border com-
munity integration. Concerted efforts (since the mid-1970s) to forge a true cross-border
community
integration. have led toefforts
Concerted the effective
(since theandmid-1970s)
close integration
to forgeofa employment and community
true cross-border services in
the
haveAlbury-Wodonga
led to the effectiveregion, which
and close were significantly
integration impacted
of employment andwhen theinstate
services border
the Albury-
was suddenly
Wodonga andwhich
region, unilaterally closed as part
were significantly of COVID-19
impacted when public health
the state measures.
border was suddenly
and unilaterally closed as part of COVID-19 public health measures.
2. Materials and Methods
2. Materials and Methods
This paper employs a mixed methods methodology, encompassing standard historic
Thishistoric
research, paper employs a mixed
and current methods
statistics, methodology,
document analysisencompassing standardThe
and lived experience. historic
his-
research, historic and current statistics, document analysis and lived
toric information was sourced from contemporary regional and metropolitan newspapers experience. The
historic information was sourced from contemporary regional and metropolitan
digitized by the National Library of Australia [28] and legislation and regulations as newspa-
pers digitizedby
promulgated bycolonial
the National Library
and (later) ofgovernments;
state Australia [28]historic
and legislation andstatistical
and current regulations as
data
promulgated by colonial and (later) state governments; historic and current
were obtained from published census publications as well as data sets provided by the statistical data
were obtained
Australian fromofpublished
Bureau Statistics; census publications
press releases as well
and other as data setspublications
government provided bypro- the
Australian
vided Bureauof
the context ofthe
Statistics; press releases
management and other government
of the COVID-19 pandemic. The publications
discussionprovided
of the
the context of the management of the COVID-19 pandemic. The
impact of the border closure during the COVID-19 pandemic is augmented by liveddiscussion of the impact
ex-
of the border closure during the COVID-19 pandemic is augmented by lived experience
perience observations, both personal and by fellow residents, by virtue of the author liv-
observations, both personal and by fellow residents, by virtue of the author living in the
ing in the border area under discussion. Where required, these are identified as
border area under discussion. Where required, these are identified as “pers.obs”.
“pers.obs”.
The study area is Albury-Wodonga, a cross-border community of 96,000 people, and a
The study area is Albury-Wodonga, a cross-border community of 96,000 people, and
number of smaller satellite communities, located in south-eastern Australia (Figure 1).
a number of smaller satellite communities, located in south-eastern Australia (Figure 1).
Figure
Figure 1.
1. Map
Map ofof Albury-Wodonga
Albury-Wodongaand andsurrounds,
surrounds, showing
showing thethe local
local government
government areaarea boundaries
boundaries and and locations
locations men-
mentioned
tioned in the text. Inset: location of Albury-Wodonga in relation to Australia.
in the text. Inset: location of Albury-Wodonga in relation to Australia.
Given that this paper provides a conceptual discussion of the subject matter, rather
than an experimental design, the structure of the paper deviates from the standard IMRAD
format and presents discusses the subject matter in the form of contextual narrative. The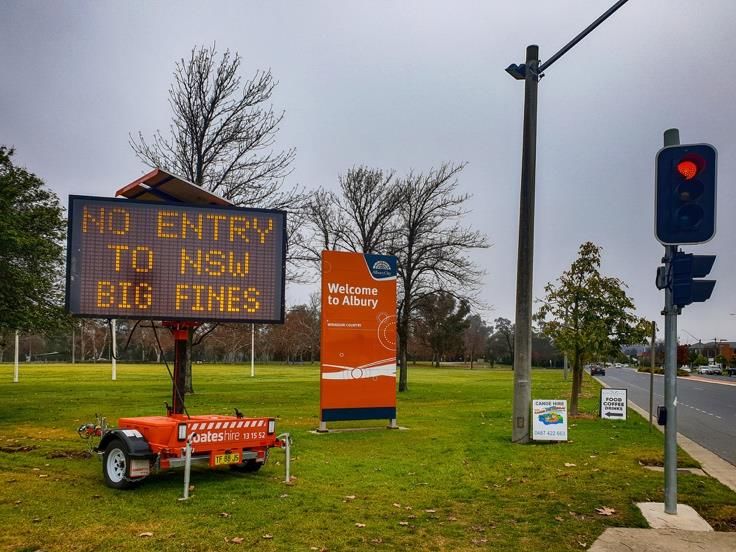
Land 2021, 10, 610                                                                                            4 of 26

                     on occasion detailed description of the historic trajectory lays the groundwork for an
                     understanding of the present social and economic condition of the study area. A section
                     on preconditions describes the nature of the border area prior to the establishment of
                     European borders and shows that the Murray River was a liminal zone rather than an
                     administrative and later political border. These are discussed by describing the creation of
                     separate political entities with customs points, the subsequent removal of these following
                     Australia’s Federation and the concerted efforts to merge two cross-border towns into an
                     integrated social, cultural and economic community. This contextualises the discussion
                     of the nature and impact of the imposition the border closures on the local community.
                     The discussion of the historic trajectories demonstrates why the impacts of the border
                     closures during the COVID-19 pandemic had greater effects on the cross-border community
                     than previously.

                     3. Preconditions
                           It appears that prior to the European invasion, the Murray River was not a border, but
                     a liminal zone for Indigenous Australian groups that had their centre of gravity in adjacent
                     areas. Thus, in the Albury-Wodonga area, the Waveroo (Minubuddong) were reputed to
                     have accessed both banks of the Murray [29] as were the Wiradjuri [30,31]. Fords were
                     essential locations that facilitated and maintained cross-river communication.
                           The arrival of European settlers invading Indigenous Australian lands along the
                     Murray commenced soon after the traverse by Hume and Hovell in 1824 [32]. At the same
                     time as European colonisation expanded, increasingly marginalising and displacing the
                     Indigenous communities as owners of the land [33], European settlers acquired and utilised
                     Indigenous knowledge of the river and fords suitable for crossing. In the Albury-Wodonga
                     region, the initial alienation from Indigenous ownership occurred in 1835, with the creation
                     of the Mungabareena and Bonegilla Runs [34–36] and the erection of a store at the location
                     at a long-established river crossing at the confluence of Bungambrawatha Creek with the
                     Murray [37,38]. That crossing was chosen in favour of nearby crossings which were less
                     suitable topographically (“Yarrawudda”) or politically (“Mungabareena”), with the latter
                     being next to the permanent Wiradjuri settlement site [33]. In consequence, the township
                     of Albury was formally laid out adjacent to the Bungambrawatha crossing in 1839 [36,39].
                           For Europeans, the Murray did not form a liminal zone but a barrier that had to
                     be overcome, usually by the establishment of punts followed by bridges. The universal
                     pattern of 19th century crossing points is that of a main community on one side of the
                     river and a small bridgehead community on the other (Table 1). The productivity of the
                     surrounding hinterland and subsequent flow of goods and communications defined which
                     of the paired communities would become the larger of the two, even in cases where the
                     other was founded first.

                     Table 1. River crossings and paired communities along the Murray. The larger community is shown
                     in capital letters.

                      New South Wales                Victoria            Punt              Bridge         Source
                          ALBURY              Wodonga (“Belvoir”)        1844               1860            [36]
                         HOWLONG                † Gooramadda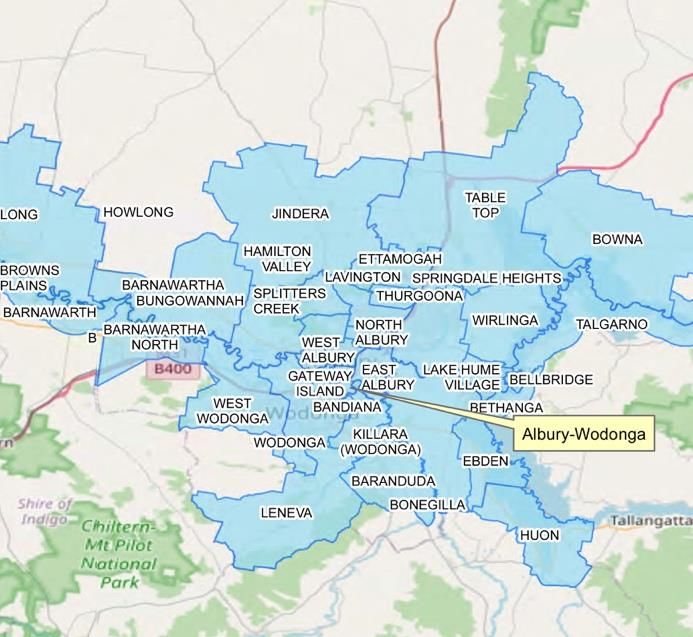
Land 2021, 10, 610                                                                                            5 of 26

                     “Belvoir” in 1852 and renamed to “Wodonga” in 1874 [42,43], gradually developed from a
                     single pub/hotel location into a bridgehead town extending along the Sydney-Melbourne
                     road [44]. The first formal option to cross the Murray rather than to use the ford was a
                     privately-owned punt that operated on the Albury side from 1844 onwards. This was
                     replaced by a government-owned ferry in 1849 and then by a formal bridge in 1861 [36].
                     The bridge, combined with the creation of a formed roadway across the Murray floodplain,
                     ensured safe and reliable crossing in all but situations of extreme spring floods when the
                     floodplain might be impassable for heavy wagons. Just before the bridge had been opened
                     to overcome the physical barrier represented by the river, however, a new political barrier
                     had been created.

                     4. Emergence of the State Border
                           Coming from Tasmania, European pastoralists invaded the south coast of Victoria and
                     settled in Portland Bay (1834) and Port Philip Bay (1835), eventually establishing settler
                     communities that gradually, but systematically colonised the surrounding areas to the
                     Great Dividing Range, displacing traditional Indigenous owners in the process [45,46].
                     Despite attempts by the colonial government to prevent the establishment of a colony, a
                     fait accompli was created with the surveying of the township of Melbourne (1837) and the
                     establishment of a semi-autonomous colony in 1839 [46], which led to the formal formation
                     of the separate colony of Victoria in July 1851 [47].
                           Deeply steeped in British administrative traditions of survey and land partitioning,
                     the lands offices in Sydney and Melbourne had long been using waterways as natural, and
                     thus easily definable, boundaries that could also be readily identified in the landscape [48].
                     Thus it is not surprising that the Murray River conveniently running from the east to west
                     was declared to be the border between the two colonies. Only in the Australian Alps, a
                     land border had to be defined, using an arbitrary line from Cape Howe on Australia’s east
                     coast to the most eastward approach of the Murray River [49,50]. Given that the river was a
                     resource in terms of navigation, fish and potentially power generation (with water wheels
                     driving flour- and sawmills), New South Wales retained the rights to the river and ensured
                     that the colonial boundary was formed by the southern bank of the river [51]. Albury and
                     Wodonga had become border towns.
                           In 1852 both New South Wales [52] and Victoria enacted customs legislation, but it
                     was not until three years later that inter-colonial regulations focussing on the Murray River
                     trade were introduced. The introduction of the Customs Act in 1855 (NSW) [53] and the
                     Murray Customs Duties Act of the same year (Victoria) [54], caused a dramatic decline
                     in inter-colonial commerce on which Albury depended [55]. The lifting of the customs
                     duties in December 1855 was short-lived [56], as they were reintroduced in 1860 [57].
                     What followed was a sequence of lifting and reintroduction of customs duties [58,59] that
                     confused and annoyed border residents [60]. The customs duties were finally abolished
                     with the Federation of the Australian colonies on 1 January 1901 [61].
                           To allow for the intensification of agricultural production and reduce the costs of trans-
                     portation, while at the time directing the trade to their own metropolitan centres rather
                     than, literally, down the river to Adelaide [62], both Victoria and New South Wales devel-
                     oped hub-and-spoke railways systems, centred on their respective capital cities [63–65].
                     One of the quirks of the colonial period, however, was that both colonies were adamant
                     that their railway gauge was preferable, with the inevitable result that when the railway
                     lines finally met at the Murray, neither train could progress beyond the termini in Wodonga
                     (1872) and Albury (1881). Even though the Victorian line was extended from Wodonga to
                     Albury in 1883, the break in the gauge required the transfer of all goods and passengers
                     from one train to the other, until rectified in 1963 when the NSW gauge was extended to
                     Melbourne [66,67].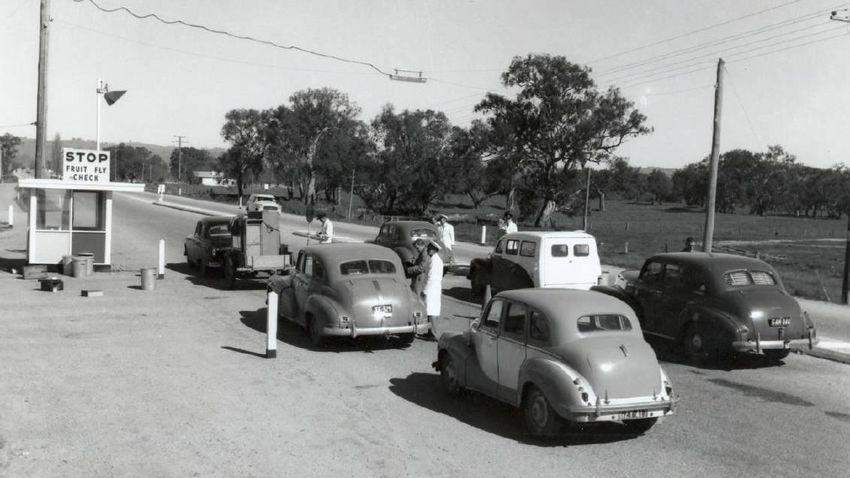
Land 2021, 10, 610                                                                                              6 of 26

                     4.1. Effects of Federation
                          When the Commonwealth of Australia eventuated in 1901, the primary effect, on a
                     domestic level, was the uninhibited movement of people and goods across colonial (and
                     henceforth state) borders [68,69], even though the practical implementation did not occur
                     until 1913 [61]. While the Federation created a single country, the powers of the new
                     nation were restricted to those that the former colonies were happy to surrender to as a
                     central government (e.g., foreign affairs, defence, racial legislation). Critically, the colonies
                     retained all powers associated with land management (incl. agriculture), natural resources,
                     education and health. Colonial concepts and rivalries (as exemplified by the railway gauge)
                     were readily ported to state realities. Even today, 120 years since the Federation, state
                     rivalry still persists, resulting in a dissonance of legislative, regulative and administrative
                     approaches [70].
                          While the Murray River represents the formal border between New South Wales and
                     Victoria, and thus forms the boundary of different land laws, planning rules and health
                     regulations, it is not an absolute breakpoint. Alternative borders did, and still do, exist. At
                     the Federation, Australia had been divided into military districts, with Military District 3
                     encompassing Victoria. In 1911 that district was enlarged, now taking in some of the border
                     communities north of the Murray, such as Corowa, Moama and Mulwala (44th Battalion
                     area), while Wodonga, Barnawartha, Chiltern and Tallangatta (57th Battalion area) south
                     of the Murray formed part of District 2 centred on Sydney [71]. A reorganisation of the
                     districts in 1939 extended the Military District 3 to encompass the Southern Riverina to the
                     Murrumbidgee (but not including Wagga Wagga) [72].
                          There is an additional, “cultural” divide with a broadly similar boundary: the “Barassi
                     Line”. Victoria, as well as the border region along the Murray River, primarily follow
                     the sporting code of Australian Rules Football, while the rest of New South Wales, from
                     about Wagga Wagga northwards, follows Rugby Union and Rugby League [73]. Similarly,
                     differences in the quality of roads and the density of the road network meant that much
                     of the produce of the southern Riverina east of Corowa went to Melbourne, rather than
                     Sydney [67].

                     4.2. Albury-Wodonga
                           The effects of the Federation on Albury-Wodonga were primarily the removal of
                     customs duties, making the interstate exchange of goods cheaper. Albury continued to
                     develop as a major rural service centre, in part driven by its access to both railway gauges.
                     Wodonga continued as a bridge-head community.
                           The fluidity of the borders in the post-Federation era was an important element in
                     20th-century Australia. Lived experience in the Albury-Wodonga over the past 30 years
                     can attest that, until the COVID-19-induced border closures (see below), the border was
                     irrelevant in people’s daily lives, manifesting itself largely in quirks like car registration
                     being more expensive in New South Wales and Victoria having slightly different traffic
                     rules, such as permitting U-turns at traffic lights.

                     5. 19th and 20th Century Border Closures
                           Even though during colonial times the border was open for traffic and goods trans-
                     fer, albeit subject to customs duties, the border was not always open for commerce and
                     communications. In fact, there were a number of unilaterally decreed closures. The same
                     occurred in the period after the Federation, when trade and movement of people were
                     supposedly wholly unrestricted.

                     5.1. Border Closures during Colonial Times
                           Following the outbreak of pleuro-pneumonia in Victoria, New South Wales restricted
                     all cattle imports across the Murray from August 1861, leading to a full border closure in
                     early November until early 1862 [74,75]. The manifestation of the disease in Albury in late
                     November 1861 caused a reverse, with Victoria closing its border along a stretch of the river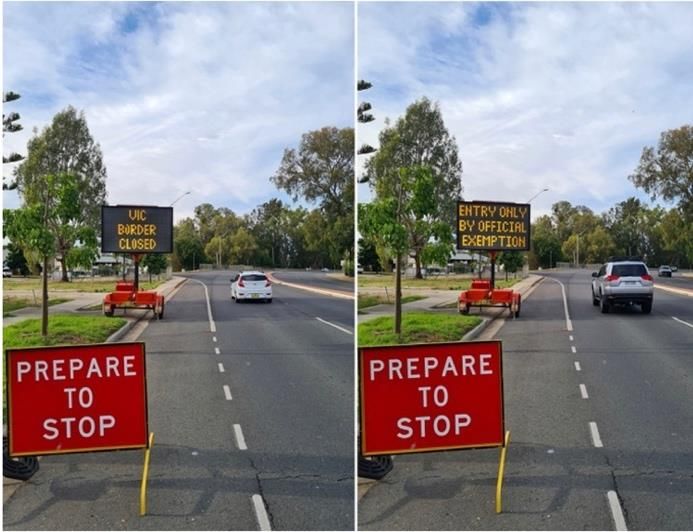
Land 2021, 10, 610                                                                                             7 of 26

                     from Cudgewa Creek to a point 10 miles downstream of Wahgunyah, with pounds for
                     animal quarantine set up at the crossing points (bridges) at Albury and Wahgunyah [76].
                     Given that all heavy goods transport at the time relied on bullock teams, and bullock
                     teams had been implicated in the spread of the disease [77,78], all cross-border transport of
                     wool, wine and grain was effectively curtailed, severely affecting the economy of border
                     towns and the adjacent rural communities. At the end of the same decade, New South
                     Wales closed its border to Victorian sheep from March to May 1869 due to an outbreak of
                     scab [79,80].

                     5.2. Post-Federation Border Closures
                           While after the Federation people and goods could, at least in theory, move freely
                     between states, public health and agricultural issues soon emerged, which had remained
                     under the control of the states. Some of these concerns resulted in travel restrictions and
                     inspections of travellers and vehicles. In 1904, for example, New South Wales sheep from
                     selected areas were prevented from entering Victoria for fear of anthrax [81], while in the
                     following year Victorian fruit was inspected for fruit flies on import to New South Wales.
                           The first major border closure occurred during the pneumonic influenza pandemic
                     of 1918–19 (“Spanish flu”) which cost between 17.4 and 50 million lives globally [82].
                     Once pneumonic influenza was detected in Victoria, New South Wales unilaterally closed
                     its borders on 20 January 1919. A buffer of 10 miles was established on either side of
                     the border that allowed residents to cross, provided that they were disease-free and had
                     quarantined for seven days (later four days) in a non-affected area within the zone [83,84].
                     Although not intended [85], the border closure interrupted the flow of goods and mails
                     between many border communities [86]. It did not prevent the disease from crossing state
                     boundaries [87,88], however, since local knowledge of unpoliced crossings allowed the
                     restrictions “being evaded at many points” [89,90]. These movement restrictions disrupted
                     many cross-border social linkages, in particular during the initial period.
                           While the majority of the newspaper coverage comments on the impact of the closures
                     on the interstate traffic in goods and people, there is ample evidence that it also impacted
                     the cross-border community of Albury-Wodonga at a local level. Newspapers commented
                     on “marooned people from this State [NSW, ed.] who are anxious to return home. The hotels and
                     private houses of Wodonga are filled with those people” [85] and noted that “many Wodonga
                     people who work in Albury have been unable to reach their business place. Others have had to seek
                     accommodation in Albury” [91].
                           In early March 1919, the influenza pandemic had firmly established itself in New South
                     Wales, obviating the need for border closures. Upon entry, however, Victorian residents still
                     had to produce a medical certificate vouching that they were influenza-free [92]. Indeed,
                     the border closures during the 1919 influenza pandemic saw an inconsistent approach
                     to policing, with some bridges policed systematically, while the river often remained
                     unpatrolled at less well-established crossings. To allow through-traffic by trains, travellers
                     had to submit (at their cost) to medical examinations in Sydney and at arrival in Melbourne.
                     Enterprising individuals circumvented this by booking the train to Albury, crossing the
                     border by taxi to Wodonga, where they booked a seat on the train to Melbourne [93,94].
                     In response, Quarantine officers were placed at the Albury bridge at random intervals.
                     People wishing to avoid quarantine detention resorted to crossing the bridges when not
                     staffed, using less frequented crossings or even swimming the river [89,90,95,96]. The
                     police responded by increasing their presence which included patrolling the river by
                     boat [95,96]. Many of those who crossed illegally were eventually tracked down and placed
                     in quarantine [97].
                           Other closures were more selective and specific. The rapid development of heavy
                     road transport in the 1930s, hauling goods interstate, posed a threat to the viability of
                     state-owned railways. Consequently, New South Wales (in 1931) and Victoria (in 1935)
                     imposed restrictions on interstate road traffic, until Privy Council in London declared this
                     unconstitutional in 1947 [98,99].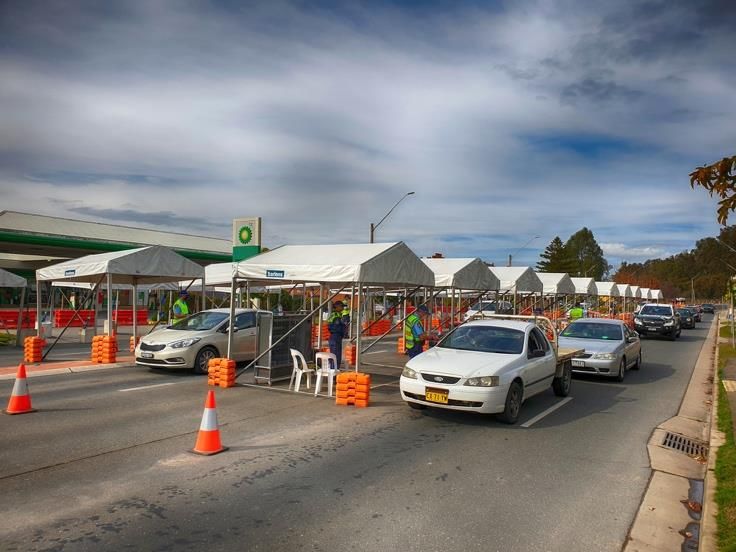
the river by boat [95,96]. Many of those who crossed illegally were eventually tracked
down and placed in quarantine [97].
Other closures were more selective and specific. The rapid development of heavy
Land 2021, 10, 610 road transport in the 1930s, hauling goods interstate, posed a threat to the viability of
8 of 26
state-owned railways. Consequently, New South Wales (in 1931) and Victoria (in 1935)
imposed restrictions on interstate road traffic, until Privy Council in London declared this
unconstitutional in 1947 [98,99].
Unlike
Unlike the
the politically
politically motivated
motivated border
border closures
closures toto long-haul
long-haul heavy
heavy goods
goods traffic,
traffic, the
the
other border controls were motivated by public and agricultural
other border controls were motivated by public and agricultural health. health.
Between
Between August
August 19371937 and
and April
April 1938,
1938, when
when News
News South
South Wales
Wales prevented
prevented Victorian
Victorian
children
children under the age of 16 from entering unless they could produce aa medical
under the age of 16 from entering unless they could produce medical certificate
certificate
vouching
vouching that
that they
they had
had not
not been
been exposed
exposed toto aa contact
contact suffering
suffering from
from infantile
infantile paralysis
paralysis
(poliomyelitis).
(poliomyelitis). Special
Special constables
constables were
were commissioned
commissioned to to police
police this
this at
at all border crossings
all border crossings
from
from Victoria
Victoria [100]. Finally, to
[100]. Finally, to combat the fruit
combat the fruit fly,
fly, in
in June
June 1959
1959 Victoria
Victoria prohibited
prohibited thethe
import
import of a range of fruits into the state and instituted checks on imported fruit
of a range of fruits into the state and instituted checks on imported fruit at
at border
border
crossings [101]. InInthe
crossings [101]. theAlbury-Wodonga
Albury-Wodongaarea, area, inspection
inspection stations
stations were
were established
established at
at the
the Albury railway station (for goods shipped by rail) and on Causeway
Albury railway station (for goods shipped by rail) and on Causeway Island (on the flood- Island (on the
floodplain) to inspect all road traffic. To emphasise the scientific need for this disruption of
plain) to inspect all road traffic. To emphasise the scientific need for this disruption of the
the cross-border traffic, fruit fly inspectors staffing the road blocks carried note boards and
cross-border traffic, fruit fly inspectors staffing the road blocks carried note boards and
wore white laboratory coats (Figure 2) [102]. This practice was discontinued and replaced
wore white laboratory coats (Figure 2) [102]. This practice was discontinued and replaced
by mobile spot checks in 1980 [103].
by mobile spot checks in 1980 [103].
Figure
Figure 2.
2. Fruit
Fruit fly
fly checkpoint
checkpoint on
on the
the Lincoln Causeway, August
Lincoln Causeway, August 1961
1961 (Image:
(Image: Wodonga
WodongaHistorical
HistoricalSociety).
Society).
6. Decentralisation
While Indigenous Australia prior to the European invasion had essentially
essentially been aa
decentralised and distributed occupation, colonial
colonial and later Federal Australia
Australia had always
always
been centralised. Some resource extraction and industrial centres (e.g., Ballarat, Bendigo,
Lithgow, Port Kembla) notwithstanding, the European population
population focussed
focussed onon the
the mer-
cantile and small-industrial capacity and the resulting employment
employment opportunities in the the
respective capital cities. The common denominator
denominator of the period until the early 1970s is
that while cross-border commerce, as well as cross-border
cross-border social
social contact
contact existed,
existed, the
the level
level
of integration of the cross-border communities remained limited. In all paired commu-
nities, one community was significantly larger, while the other continued to function, in
essence, as a bridgehead. Albury-Wodonga was no different, as evidenced by the overall
population figures (Table 2). Changes to communications infrastructure (the bridge in 1861)
and political arrangements (Federation in 1901) are well reflected in the changes to the
relative proportion of the two communities, followed by periods of proportional stability
(Figure 3). An effective plateau of Wodonga’s population, being about one-third of that of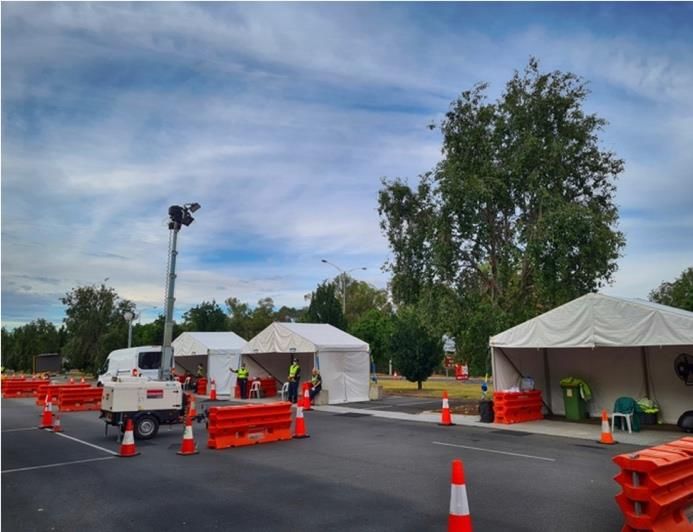
Land 2021, 10, 610                                                                                        9 of 26

                     Albury’s, was reached after World War I and remained stable for 50 years. That changed
                     when the Whitlam Labour government was elected to power in 1972. Now, the Com-
                     monwealth government embarked on an ambitious program of decentralisation, planning
                     the establishment of a number of regional growth centres in the wheat-sheep belt of SE
                     Australia, with state and federal governments providing financial incentives for companies
                     to relocate production there [104–106]. One of these was Albury-Wodonga, which was
                     formally announced on 25 January 1973. Planning and execution were handed to the
                     Albury-Wodonga Development Corporation (AWDC), which was given wide-ranging
                     planning powers to acquire and subdivide land in order to develop both Albury and
                     Wodonga. This led, inter alia, to the Greenfields communities of Thurgoona (Albury) and
                     Baranduda (Wodonga), both of which have since then become nuclei for further expansion.
                     While the national growth centre strategy was abandoned with the change of government
                     at the next election [104], the ADWC continued, albeit less well funded and later (in 1992)
                     it was disembowelled by the removal of planning powers, as a land management agency
                     until its formal wind-down in 2003 [104].

                     Table 2. Population growth of Albury and Wodonga.

                        Year      Albury     Wodonga     Source          Year   Albury    Wodonga     Source
                        1835                                             1954   16,736      5260     [105,107]
                        1846         65                   [108]          1961   18,621      7501     [108,109]
                        1851        442                   [108]          1966   25,112      8653     [105,108]
                        1854                    34         [44]          1971   28,420     10,530    [105,108]
                        1856         645                  [108]          1976   32,944     15,733      [110]
                        1861        1587        254     [108,111]        1981   37,350     19,540      [105]
                        1871        2592        359     [108,112]        1991   39,190     23,160      [105]
                        1881        5715        788     [108,113]        1996   42,322     30,200      [110]
                        1891        5447        891     [108,114]        2001   42,314     30,921    [115,116]
                        1901        5821        941       [108]          2006   46,282     33,010    [117,118]
                        1911        6309       1510     [110,119]        2011   47,810     35,519    [120,121]
                        1921        7751       2553     [108,122]        2016   51,076     39,351    [123,124]
                        1933       10,543      3250       [110]          2021   54,353     42,083    Estimates
                        1947       14,412      4273     [108,125]

                           While the AWDC could embark on a unified planning strategy, it remained hamstrung
                     by the vast range of administrative and jurisdictional anomalies created by differences
                     in New South Wales and Victorian state legislation [105,126]. The lack of a national
                     approach, coupled with the return of planning powers to the local councils in 1992, saw
                     the resurgence of parochial interests, with both Albury and Wodonga competing with each
                     other for businesses and residents [104,105].
                           In the 1980s and 1990s, the combined rural service centre of Albury-Wodonga began
                     to feel the impact of the decline of the railways and the rise of road transport. A number
                     of its large wool stores were forced to close, such as Younghusband’s (1986), Farmers and
                     Graziers Wool Store (1997) and Dalgety’s (2002). The flour mill closed in 2008 and the
                     paper mill (founded in 1983) closed in 2019. Increased globalisation and competition from
                     countries with cheaper labour saw a decline in production, resulting in the closure of
                     Macquarie Textiles in 2013 [127], while the DSI automotive transmission plant (founded as
                     Borg-Warner in 1970 facilitated by industry incentives) [128] was closed in 2014 when its
                     Chinese owners repatriated the IP [129].
                           While the economic impact on the communities forced the realisation that Albury
                     and Wodonga should collaborate rather than compete, parochialism and individualism
                     abounded. Even though the two councils made a number of attempts at collaboration, as
                     documented in various Memoranda of Understanding between 1998 and 2017 [130–132],
                     the real drivers for integration were the State governments who had the power to overcome
                     the vast range of border anomalies [126]. While the 2001 push by the State governments
                     to create a National City failed, largely due to intransigence by one of the local coun-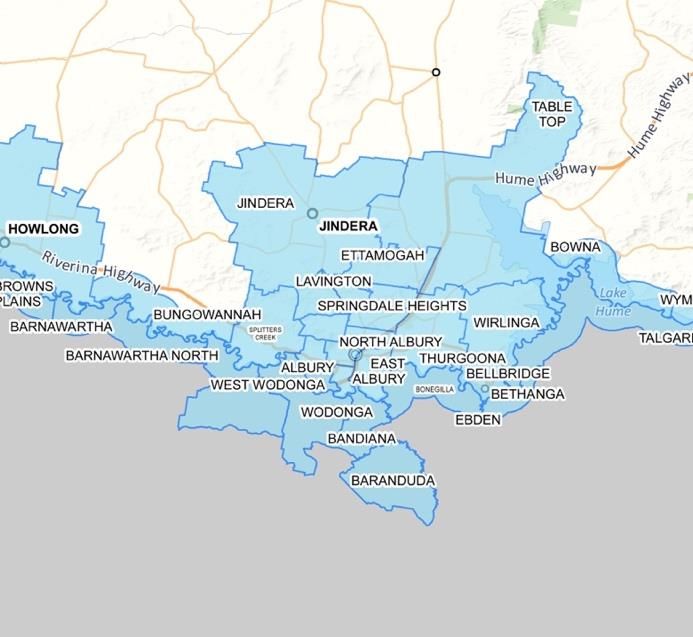
Land 2021, 10, 610 10 of 26
cils [105], integration occurred on a gradual, yet systematic level. Over the past decade,
the health systems, in particular, have become closely integrated with all obstetrics, for
example, in Wodonga and all oncology in Albury [133,134]. A multi-governmental level
Land 2021, 10, x FOR PEER REVIEW agreement on further integration and cross-border planning and regulatory harmonisation
10 of 28
was announced in mid-2020 [135].
Figure 3.
Figure Development of
3. Development of the
the population
population of
of Albury
Albury and
and Wodonga
Wodonga with
with significant
significant events
eventsmarked
marked(for
(fordata
datasee
seeTable
Table 2).
2).
The dashed line shows the population of Wodonga in percent of the population of Albury. Events: 1—formation
The dashed line shows the population of Wodonga in percent of the population of Albury. Events: 1—formation of the of the
Murray; 3—Victorian
Colony of Victoria; 2—opening of the bridge across the Murray; railway reaches
3—Victorian railway reaches Wodonga;
Wodonga; 4—Federation;
4—Federation;
5—Bonegilla Migrant
MigrantCentre
Centreopens;
opens;6—Albury-Wodonga
6—Albury-Wodonga Development
Development Corporation
Corporation formed;
formed; 7—Albury-Wodonga
7—Albury-Wodonga De-
Develop-
velopment Corporation
ment Corporation ceases.
ceases.
In the 1990s
While and early
the AWDC could2000s, the desire
embark for an affordable
on a unified planninglifestyle
strategy,and rural accommo-
it remained ham-
dation by
strung sawthe thevast
growth
rangeofofdormitory towns and
administrative that jurisdictional
ring Albury-Wodonga:
anomaliesChiltern,
created Howlong,
by differ-
Gerogery
ences in NewandSouth
Jindera in New
Wales South Wales
and Victorian stateand Barnawartha,
legislation Beechworth,
[105,126]. The lack ofBellbridge,
a national
Bethanga, coupled
approach, Tallangatta and
with theYackandandah
return of planningin Victorias,
powerswith Rutherglen
to the (Vic) in
local councils and Corowa
1992, saw
(NSW)
the a bit further
resurgence afield (Figure
of parochial 1) [136].
interests, with both Albury and Wodonga competing with
each The
othereffects of this integration
for businesses and residents are[104,105].
well reflected in the relative proportion of the
resident population. While the population
In the 1980s and 1990s, the combined rural of both communities
service increased continually
centre of Albury-Wodonga began
to feel the impact of the decline of the railways and the rise of road transport.even
(Table 2), centralised planning caused the population imbalance to gradually out: in
A number
1971
of its the
largepopulation
wool stores of were
Wodongaforced was 37% ofsuch
to close, thatas
ofYounghusband’s
Albury, while in 2021 (1986),it was
Farmersat 77.4%
and
(Figure 3).
Graziers Both
Wool Albury
Store (1997)andandWodonga
Dalgety’s have become
(2002). The communities
flour mill closed withina 2008
high and
leveltheof
intercensal migration primarily to and from other locations in Australia
paper mill (founded in 1983) closed in 2019. Increased globalisation and competition from (Table 3). This has
increased with
countries significantly
cheaper since
labour the
sawmid-1970s.
a declineCompared to the
in production, overall in
resulting population
the closure growth
of Mac-of
the two communities, the growth of the permanent, non-migrating
quarie Textiles in 2013 [127], while the DSI automotive transmission plant (founded as population has been
much slower.inInter-community
Borg-Warner 1970 facilitated by relocation
industry of a primary
incentives) residence
[128] between
was closed Albury
in 2014 whenand its
Wodonga is very small (2.3–3.1%
Chinese owners repatriated the IP [129]. of the non-migrating population), with an intercensal
net gain
While forthe
Wodonga
economic of between
impact on 20the
andcommunities
30 persons per yearthe
forced (Table 4, Figure
realisation 4).Albury
that Today,
Albury and Wodonga are a community with shared facilities
and Wodonga should collaborate rather than compete, parochialism and individualism and economy with large
abounded. Even though the two councils made a number of attempts at collaboration, as
documented in various Memoranda of Understanding between 1998 and 2017 [130–132],
the real drivers for integration were the State governments who had the power to over-
come the vast range of border anomalies [126]. While the 2001 push by the State govern-Land 2021, 10, 610 11 of 26
numbers of people living and working on different sides of the border. The proportion
of Albury–Wodonga citizens residing in one but working in the other town has increased
from 19.8% in the 2006 census to 22.7% in the 2016 census (Table 5). Including the adjacent
communities, the total of the cross-border movement now involves about a quarter of the
workforce. This figure does not include high school and university students who may
reside in one town and study in the other, nor does it include casual border crossings, for
example, to access medical facilities.
Table 3. Changes in residential addresses (%) in intercensal periods for Albury and Wodonga.
Usual Address Five Years Prior
Census Total
No Change Other Australia Overseas
1976 73.99 23.36 2.65 33,451
2006 58.14 40.27 1.58 38,275
Albury
2011 57.49 39.57 2.93 42,092
2016 55.74 41.79 2.48 43,907
1976 60.07 37.89 2.04 15,905
2006 54.27 44.13 1.61 27,618
Wodonga
2011 53.93 44.03 2.04 31,378
2016 52.99 45.15 1.86 33,866
Data sources: AWDC 1978; Census of Population and Housing, 2006, 2011, 2016, Persons, Place of Usual Residence
TableBuilder.
Table 4. Relocation of residences between Albury and Wodonga in absolute numbers and in percent
of the total population.
Albury > Wodonga Wodonga > Albury Net Gain Wodonga
Intercensal Period
n % n % 130
2001–2006 940 2.5 810 2.9 130
2006–2011 968 2.3 845 2.7 123
2011–2016 1172 2.7 1051 3.1 121
Data sources: Census of Population and Housing, 2006, 2011, 2016, Persons, Place of Usual Residence TableBuilder.
Table 5. Relationship of the place of residence with the place of work (in percent of residents in employment) for the census
years 2006, 2011 and 2016 (Source Census of Population and Housing, 2006, 2011, 2016, Table Builder).
Place of Residence
2006 n
Albury Corowa Gr. Hume Indigo Towong Wodonga
Albury 70.19 1.49 4.90 3.71 1.41 17.95 21,411
Corowa 3.31 79.87 3.10 11.79 — 1.93 3418
Greater Hume 9.97 2.93 84.20 0.88 0.67 1.35 2969
Place of Work Indigo 4.13 10.19 0.30 73.42 0.70 9.21 4289
Towong 1.59 — 0.53 3.07 91.43 3.07 1891
Wodonga 22.46 1.33 1.65 8.78 1.95 63.04 15,508
Place of Residence
2011 n
Albury Corowa Gr. Hume Indigo Towong Wodonga
Albury 68.82 1.49 4.97 3.78 1.36 19.10 20,926
Corowa 4.25 78.51 1.28 13.91 — 2.20 3365
Greater Hume 13.95 0.93 81.56 0.63 0.59 2.35 3026
Place of Work Indigo 4.46 9.13 0.33 74.21 0.97 8.63 4218
Towong 2.47 — 0.27 4.09 88.97 4.09 1859
Wodonga 25.08 1.54 1.72 8.61 1.97 60.25 15,548
Place of Residence
2016 n
Albury Federation Gr. Hume Indigo Towong Wodonga
Albury 66.08 1.64 5.06 4.20 1.43 21.04 24,059
Federation 5.25 76.03 1.78 13.77 — 2.93 3922
Greater Hume 15.77 1.60 79.21 0.22 0.26 3.01 3127
Place of Work Indigo 4.92 8.08 0.43 72.22 1.14 10.77 4392
Towong 3.09 — 0.21 4.22 86.36 5.25 1943
Wodonga 24.92 1.53 1.76 8.14 1.87 60.94 18,111Land 2021, 10, 610 12 of 26
Land 2021, 10, x FOR PEER REVIEW 13 of 28
Figure 4. Cross-border
Figure 4. Cross-border commuting
commuting in in 2016
2016 in percent of
in percent of residents
residents in
in employment
employment in in aa given
given local
local government
government area.
area. The
The
black circles indicate the location of river crossings for pedestrian or vehicular use. See Table 3 for data.
black circles indicate the location of river crossings for pedestrian or vehicular use. See Table 3 for data.
7. Effects of Border Closures during the COVID-19 Epidemic
7. Effects of Border Closures during the COVID-19 Epidemic
While the extensive level of cross-border integration of facilities and services, as well
While the extensive level of cross-border integration of facilities and services, as
as cross-border commuting, fulfilled the political aims of the two states, it became a liabil-
well as cross-border commuting, fulfilled the political aims of the two states, it became a
ity with with
liability the emergence
the emergenceof theofCOVID-19
the COVID-19pandemic.
pandemic.Following
Followinga series of increasingly
a series of increasingly re-
strictive
restrictive measures,
measures, NSWNSW and
andVictoria
Victoriawent
wentintointoaastage
stage33lockdown
lockdownon on 3131 March
March 2020
2020
which lasted until mid-May 2020 [137–142]. That lockdown
which lasted until mid-May 2020 [137–142]. That lockdown did not reveal the did not reveal the issues
issuesas
both communities were equally affected. Following the escape
as both communities were equally affected. Following the escape of COVID-19 from of COVID-19 from Mel-
bourne
Melbourne hotels housing
hotels overseas
housing overseasreturnees in quarantine
returnees in quarantine in late June
in late 2020,
June andand
2020, seeding
seeding in
the community, the NSW state government unilaterally declared
in the community, the NSW state government unilaterally declared that the state borderthat the state border be-
tween
between NSW NSW andand
Victoria
Victoriabe closed on on
be closed 8 July 2020
8 July [143].
2020 Suddenly,
[143]. Suddenly,almost a quarter
almost of the
a quarter of
workforce could no longer reach their place of work. This impact
the workforce could no longer reach their place of work. This impact was compounded was compounded by the
inability to shop to
by the inability across
shopthe border,
across the which
border,disproportionately
which disproportionatelyaffected Albury
affectedasAlbury
the town as
has a greater range of specialty shops. Some smaller dormitory communities,
the town has a greater range of specialty shops. Some smaller dormitory communities, such as Bell-
bridge
such asand Bethanga
Bellbridge and(Figure 1), for(Figure
Bethanga example, 1), are
for located
example, in Victoria,
are located butinfor all theirbut
Victoria, goods
for
and services,
all their goods including fuel, rely
and services, on unfettered
including fuel, rely access to either Albury
on unfettered or either
access to Wodonga. Albury Withor
the firm border
Wodonga. Withclosures
the firminborder
place, closures
the trip to
inWodonga
place, therequired a 59 km detour,
trip to Wodonga required extending
a 59 km
the travel
detour, time by 50
extending themin.
travel time by 50 min.
Not surprisingly,
Not surprisingly, the thepracticalities
practicalitiesof of enforcing
enforcing thethe original
original Border
Border ControlControl
OrderOrder
[143]
[143] and the implications of that enforcement on the communities
and the implications of that enforcement on the communities brought about a flurry brought about a flurryof
of modifications,
modifications, primarilyininthe
primarily theform
formofoflimited
limited exemptions
exemptions and adjustments
adjustments (Table(Table 6).6).
Administratively,
Administratively, the the decision-makers
decision-makers were were not
not prepared
prepared for for such an eventuality and thus
were forced frequently to adjust their approach on an ad-hoc basis. A week after the fullLand 2021, 10, 610 13 of 26
Land 2021, 10, x FOR PEER REVIEW 14 of 28
were forced frequently to adjust their approach on an ad-hoc basis. A week after the
full closure, once the urgent demand for limited cross-border traffic became evident, a
generic, not
closure, mapped-out
once border for
the urgent demand zone was cross-border
limited established traffic
to allow cross-border
became evident, a communities
generic,
to function, with cross-border
not mapped-out border zone wastraffic permitted
established to on a demonstrable
allow needs basisto[143].
cross-border communities func-Given
thetion, with
rising cross-border
number traffic
of cases permitted on
in Melbourne anda demonstrable needs basisinto
seeding of SARS-CoV2 [143]. Given the
regional Victoria,
rising number of cases in Melbourne and seeding of SARS-CoV2 into regional
NSW reacted and stipulated a very narrow border corridor on 20 July 2020 (Figure 5) [144], Victoria,
NSWnot
which, reacted and stipulated
surpassingly, a very narrow
resulted border
in severe corridor onon
restrictions 20 July 2020 (Figure
cross-border 5) [144],
movements in
which, not surpassingly, resulted in severe restrictions on cross-border movements in Al-
Albury-Wodonga. These rapidly changing conditions brought about confusion among the
bury-Wodonga. These rapidly changing conditions brought about confusion among the
border communities, coupled with a growing sense of frustration and resentment at the
border communities, coupled with a growing sense of frustration and resentment at the
seemingly arbitrary boundaries [145].
seemingly arbitrary boundaries [145].
Figure 5. Map of the NSW-defined COVID-19 border buffer zone between New South Wales and Victoria, 28 July 2020
Figure 5. Map of the NSW-defined COVID-19 border buffer zone between New South Wales and Victoria, 28 July 2020 [146].
[146].
Table 6. Border
Table Control
6. Border Controlorders
orders NSW (8 July–23
NSW (8 July–23November
November 2020).
2020).
Title Title Duration
Duration Ref. Ref.
Public Health (COVID-19 Border Control)
Public Health (COVID-19 Border Control) Order 2020 Order 2020 8–22July
8–22 July [143] [143]
Public
Public HealthHealth (COVID-19
(COVID-19 Border Amendment
Border Control) Control) Amendment
Order Order 22–22July
22–22 July [147] [147]
Public Health
Public (COVID-19
Health BorderBorder
(COVID-19 Control)Control)
Amendment (Border Community)
Amendment Order
(Border Community) Order 22–24
22–24July
July [148] [148]
Public Health (COVID-19 Border Control) Amendment (Vulnerable Persons) Order 24–25 July [149]
Public Health (COVID-19 Border Control) Amendment (Vulnerable Persons)
Public Health (COVID-19 Border Control) Amendment (Medical & Hospital Services) Order
Order 24–25 July
25 July–7 August
[149] [150]
Public Public
HealthHealth
(COVID-19 Border Control) Amendment (Medical
(COVID-19 Border Control) Amendment Order (No 2) & Hospital Services) Or- 7–13 August [151]
25 July–7 August [150]
Public Health (COVID-19 Border Control) Amendment der (Transiting ACT Residents) Order 13–17 August [152]
Public Health (COVID-19 Border
Public Health Control) Order
(COVID-19 2020Control)
Border Remote Communities
AmendmentAmendment
Order (No 2) 13 August–
7–13 August [151] [153]
Public Health (COVID-19 Border Control) Order 2020 School Exemption Amendment 20 August– [154]
Public Public
HealthHealth
(COVID-19 Border Control) Amendment (Transiting
(COVID-19 Border Control) Amendment Order (No 3) ACT Residents) Order
18 August–1 August
13–17 September [152] [155]
Public
Public Health
Health (COVID-19
(COVID-19 Border Border
Control)Control)
Order 2020Order 2020
(Flight Remote
Crew Communities
Exemption Amendmt 4Amendment 13 August–
4 September– [153] [156]
Public
Public Health
Health (COVID-19
(COVID-19 BorderControl)
Border Control) Amendment
Order 2020 Order (No
School 4)
Exemption Amendment 4–1220September
August– [154] [157]
Public Health (COVID-19 Border Control) Amendment Order (No 5) 12–17 September [158]
Public Health (COVID-19 Border Control) Amendment Order (No 6) 17–25 September [159]
Public Health (COVID-19 Border Control) Amendment Order (No 7) 25–28 September [160]
Public Health (COVID-19 Border Control) Amendment Order (No 8) 28 September–2 October [161]
Public Health (COVID-19 Border Control) Order (No 2) 2020 2–16 October [162]
Public Health (COVID-19 Border Control) (No 2) Amendment Order 16 October–23 November [163]
Public Health (COVID-19 Border Control) Order (No 2) Repeal Order 2020 23 November [164]Land 2021, 10, 610 14 of 26
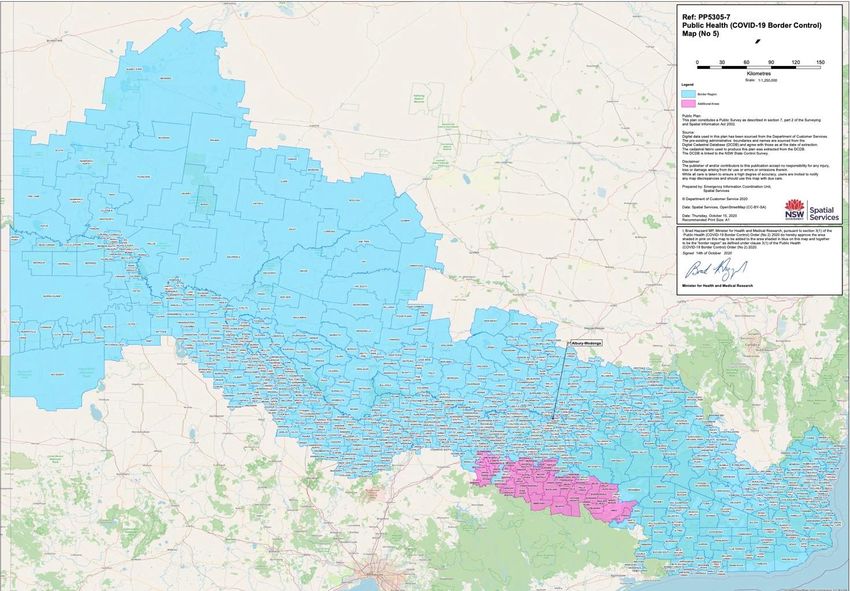
The boundaries were adjusted on 28 July to add communities adjacent to central
Wodonga, which had a high number of residents working in Albury (Figure 6) [146]. While
the new boundaries benefitted the majority of Albury-Wodonga residents, they did little to
alleviate the plight of some farmers who owned land on either side of the river, some of
which was just outside the bubble. It also affected agricultural workers, such as grain and
hay harvesting contractors owning high-capital, specialized machinery and who worked
on a regional or catchment basis with little if any regard to state boundaries.
Following the failure of ringfencing Melbourne and environs, as well as a display of
selfishness by some residents blatantly flaunting the movement restrictions [165], Victoria
moved on 2 August to declare a state-wide stage 3 locked down [166] and stage 4 (with
curfew) for Melbourne [167]. While the border zone boundaries did not change at that stage,
New South Wales restricted the nature of cross-border access [151]. Once the Victorian
cases decreased again, NSW agreed (effective 4 September 2020) to a new and much wider
cross-border zone which took into account the need for movement of agricultural workers
and contractors (Figure 7) [168]. The border zone boundaries were adjusted on 15 October
2020, expanding the zone to the Alpine areas (Figure 8). The enforcement of the cross-
border movement restrictions relied on permits that needed to be verified individually at
roadblocks (Figure 9), with reports of persons trying to be smuggled through the control
Land 2021, 10, x FOR PEER REVIEW points [169,170]. Once the Melbourne outbreak had been suppressed, the border controls
16 of 28
were lifted on 23 November 2020 [164].
Figure 6.
Figure 6. Map
Map of
of the
the NSW-defined
NSW-defined COVID-19
COVID-19 border
border buffer
buffer zone
zone between
between New
New South
South Wales
Wales and
and Victoria,
Victoria, 22 September
September
2020 [168]
2020 [168]. .Land 2021, 10, 610 15 of 26
Figure 6. Map of the NSW-defined COVID-19 border buffer zone between New South Wales and Victoria, 2 September
2020 [168].
(a) 20 July 2020 (b) 28 July 2020
Land 2021, 10, 7.
Figure x FOR PEER REVIEW
Boundary adjustmentsofofthe
theNSW-defined
NSW-definedCOVID-19
COVID-19 border buffer zone between New South Wales 17 of 28
Figure 7. Boundary adjustments border buffer zone between New South Wales andand Vic-
Victoria
toria
in thein the immediate
immediate Albury-Wodonga
Albury-Wodonga area,2020
area, July 2020 [144,146].
July[144,146].
Figure 8. Map of the NSW-defined COVID-19 border buffer zone between New South Wales and Victoria, 15 October 2020
Figure 8. Map of the NSW-defined COVID-19 border buffer zone between New South Wales and Victoria, 15 October
[171].
2020 [171].Land 2021, 10, 610 16 of 26
Land 2021, 10, x FOR PEER REVIEW 18 of 28
FigureFigure
9. Ephemera—Border permits to enter
9. Ephemera—Border New South
permits Wales
to enter Newfrom Victoria
South (Australia).
Wales (Left): early
from Victoria type in July(Left):
(Australia). 2020, early
(Right): late type (example December 2020) [172].
type in July 2020, (Right): late type (example December 2020) [172].
When Sydney detected an outbreak in its Northern Beaches area on 16 December
When Sydney detected an outbreak in its Northern Beaches area on 16 December
2020 and the cluster grew in subsequent days, the Victorian government began to exclude
2020 and the cluster
visitorsgrew in subsequent
from designated days,[173]
“red” zones the and
Victorian government
subsequently closed the began to exclude
border with NSW
visitors from designated
altogether on“red” zones
1 January 2021[173]
[174].and subsequently
In this case, however, closed the border
the Victorian with
government NSW
estab-
altogether on 1lished a “bubble”
January 2021for[174].
the border communities
In this that was more
case, however, thegenerously
Victorian zoned and was
government
based on LGA boundaries (Figure 10). While the Victorian government issued a flurry of
established a “bubble” for the border communities that was more generously zoned and
modifications to the border crossing regulations (Table 7), these did not affect the shape
was based on LGA boundaries
of the bubble. A range(Figure 10). structures
of temporary While the wasVictorian government
erected accompanied issued
by traffic con- a
flurry of modifications
trols and signage (Figures 11 and 12) [175]. The stringent roadblocks were removed on 29the
to the border crossing regulations (Table 7), these did not affect
JanuaryA2021
shape of the bubble. rangeand of
replaced
temporaryby mobile random checks
structures [176] to detect
was erected individualsby
accompanied coming
traffic
from restricted areas.
controls and signage (Figures 11 and 12) [175]. The stringent roadblocks were removed on
29 January 2021 and replaced by mobile random checks [176] to detect individuals
Land 2021, 10, x FOR PEER REVIEW 19 of 28coming
from restricted areas.
Figure 10. Map (section) of the Victoria-defined COVID-19 border buffer zone between New South
Figure 10. Map (section) of the Victoria-defined COVID-19 border buffer zone between New South
Wales and Victoria, 3 February 2021 [177].
Wales and Victoria, 3 February 2021 [177].You can also read


