Non-Pathogenic Mopeia Virus Induces More Robust Activation of Plasmacytoid Dendritic Cells than Lassa Virus - MDPI
←
→
Page content transcription
If your browser does not render page correctly, please read the page content below
viruses
Article
Non-Pathogenic Mopeia Virus Induces More Robust
Activation of Plasmacytoid Dendritic Cells
than Lassa Virus
Justine Schaeffer 1,2 , Stéphanie Reynard 1,2 , Xavier Carnec 1,2 , Natalia Pietrosemoli 3 ,
Marie-Agnès Dillies 3 and Sylvain Baize 1,2, *
 1    Unité de Biologie des Infections Virales Emergentes, Institut Pasteur, 69007 Lyon, France;
      schaeffer.justine.91@gmail.com (J.S.); stephanie.reynard@pasteur.fr (S.R.); xavier.carnec@pasteur.fr (X.C.)
 2    Centre International de Recherche en Infectiologie (INSERM, CNRS, ENS Lyon, Université Lyon I),
      69007 Lyon, France
 3    Hub de Bioinformatique et Biostatistique–C3BI, Institut Pasteur, USR 3756 CNRS, 75015 Paris, France;
      natalia.pietrosemoli@pasteur.fr (N.P.); marie-agnes.dillies@pasteur.fr (M.-A.D.)
 *    Correspondence: sylvain.baize@pasteur.fr; Tel.: +33-437-2824-43

 Received: 28 January 2019; Accepted: 18 March 2019; Published: 21 March 2019

 Abstract: Lassa virus (LASV) causes a viral haemorrhagic fever in humans and is a major public
 health concern in West Africa. An efficient immune response to LASV appears to rely on type I
 interferon (IFN-I) production and T-cell activation. We evaluated the response of plasmacytoid
 dendritic cells (pDC) to LASV, as they are an important and early source of IFN-I. We compared
 the response of primary human pDCs to LASV and Mopeia virus (MOPV), which is very closely
 related to LASV, but non-pathogenic. We showed that pDCs are not productively infected by either
 MOPV or LASV, but produce IFN-I. However, the activation of pDCs was more robust in response to
 MOPV than LASV. In vivo, pDC activation may support the control of viral replication through IFN-I
 production, but also improve the induction of a global immune response. Therefore, pDC activation
 could play a role in the control of LASV infection.

 Keywords: Lassa virus; Mopeia virus; viral haemorrhagic fever; plasmacytoid dendritic cells;
 type I interferon

1. Introduction
     Lassa virus (LASV) has been listed by the World Health Organisation as one of the emerging
pathogens likely to cause severe outbreaks in the near future and for which few or no medical
countermeasures exist [1]. In humans, it causes a viral haemorrhagic fever (VHF), Lassa fever (LF).
LF is endemic in West Africa and causes tens of thousands of cases and several thousand deaths
every year [2]. There is currently no approved vaccine against LASV and only one partially efficient
treatment, ribavirin [3].
     LASV is an old world arenavirus. This phylogenetic group includes highly pathogenic viruses,
such as LASV or Lujo virus, and non-pathogenic viruses, such as Mopeia virus (MOPV) [4]. MOPV is
phylogenetically very close to LASV and has been isolated from Mastomys natalensis, which is a LASV
reservoir [5]. However, MOPV is non-pathogenic in non-human primates (NHPs), and no human case
of MOPV infection has ever been reported [4]. Comparing MOPV and LASV, two very similar viruses
with different pathogenic potential, may be a fruitful approach to identify immune and viral features
involved in LASV pathogenesis. Fatal LASV infection in human is associated with immunosuppression,
leading to uncontrolled viral replication and severe symptoms. In vivo studies have also shown that

Viruses 2019, 11, 287; doi:10.3390/v11030287                                        www.mdpi.com/journal/viruses
Viruses 2019, 11, 287                                                                            2 of 9

the survival of LASV-infected NHPs correlates with an early type I interferon (IFN-I) response and
robust T-cell responses [6].
     Plasmacytoid dendritic cells (pDC) are highly potent IFN-I producers [7]. They can detect
viral infection through Toll-like receptors (TLR) 7 and 9, as well as RIG-I-like receptors (RLR).
The constitutive expression of IRF7, which is usually an IFN-stimulated gene (ISG), partially explains
the efficiency of IFN-I production by pDCs [7]. During lymphocytic choriomeningitis virus (LCMV)
infection, pDCs are the major source of IFN-I [8]. In mice, pDCs were shown to be permissive to LCMV
infection, and both infected and non-infected pDCs produced IFN-I [9]. Considering these results and
the major role of IFN-I in LF, we decided to study the response of pDCs to LASV. We compared LASV
and MOPV to evaluate the importance of the pDC response in the high pathogenicity of LASV.
     The results presented here were obtained using primary human pDCs purified from the blood
of healthy donors. pDCs were not productively infected by either MOPV or LASV. On the contrary,
coculture between pDCs and MOPV- or LASV-infected cells led to the detection of viral proteins
in pDCs. We then analysed the IFN-I response of pDCs to MOPV and LASV. Both MOPV- and
LASV-infected pDCs produced IFN-I. However, the response of pDCs to LASV was rapidly shut
down. A larger scale approach, using transcriptomic and multiplex protein detection, showed stronger
activation of MOPV-infected than LASV-infected pDCs. Overall, these results show that MOPV is
a better stimulus for pDC activation than LASV. As pDCs are involved in the very early IFN-I response
in vivo, their ability to detect LASV and initiate a response could be critical during LF.

2. Materials and Methods

2.1. Virus and Cells
      VeroE6 cells were grown in DMEM with 0.5% penicillin-streptomycin (PS) and 5% foetal bovine
serum (FBS, all from Invitrogen, Cergy-Pontoise, France). Mopeia (AN21366 strain [4]) and Lassa
(AV strain [10]) viruses were grown in VeroE6 cells at 37 ◦ C, with 5% CO2 . LASV and MOPV
titres were determined by plaque immunoassays, as previously described [11]. MOPV and LASV
with a FLAG-tagged Z protein (MOPV-Zflag and LASV-Zflag) were obtained by reverse genetics,
as previously described [12]. Experiments with LASV were carried out in biosafety level 4 facilities
(Laboratoire P4 Jean Merieux-Inserm, Lyon, France).

2.2. Cell Purification
     Human peripheral blood was obtained from healthy donors with informed consent and was
provided by the Etablissement Français du Sang (Lyon, France, agreement PLER/1-1820-05/05/14).
Written informed consent was provided by all study participants. PBMCs were isolated by Ficoll
(GE Healthcare, Velizy, France) centrifugation. pDCs were isolated using the Diamond Plasmacytoid
Dendritic Cell Isolation kit II (Miltenyi Biotech, Paris, France). pDCs were cultured in RPMI 1640
Glutamax I, 0.5% PS, 10 mM HEPES, 1% nonessential amino acids, and 10% FBS (all from Invitrogen).
R848 (Invitrogen) treatment at 1 µg/mL was used as a positive control of activation.

2.3. RT-qPCR
     Cellular RNA was purified using the RNeasy kit (Qiagen, Courtaboeuf, France), followed by
DNAse I (Qiagen) and Ambion DNAse (Thermo Fisher Scientific, Waltham, MA, USA) digestion.
For viral RNA quantification, cells were treated prior to extraction with 0.05% trypsin (Invitrogen)
to remove adsorbed virions. Viral RNA from the cell medium was purified using the QIAmp Viral
RNA Mini Kit (Qiagen). IFN-I mRNA and viral nucleoprotein (NP) RNA was quantified by RT-qPCR,
as previously described [11]. Relative IFN-I mRNA levels were calculated as 2−∆Ct , with Ct the
cycle threshold and ∆Ct = [gene Ct] − [GAPDH Ct]. NP RNA was quantified (by copy number) by
comparing our samples with sequential dilutions of RNA standards. All runs were performed in
duplicate using a LightCycler480 (Roche Diagnostics, Meylan, France).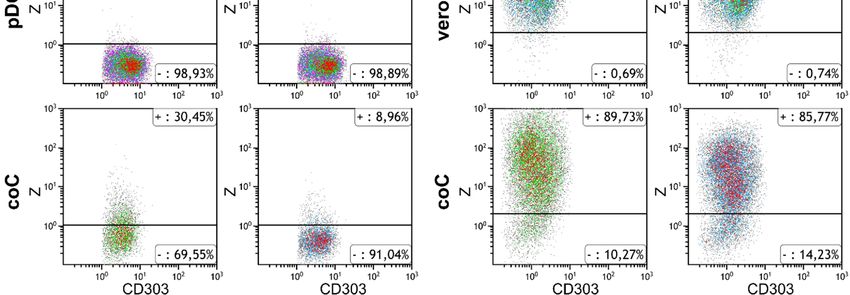
Viruses 2019, 11, 287                                                                                 3 of 9

2.4. Flow Cytometry
     For the “vero” condition, VeroE6 cells were infected with MOPV-Zflag or LASV-Zflag (MOI = 0.3)
and analysed 48 hours post infection (hpi) For the “pDC” condition, pDC were infected with
MOPV-Zflag or LASV-Zflag (MOI = 0.1) and analysed 24 hpi. For the “coC” condition, VeroE6 cells
were infected with MOPV-Zflag or LASV-Zflag (MOI = 0.3), pDCs were added 24 hpi and cells were
analysed 48 hpi. For analysis, cells were stained with Lin1-FITC (BD Biosciences, Le-Pont-de-Claix,
France) and CD303 (AC144)-PE-Vio770 (Miltenyi Biotech). Viral Z proteins were stained using
the FoxP3 Staining Buffer Set, FcR Blocking Reagent, and human and anti-DYKDDDDK-APC
(Miltenyi Biotech). Fluorescence was measured using a Gallios flow cytometer (Beckman Coulter, Brea,
CA, USA) and analysed using Kaluza software version 1.2 (Beckman Coulter). pDCs were gated as
Lin1-/CD303+ cells (Figure S1).

2.5. Transcriptomic Analysis
     pDCs were infected for 12 h at a MOI = 1 with LASV, MOPV, or remained uninfected. Cellular RNA
was purified using the RNeasy kit (Qiagen), followed by DNAse I (Qiagen) and DNAse (Ambion)
digestion. Sequencing were performed by ViroScan3D (Lyon, France). RNA quality was checked
using QuantiFluor RNA System (Promega, Charbonnières-les-Bains, France) and RNA 6000 Pico Kit
(Agilent, Santa Clara, CA, USA). cDNA were synthesized using random priming of poly-A RNAs
(NEXTFLEX Rapid Directional RNA-Seq Library Prep Kit, PerkinElmer, Boston, MA, USA). Single-end,
75-bp read-length NextSeq 500 High throughput sequencing of the cDNA library was performed.
After demultiplexing and trimming of the adaptors (with Bcl2fastq), 30 million reads per sample
were obtained. Sequencing quality was assessed for each sample (before and after mapping) using
FastQC. Reads were aligned on the human genome (Human GRCh38.p7, from ENSEMBL) using STAR
and a maximum mismatch rate of 5%. Reads aligned on each gene were counted using the module
feature count. Statistical analysis of the read counts (quality checks, normalisation using scaling factors,
fold change and p-values calculations) were performed using the R package SARTools (DESeq2) [13].
Genes were differentially expressed for p < 0.05. Heatmaps were generated with R (package heatmap2),
using genes with differential expression for at least one pairwise comparison.

2.6. Luminex
     pDCs were harvested 16 hpi and the culture medium collected. Fifty cytokines were quantified
using the Milliplex map kit Human Cytokine/Chemokine Magnetic Bead Panel (PX38) and Human
Cytokine/Chemokine Magnetic Bead Panel IV (Merck Millipore, Guyancourt, France). Runs were
performed with a Magpix luminex (Merck Millipore).

2.7. Statistical Analysis
     The mean and standard error of the mean (SEM) for each set of data were calculated using
R. Graphs were generated and statistical analysis performed using SigmaPlot (SyStat Software Inc,
San Jose, CA, USA). Differences were considered statistically significant at p < 0.05. Heatmaps were
generated using R.

3. Results

3.1. pDCs Were Not Productively Infected by MOPV or LASV
     We infected primary human pDCs with MOPV or LASV and quantified infectious particles or viral
RNA in the culture supernatant (Figure 1a,b). The viral titres of both MOPV and LASV decreased over
time, showing no release of infectious particles. At the same time, viral RNA levels in the supernatant
did not increase. These results show that pDC infection by MOPV or LASV is not productive. To assess
pDC infection earlier in the viral cycle, we quantified viral RNA from MOPV- and LASV-infected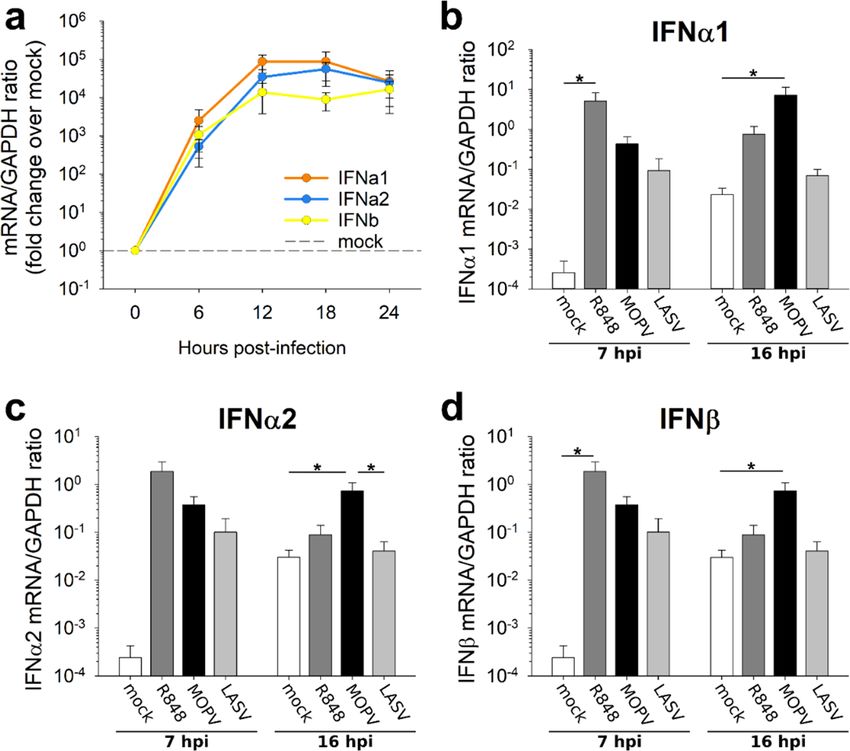
MOPV behaved similarly by infecting VeroE6 cells with MOPV or LASV, culturing pDCs with viral
particles or infected cells, and staining the pDCs for the viral Z protein (Figure S1). No Z-positive
pDCs were found following incubation with viral particles (Figure 1d–f). However, following
coculture with infected VeroE6, 10% (for LASV) to 30% (for MOPV) of pDCs were Z-positive. Z
Viruses
proteins      11, 287 in pDCs could either come from the neosynthesis or internalization of existing 4viral
        2019,detected                                                                                       of 9

components. We also observed a decrease in infected VeroE6 in the pDC/infected VeroE6 cocultures
(Figure
pDCs       1e–g),1c).
        (Figure     suggesting
                       Adsorbedthat  coculture
                                  viral         with
                                        particles    pDCs
                                                  were       partially
                                                        removed        controlledwith
                                                                  by incubation   VeroE6   infection
                                                                                       trypsin. Therebywere
                                                                                                        MOPVno
significant differences in the levels of MOPV and LASV RNA between 1 hpi, 1 day post-infection while
and    LASV.    VeroE6  cells are unable  to produce   IFN-I, but  are susceptible  to exogenous   IFN-I, (dpi),
pDCs
and      are specialized
      2 dpi.  Thus, therein  theno
                           was   production
                                   detectableofreplication
                                                 IFN-I in response  to pathogens.
                                                            and transcription      Thus, the
                                                                               of MOPV    andcontrol
                                                                                              LASV ofin VeroE6
                                                                                                        pDCs.
infection observed in VeroE6-pDC cocultures could result from the production of IFN-I by pDCs.

     Figure 1. pDC infection by MOPV and LASV. (a) pDCs were infected with MOPV or LASV (MOI = 0.1)
      Figure 1. pDC infection by MOPV and LASV. (a) pDCs were infected with MOPV or LASV (MOI =
     and infectious particles in the culture medium quantified. (b,c) pDCs were infected with MOPV or
      0.1) and infectious particles in the culture medium quantified. (b,c) pDCs were infected with MOPV
     LASV (MOI = 0.1) for 1 h (day 0), 1 day, or 2 days. Viral RNA in the culture medium (b) or inside the
      or LASV (MOI = 0.1) for 1 h (day 0), 1 day, or 2 days. Viral RNA in the culture medium (b) or inside
     cells (c) was quantified by RT-qPCR. (d–g) VeroE6 cells were infected with MOPV-Zflag or LASV-Zflag
      the cells (c) was quantified by RT-qPCR. (d–g) VeroE6 cells were infected with MOPV-Zflag or LASV-
     (MOI = 0.3). After 24 h, pDCs were added to the cells, or infected with MOPV-Zflag or LASV-Zflag
      Zflag (MOI = 0.3). After 24 h, pDCs were added to the cells, or infected with MOPV-Zflag or LASV-
     (MOI = 0.1). 24 h later, cells were stained for phenotypic markers and the Z protein. Conditions were:
      Zflag (MOI = 0.1). 24 h later, cells were stained for phenotypic markers and the Z protein. Conditions
     infected VeroE6 ("veroE6"), VeroE6 cultured with pDCs ("coC"), and infected pDCs (“pDC”). Z-positive
      were: infected VeroE6 ("veroE6"), VeroE6 cultured with pDCs ("coC"), and infected pDCs (“pDC”).
     pDCs (d–f) and VeroE6 cells (e–g) were quantified by flow cytometry. All data are presented as
      Z-positive pDCs (d–f) and VeroE6 cells (e–g) were quantified by flow cytometry. All data are
     the mean and standard error of mean (SEM) of three independent experiments. ANOVA on Ranks
      presented as the mean and standard error of mean (SEM) of three independent experiments. ANOVA
     followed by pairwise comparisons (Tukey test) were performed. Differences are significant for p < 0.05.
     When significant, P values of the ANOVA are indicated on the graph. Significant pairwise comparisons
     are indicated by a star (*).

     In vivo, pDCs are not only in contact with viral particles, but also with infected cells. Infected cells
could affect the properties of pDCs, including their permissivity. We tested whether LASV and MOPV
behaved similarly by infecting VeroE6 cells with MOPV or LASV, culturing pDCs with viral particles or
infected cells, and staining the pDCs for the viral Z protein (Figure S1). No Z-positive pDCs were found
following incubation with viral particles (Figure 1d–f). However, following coculture with infected
Viruses 2019, 11, 287 5 of 9
VeroE6, 10% (for LASV) to 30% (for MOPV) of pDCs were Z-positive. Z proteins detected in pDCs could
either come from the neosynthesis or internalization of existing viral components. We also observed
a decrease in infected VeroE6 in the pDC/infected VeroE6 cocultures (Figure 1e–g), suggesting that
coculture with pDCs partially controlled VeroE6 infection by MOPV and LASV. VeroE6 cells are unable
to produce IFN-I,
Viruses 2019, 11, xbut
FORare susceptible
PEER REVIEW to exogenous IFN-I, while pDCs are specialized in the production 5 of 9
of IFN-I in response to pathogens. Thus, the control of VeroE6 infection observed in VeroE6-pDC
coculturesoncould
Ranks followed by pairwise comparisons (Tukey test) were performed. Differences are significant
result from the production of IFN-I by pDCs.
for p < 0.05. When significant, P values of the ANOVA are indicated on the graph. Significant pairwise
comparisons are indicated by a star (*).
3.2. The IFN-I Response of MOPV-Infected pDCs Lasts Longer Than That Induced by LASV
3.2. Theare
pDCs IFN-I Response
highly of MOPV-Infected
potent pDCsand
IFN-I producers Lastsare
Longer Than That
involved Induced
in the hostby LASV to arenaviruses.
response
Accordingly,pDCs are highly potent IFN-I producers and are involved in the host response toWe
we quantified IFN-I production by MOPV- and LASV-infected pDCs. first evaluated
arenaviruses.
the time course ofwe
Accordingly, thequantified
IFN-I response to MOPV (Figure
IFN-I production by MOPV- 2a). and
TheLASV-infected
IFNα1, IFNα2, and We
pDCs. IFNβ genes
first
were evaluated
up-regulated in course
the time MOPV-infected
of the IFN-I pDCs astoearly
response MOPV as(Figure
6 hpi.2a).TheThe IFN-I
IFNα1, response
IFNα2, andpeaked
IFNβ at
12 hpigenes
and were
thenup-regulated in MOPV-infected
slowly decreased. pDCs as
We then chose anearly as timepoint
early 6 hpi. The IFN-I response
(7 hpi) and apeaked at 12
later timepoint
hpi and then slowly decreased. We then chose an early timepoint (7
(16 hpi) to compare the pDC response to MOPV and LASV. The IFNα1, IFNα2 and IFNβ mRNAshpi) and a later timepoint (16
hpi) to compare the pDC response to MOPV and LASV. The IFNα1, IFNα2
were up-regulated in both MOPV- and LASV-infected pDCs relative to uninfected pDCs at 7 hpi and IFNβ mRNAs were
up-regulated in both MOPV- and LASV-infected pDCs relative to uninfected pDCs at 7 hpi (Figure
(Figure 2b–d). However, only MOPV-infected pDCs showed an over-expression of IFN-I mRNA at
2b–d). However, only MOPV-infected pDCs showed an over-expression of IFN-I mRNA at 16 hpi.
16 hpi. pDCs were thus able to produce an IFN-I in response to both MOPV and LASV, but their
pDCs were thus able to produce an IFN-I in response to both MOPV and LASV, but their response
response to MOPV
to MOPV was long-lasting.
was long-lasting.
2. IFN-I
FigureFigure production
2. IFN-I productionin in
LASV-infected
LASV-infectedpDCs pDCs isis less long-lastingthan
less long-lasting than that
that of MOPV-infected
of MOPV-infected
pDCs.pDCs. (a) pDCs
(a) pDCs were
were infectedwith
infected with MOPV
MOPV (MOI(MOI= = 2).2).
Every 6 h, 6
Every from 0 to 240 hpi,
h, from IFN-I
to 24 hpi,mRNA
IFN-Iwas
mRNA
quantified by
was quantified byRT-qPCR.
RT-qPCR. Data areare
Data presented as theas
presented fold
thechange in the mRNA/GAPDH
fold change in the mRNA/GAPDH ratio in MOPV-
ratio in
infected pDCs
MOPV-infected relative
pDCs to uninfected
relative pDCs. pDCs.
to uninfected (b–d) pDCs(b–d) were
pDCscultured
were for 7 h or 16
cultured forh7inh culture
or 16 h in
medium (mock), R848 (1 µg/mL), MOPV, or LASV (MOI = 2). IFNα1 (b), IFNα2 (c) and IFNβ (d)
culture medium (mock), R848 (1 µg/mL), MOPV, or LASV (MOI = 2). IFNα1 (b), IFNα2 (c) and
mRNAs were quantified by RT-qPCR. Data shown are the means and SEM of three (a), four (b–d – 7
IFNβ (d) mRNAs were quantified by RT-qPCR. Data shown are the means and SEM of three (a),
hpi), or seven (b–d – 16 hpi) independent experiments. ANOVA on Ranks followed by pairwise
four (b–d – 7 hpi), or seven (b–d – 16 hpi) independent experiments. ANOVA on Ranks followed by
comparisons (Tukey test) were performed. Differences are significant for p < 0.05. Significant pairwise
pairwise comparisons
comparisons (Tukey test)
are indicated were
by a star (*).performed. Differences are significant for p < 0.05. Significant
pairwise comparisons are indicated by a star (*).
3.3. The Global Activation State of pDCs Is Lower during LASV Than MOPV InfectionViruses 2019, 11, 287 6 of 9
3.3. The Global Activation State of pDCs Is Lower during LASV Than MOPV Infection
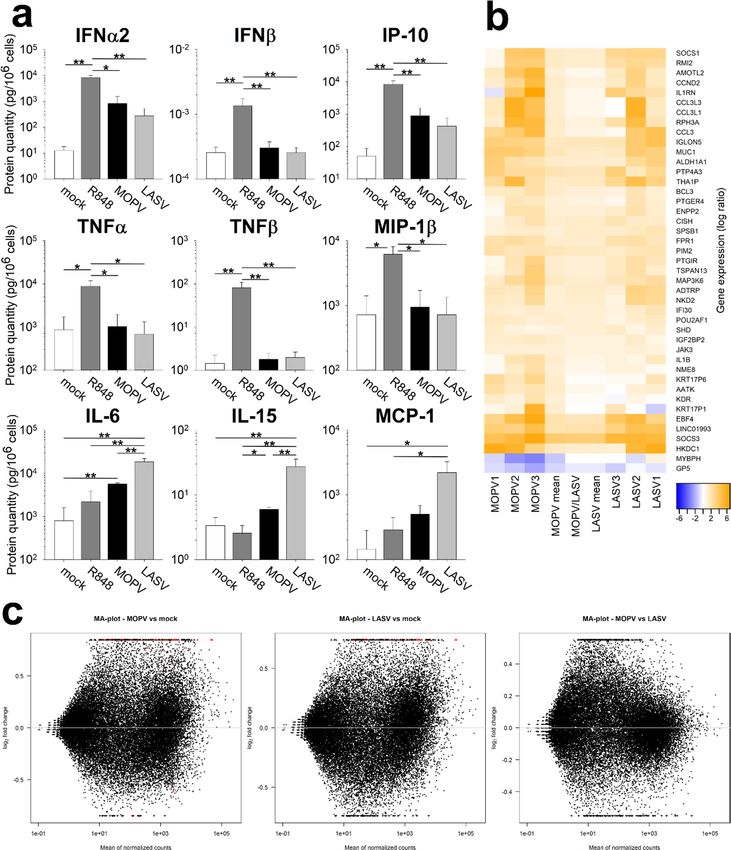
We further evaluated the pDC response to MOPV and LASV by quantifying the cytokines
Viruses 2019, 11, x FOR PEER REVIEW 6 of 9
and
chemokines in the culture supernatant of pDCs, 16 hpi (Figure 3a, Figure S2). IFNα2 was produced
by MOPV- and WeLASV-infected
further evaluated the pDC response
pDCs, to MOPV and
but in slightly LASV
lower by quantifying
amounts the cytokines
by cells infectedandwith LASV.
chemokines in the culture supernatant of pDCs, 16 hpi (Figure 3a, Figure S2). IFNα2 was produced
In contrast, IFNβ protein was not detected, neither for MOPV or LASV. This discrepancy with the
by MOPV- and LASV-infected pDCs, but in slightly lower amounts by cells infected with LASV. In
results obtained
contrast,by RT-qPCR
IFNβ protein (Figure
was not 2) may originate
detected, neither forfrom
MOPV the
orpost-transcriptional
LASV. This discrepancyregulation
with the of IFNβ
mRNAs orresults
the uptake
obtainedand recycling
by RT-qPCR of IFNβ.
(Figure 2) may We also observed
originate IP-10 productionregulation
from the post-transcriptional in both of
MOPV and
IFNβ mRNAs
LASV cultures. or the uptake
In contrast, and recycling
we only detected of IFNβ.
TNFα, WeTNFβ,
also observed IP-10 production
and MIP-1β in both by
production MOPV
R848-treated
and LASV cultures. In contrast, we only detected TNFα, TNFβ, and MIP-1β production by R848-
pDCs. More surprisingly, IL-6, IL-15, and MCP-1 were produced in higher amounts by LASV-infected
treated pDCs. More surprisingly, IL-6, IL-15, and MCP-1 were produced in higher amounts by LASV-
than MOPV-infected pDCs.
infected than MOPV-infected pDCs.
MOPV-
Figure 3. Figure and LASV-infected
3. MOPV- and LASV-infected pDCs
pDCsshow different
show different patterns
patterns of activation.
of activation. (a) pDCs(a) pDCs were
were
cultured forcultured
16 hforwith
16 h with culturemedium
culture medium (mock),
(mock),R848R848
(1 µg/mL), MOPV, or LASV
(1 µg/mL), MOPV, (MOIor= 2).
LASVProtein(MOI = 2).
levels were quantified using the Luminex assay. Data are presented as the means and SEM of five
Protein levels were quantified using the Luminex assay. Data are presented as the means and SEM
independent experiments. Wilcoxon tests were performed, and differences are significant for p < 0.05
of five independent experiments. Wilcoxon tests were performed, and differences are significant for
(*) or p < 0.01 (**). (b,c) pDCs were cultured for 12 h in culture medium (mock), MOPV, or LASV (MOI
p < 0.05 (*)=or
1).pCellular
< 0.01 mRNA
(**). (b,c)
frompDCs
three were cultured
independent for 12 h was
experiments in culture medium
quantified (mock),
by poly-A MOPV, or LASV
amplification
(MOI = 1).and next-generation
Cellular mRNA sequencing.
from three(b) Data show theexperiments
independent differential expression of genes inby
was quantified MOPV
poly-Arelative
amplification
and next-generation sequencing. (b) Data show the differential expression of genes in MOPV relative
to LASV (MOPV/LASV) infected cells or in MOPV or LASV infected cells relative to mock (1, 2, 3,
and mean). Genes shown in this figure displayed significant differences of expression (adjusted p < 0.05).
(c) MA plots for all pairwise comparison of data sets (MOPV/mock, LASV/mock and MOPV/LASV).
Red dots indicate significantly different genes between the two conditions. Triangles correspond to
features having a too low/high fold change to be displayed on the plot.Viruses 2019, 11, 287 7 of 9
We next conducted an unbiased evaluation of pDC activation by transcriptomic analysis
(Figure S3). Genes regulated during MOPV or LASV infection are presented in Figure 3b,c.
Globally, genes up (or down) regulated during MOPV infection were also up (or down) regulated
during LASV infection. However, the fold-changes in gene expression were higher for MOPV-infected
pDCs than LASV-infected pDCs. This result underlines the higher immunogenicity of MOPV
than LASV.
Many genes identified using this technique are linked to the immune response. The most highly
represented families were the JAK/STAT pathway (SOCS1, SOCS3, ASB2, CISH1, JAK3, SPSB1,
and BCL3), IL1β signalling (ILB, IL1R1, IL1R, MEFV) and CCL3 (CCL3, CCL3L1, and CCL3L3).
Many identified genes in the JAK/STAT pathway are ISGs involved in the negative feedback loop of
the pathway [14]. These genes were more highly expressed in MOPV-infected than LASV-infected
pDCs and could be the consequence of the prior activation of the JAK/STAT pathway. Genes from
the IL1β and CCL3 pathways were overexpressed in MOPV-infected pDCs, but not in LASV-infected
pDCs, suggesting that MOPV-induced activation of pDC was not limited to IFN-I production.
Overall, these results highlight the better response of pDCs to MOPV than LASV.
4. Discussion
We first showed that neither MOPV nor LASV infection of pDCs was productive.
However, dendritic cells (DCs) express large amounts of α-dystroglycan, which is the MOPV and
LASV receptor. DCs also express the alternative LASV receptors ALIX, TIM-1 and DC-SIGN.
Finally, LCMV pseudo-particles with LASV glycoprotein have shown a great affinity for pDCs [9].
Consequently, MOPV and LASV viral particles should be able to enter pDCs, although we do not know
which receptors are expressed by human pDC. The viral cycle may have been initiated and aborted.
We did not detect the production of MOPV and LASV RNAs in pDCs either. Therefore, if the viral cycle
is initiated, it is aborted before the viral replication and transcription steps. As pDCs are highly efficient
in pathogen detection, it is also possible that viral components were produced but quickly recycled,
preventing their detection with our techniques. Studies on the infection of pDC-like cell lines by
LCMV have shown no permissivity to viral particles. However, LCMV infection was possible through
cellular contact with infected cells [15]. With our model, we were able to detect MOPV and LASV Z
proteins inside pDCs cultured with infected VeroE6 cells. These Z proteins could have three origins:
neosynthesis, internalized virions or other type of viral components released by infected VeroE6 such
as exosomes. Thus, coculture with infected cells either increased pDC permissivity to MOPV and
LASV infection or increased the internalisation of viral component by pDCs. Further investigations
using transwell experiments could allow to determine whether direct cell-cell contacts are needed for
viral transmission to pDC. Depending on its origin, the Z protein could induce or elude different kinds
of recognition pathways, which could affect pDC activation. We also showed that coculture with pDCs
lowered the MOPV and LASV infection of VeroE6 cells. Production of IFN-I by pDCs could explain the
control of VeroE6 infection, suggesting that pDCs respond to both MOPV- and LASV-infected VeroE6.
As pDCs are specialized in IFN-I production, we quantified their IFN-I response to MOPV and
LASV. pDCs produced IFN-I in response to MOPV and LASV virions. However, pDC response
to MOPV seemed to be more stable over time. This difference may rely on stronger activation
by MOPV, allowing a longer response. It could also be explained by the expression of LASV
proteins, which have immunosuppressive properties and may shut down the pDC response [12].
Specifically, LASV NP has been shown to have major immunosuppressive properties in myeloid
dendritic cells [11]. However, we did not have the opportunity to evaluate the expression of NP in
VeroE6-pDC cocultures. pDCs express a wide range of cellular sensors that can detect viral components.
It may be informative to identify which pathways are responsible for MOPV and LASV sensing.
Some LCMV strains, which are not detected by TLR7, do not induce IFN-I production by pDCs,
suggesting that the pDC response to LCMV is TLR7 dependent [7]. However, in vitro, RIG-I is alsoViruses 2019, 11, 287 8 of 9
able to detect LASV and induces IFN-I production [16]. MOPV and LASV may be detected by different
sensors, influencing the pDC response.
To improve our understanding of pDC activation during MOPV and LASV infection,
we quantified the cytokines produced by pDCs. IFN-I production by MOPV- and LASV-infected
pDCs was confirmed. However, the absence of TNFα, TNFβ, and MIP-1β production suggests that
MOPV- and LASV-infection did not lead to the complete activation of pDCs, in contrast to that induced
by the TLR7 and TLR8 ligand R848. Unexpectedly, we showed that IL-6, IL-15, and MCP-1 were
produced in higher amounts by LASV-infected than MOPV-infected pDCs. These three cytokines
were previously identified in humans or NHPs with VHF. IL-6 was associated with severe cases of
LASV and Ebola virus infection [6,17]. IL-15 and MCP-1 were also associated with a bad prognosis
during the Crimean–Congo haemorrhagic fever [18]. In pDCs, pro-inflammatory cytokines appear
to be induced through IRF5 and NFκB activation [19]. pDCs could be involved in the initiation
of the pro-inflammatory context associated with severe LF, as the pDC response occurs very early.
Transcriptomic analysis of MOPV- and LASV-infected pDCs suggested a comparable pattern of
activation of pDCs between both viruses. However, MOPV infection had a greater impact on the pDC
transcriptomic state compared to LASV infection. Therefore, MOPV seems to be a stronger stimulus
than LASV for pDC activation.
Our results show that primary human pDCs are not productively infected by either MOPV
or LASV. However, in the presence of infected cells, viral proteins could be detected in pDCs.
MOPV-infected pDCs were globally activated, and rapidly and durably produced IFN-I. In contrast,
LASV-infected pDCs were less activated, showed shorter IFN-I production, and produced
pro-inflammatory cytokines. Further investigation will be necessary to identify the cell sensors
involved in the response to LASV and MOPV and determine whether viral proteins are responsible for
these different responses. The role of pDC in vivo could be critical, as IFN-I has been correlated with
survival to LF. IFN-I produced by pDCs would have direct antiviral effects as well as induce better
activation of other immune cells. Therefore, the strength of pDC activation during the very first steps
of infection could modulate the global immune response to LASV.
Supplementary Materials: The following are available online at http://www.mdpi.com/1999-4915/11/3/287/s1,
Figure S1: Gating strategies for pDC-VeroE6 cocultures, Figure S2: Factors tested during the Luminex assay in
MOPV- and LASV-infected pDCs, FS3: Quality controls (a: density distribution, b: PCA; c: normalization; d:
regulated genes count) of transcriptomic analysis.
Author Contributions: Investigation, resources, and data curation, J.S., X.C. and S.R.; formal analysis, J.S., N.P.,
M.-A.D.; conceptualization, visualization, writing—original draft preparation, writing—review and editing, J.S.
and S.B.; supervision and funding acquisition, S.B.
Funding: This work was supported by the Fondation pour la Recherche Médicale (FRM, France), and a PhD
scholarship from the Ecole Normale Supérieure de Paris (ENS, Paris, France). The funders had no role in study
design, data collection and analysis, decision to publish, or preparation of the manuscript.
Acknowledgments: We are grateful to members of the Laboratoire INSERM-Jean Merieux BSL4. We thank
Viroscan3D for RNA sequencing. We thank C. Clegg and G. Lloyd (Public Health England, Porton Down, Salisbury,
United Kingdom) for providing us with MOPV, S. Becker for the AV strain of LASV, and the Etablissement Français
du Sang for providing healthy human blood. We thank T. G. Ksiazek, P. E. Rollin, and P. Jahrling for LASV MAbs.
We thank M. Bouloy and R. Flick for the tools used to develop the LASV and MOPV reverse genetics systems.
Conflicts of Interest: The authors declare no conflict of interest.
References
1. WHO. WHO Publishes List of Top Emerging Diseases Likely to Cause Major Epidemics.
Available online: http://www.who.int/medicines/ebola-treatment/WHO-list-of-top-emerging-diseases/en/
(accessed on 15 November 2018).
2. Ogbu, O.; Ajuluchukwu, E.; Uneke, C.J. Lassa fever in West African sub-region: An overview. J. Vector
Borne Dis. 2007, 44, 1–11. [PubMed]Viruses 2019, 11, 287 9 of 9
3. McCormick, J.B.; King, I.J.; Webb, P.A.; Scribner, C.L.; Craven, R.B.; Johnson, K.M.; Elliott, L.H.;
Belmont-Williams, R. Lassa Fever. N. Engl. J. Med. 1986, 314, 20–26. [CrossRef] [PubMed]
4. Wulff, H.; McIntosh, B.M.; Hamner, D.B.; Johnson, K.M. Isolation of an arenavirus closely related to Lassa
virus from Mastomys natalensis in south-east Africa. Bull. World Health Organ. 1977, 55, 441–444. [PubMed]
5. Bowen, M.D.; Peters, C.J.; Nichol, S.T. Phylogenetic Analysis of the Arenaviridae: Patterns of Virus Evolution and
Evidence for Cospeciation between Arenaviruses and Their Rodent Hosts. Mol. Phylogenet. Evol. 1997, 8, 301–316.
[CrossRef] [PubMed]
6. Baize, S.; Marianneau, P.; Loth, P.; Reynard, S.; Journeaux, A.; Chevallier, M.; Tordo, N.; Deubel, V.;
Contamin, H. Early and strong immune responses are associated with control of viral replication and
recovery in lassa virus-infected cynomolgus monkeys. J. Virol. 2009, 83, 5890–5903. [CrossRef] [PubMed]
7. Barchet, W.; Cella, M.; Colonna, M. Plasmacytoid dendritic cells—Virus experts of innate immunity.
Semin. Immunol. 2005, 17, 253–261. [CrossRef] [PubMed]
8. Jung, A.; Kato, H.; Kumagai, Y.; Kumar, H.; Kawai, T.; Takeuchi, O.; Akira, S. Lymphocytoid choriomeningitis
virus activates plasmacytoid dendritic cells and induces a cytotoxic T-cell response via MyD88. J. Virol.
2008, 82, 196–206. [CrossRef] [PubMed]
9. Macal, M.; Lewis, G.M.; Kunz, S.; Flavell, R.; Harker, J.A.; Zúñiga, E.I. Plasmacytoid Dendritic Cells Are
Productively Infected and Activated through TLR-7 Early after Arenavirus Infection. Cell Host Microbe
2012, 11, 617–630. [CrossRef] [PubMed]
10. Günther, S.; Emmerich, P.; Laue, T.; Kühle, O.; Asper, M.; Jung, A.; Grewing, T.; ter Meulen, J.; Schmitz, H.
Imported lassa fever in Germany: Molecular characterization of a new lassa virus strain. Emerg. Infect. Dis.
2000, 6, 466–476. [CrossRef] [PubMed]
11. Schaeffer, J.; Carnec, X.; Reynard, S.; Mateo, M.; Picard, C.; Pietrosemoli, N.; Dilliès, M.-A.; Baize, S. Lassa virus activates
myeloid dendritic cells but suppresses their ability to stimulate T cells. PLOS Pathog. 2018, 14, e1007430. [CrossRef]
[PubMed]
12. Carnec, X.; Baize, S.; Reynard, S.; Diancourt, L.; Caro, V.; Tordo, N.; Bouloy, M. Lassa virus nucleoprotein
mutants generated by reverse genetics induce a robust type I interferon response in human dendritic cells
and macrophages. J. Virol. 2011, 85, 12093–12097. [CrossRef] [PubMed]
13. Varet, H.; Brillet-Guéguen, L.; Coppée, J.-Y.; Dillies, M.-A. SARTools: A DESeq2- and EdgeR-Based R Pipeline
for Comprehensive Differential Analysis of RNA-Seq Data. PLoS ONE 2016, 11, e0157022. [CrossRef]
[PubMed]
14. Raftery, N.; Stevenson, N.J. Advances in anti-viral immune defence: Revealing the importance of the IFN
JAK/STAT pathway. Cell. Mol. Life Sci. 2017, 74, 2525–2535. [CrossRef] [PubMed]
15. Iwasaki, M.; Sharma, S.M.; Marro, B.S.; de la Torre, J.C. Resistance of human plasmacytoid dendritic CAL-1
cells to infection with lymphocytic choriomeningitis virus (LCMV) is caused by restricted virus cell entry,
which is overcome by contact of CAL-1 cells with LCMV-infected cells. Virology 2017, 511, 106–113. [CrossRef]
[PubMed]
16. Reynard, S.; Russier, M.; Fizet, A.; Carnec, X.; Baize, S. Exonuclease domain of the Lassa virus nucleoprotein
is critical to avoid RIG-I signaling and to inhibit the innate immune response. J. Virol. 2014, 88, 13923–13927.
[CrossRef] [PubMed]
17. Vernet, M.-A.; Reynard, S.; Fizet, A.; Schaeffer, J.; Pannetier, D.; Guedj, J.; Rives, M.; Georges, N.;
Garcia-Bonnet, N.; Sylla, A.I.; et al. Clinical, virological, and biological parameters associated with outcomes
of Ebola virus infection in Macenta, Guinea. JCI Insight 2017, 2, e88864. [CrossRef] [PubMed]
18. Papa, A.; Tsergouli, K.; Çağlayık, D.Y.; Bino, S.; Como, N.; Uyar, Y.; Korukluoglu, G. Cytokines as biomarkers
of Crimean-Congo hemorrhagic fever. J. Med. Virol. 2016, 88, 21–27. [CrossRef] [PubMed]
19. Steinhagen, F.; McFarland, A.P.; Rodriguez, L.G.; Tewary, P.; Jarret, A.; Savan, R.; Klinman, D.M. IRF-5 and
NF-κB p50 co-regulate IFN-β and IL-6 expression in TLR9-stimulated human plasmacytoid dendritic cells.
Eur. J. Immunol. 2013, 43, 1896–1906. [CrossRef] [PubMed]
© 2019 by the authors. Licensee MDPI, Basel, Switzerland. This article is an open access
article distributed under the terms and conditions of the Creative Commons Attribution
(CC BY) license (http://creativecommons.org/licenses/by/4.0/).You can also read


