North American Aluminum Cans - Life Cycle Assessment of On behalf of The Aluminum Association - The Aluminum ...
←
→
Page content transcription
If your browser does not render page correctly, please read the page content below
Life Cycle Assessment of
North American Aluminum Cans

                  On behalf of The Aluminum Association

                                               1 of 65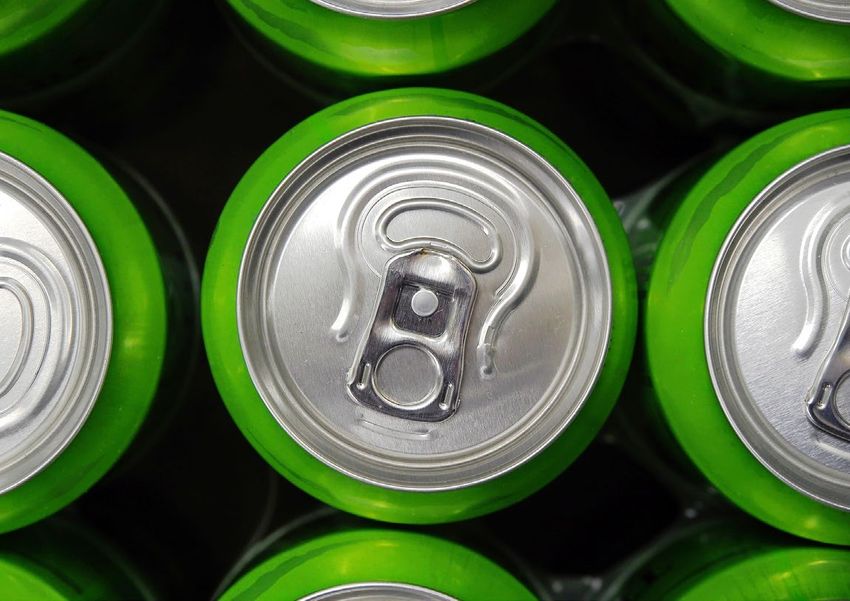
Client:                                     The Aluminum Association

Title:                                      Life Cycle Assessment of North American Aluminum Cans

Report version:                             v1.0

Report date:                                May 19, 2021

©2021 Sphera. All rights reserved

On behalf of Sphera Solutions, Inc. and its subsidiaries

Document prepared by

Manuela Toro

                                             05/19/2021

Vicki Rybl

Quality assurance by

Christoph Koffler                                                                        ckoffler@sphera.com

Technical Director Americas                  05/19/2021                                  Phone+1 617 247 4477

Under the supervision of

Maggie Wildnauer

Consulting Director Americas

This report has been prepared by Sphera Solutions, Inc. (“Sphera”) with reasonable skill and diligence within the terms and
conditions of the contract between Sphera and the client. Sphera is not accountable to the client, or any others, with respect
to any matters outside the scope agreed upon for this project.

Sphera disclaims all responsibility of any nature to any third parties to whom this report, or any part thereof, is made known.
Any such party relies on the report at its own risk. Interpretations, analyses, or statements of any kind made by a third party
and based on this report are beyond Sphera’s responsibility.

If you have any suggestions, complaints, or any other feedback, please contact us at servicequality@sphera.com.

                                                                                                                      2 of 65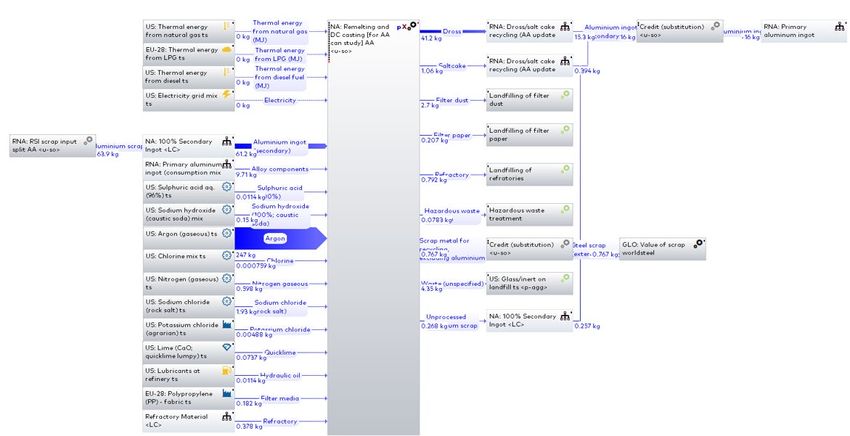
Table of Contents

Table of Contents......................................................................................................................................................... 3
List of Figures............................................................................................................................................................... 6
List of Tables ................................................................................................................................................................ 7
List of Acronyms ........................................................................................................................................................... 8
Glossary ........................................................................................................................................................................ 9
Executive Summary ................................................................................................................................................... 11
Introduction ................................................................................................................................................................ 16
1.      Goal of the Study............................................................................................................................................... 18
2.      Scope of the Study ............................................................................................................................................ 19
     2.1.       Product System(s) .................................................................................................................................... 19

     2.2.       Product Function(s), Functional Unit, and Reference Flow.................................................................... 19

     2.3.       System Boundaries .................................................................................................................................. 20

        2.3.1.           Time Coverage ................................................................................................................................. 20
        2.3.2.           Technology Coverage ...................................................................................................................... 20
        2.3.3.           Geographical Coverage ................................................................................................................... 20
     2.4.       Allocation .................................................................................................................................................. 21

        2.4.1.           Multi-output Allocation .................................................................................................................... 21
        2.4.2.           End-of-Life Allocation ....................................................................................................................... 21
     2.5.       Cut-off Criteria .......................................................................................................................................... 23

     2.6.       Selection of LCIA Methodology and Impact Categories ......................................................................... 23

     2.7.       Interpretation to be Used ......................................................................................................................... 26

     2.8.       Data Quality Requirements ..................................................................................................................... 26

     2.9.       Type and Format of the Report................................................................................................................ 26

     2.10.      Software and Database ........................................................................................................................... 27

     2.11.      Critical Review .......................................................................................................................................... 27

3.      Life Cycle Inventory Analysis ............................................................................................................................ 28
     3.1.       Data Collection Procedure ....................................................................................................................... 28

     3.2.       Aluminum Can Production ....................................................................................................................... 28

        3.2.1.           Overview of Product System ........................................................................................................... 28

                                                                                                                                                                       3 of 65
3.2.2.          Remelting, Casting and Sheet Rolling ............................................................................................ 30
       3.2.3.          Can Manufacturing .......................................................................................................................... 37
       3.2.4.          End-of-life ......................................................................................................................................... 39
     3.3.      Background Data ..................................................................................................................................... 40

       3.3.1.          Fuels and Energy ............................................................................................................................. 40
       3.3.2.          Transportation ................................................................................................................................. 41
       3.3.3.          Raw Materials and Processes ........................................................................................................ 41
     3.4.      Life Cycle Inventory .................................................................................................................................. 43

4.     LCIA Results ...................................................................................................................................................... 45
     4.1.      Overall Results ......................................................................................................................................... 45

       4.1.1.          Cradle-to-Gate .................................................................................................................................. 45
       4.1.2.          Cradle-to-Grave ................................................................................................................................ 46
       4.1.3.          Results for Various Conversions ..................................................................................................... 48
     4.2.      Sensitivity Analysis ................................................................................................................................... 49

       4.2.1.          Cradle-to-Gate Primary Aluminum Content .................................................................................... 49
       4.2.2.          Cradle-to-Grave End-of-Life Recycling ............................................................................................ 50
     4.3.      Scenario Analysis ..................................................................................................................................... 51

       4.3.1.          Cradle-to-Gate Primary Aluminum Sourcing................................................................................... 51
       4.3.2.          Cradle-to-Grave Best- and Worst-Case Scenarios ......................................................................... 53
5.     Interpretation .................................................................................................................................................... 55
     5.1.      Identification of Relevant Findings.......................................................................................................... 55

     5.2.      Assumptions ............................................................................................................................................. 55

     5.3.      Results of Sensitivity and Scenario Analysis .......................................................................................... 56

       5.3.1.          Sensitivity Analysis .......................................................................................................................... 56
       5.3.2.          Scenario Analysis............................................................................................................................. 56
     5.4.      Data Quality and Assessment ................................................................................................................. 56

       5.4.1.          Precision and Completeness .......................................................................................................... 57
       5.4.2.          Consistency and Reproducibility..................................................................................................... 57
       5.4.3.          Representativeness......................................................................................................................... 57
     5.5.      Model Completeness and Consistency ................................................................................................... 57

       5.5.1.          Completeness .................................................................................................................................. 57
       5.5.2.          Consistency ...................................................................................................................................... 57
     5.6.      Conclusions, Limitations, and Recommendations ................................................................................. 58

       5.6.1.          Conclusions...................................................................................................................................... 58

                                                                                                                                                                   4 of 65
5.6.2.          Limitations ....................................................................................................................................... 59
        5.6.3.          Recommendations .......................................................................................................................... 59
References ................................................................................................................................................................. 60
Annex A.            Critical Review Statement ................................................................................................................... 62
Annex B.            Detailed Results ................................................................................................................................... 64
    Annex B1: Water Consumption Results, Including Turbined Water ................................................................... 64

    Annex B2: Sensitivity Analysis Results ................................................................................................................. 64

    Annex B3: Scenario Analysis Results ................................................................................................................... 64

                                                                                                                                                                   5 of 65
List of Figures

Figure ES-1: Effect of EoL recycling rate on cradle-to-grave GWP .......................................................................... 12
Figure ES-2: Selected LCI/LCIA results per 1,000 cans (cradle-to-gate)................................................................ 12
Figure ES-3: Selected LCI/LCIA results per 1,000 cans (cradle-to-grave) .............................................................. 13
Figure ES-4: Effect of primary aluminum sourcing on cradle-to-gate GWP assuming the same primary aluminum
content of 27 percent but changing its region of origin .......................................................................................... 13
Figure ES-5: Cradle-to-grave reduction in carbon footprint of beverage cans in North America. Note: The sizes of
cans are slightly different between studies. ............................................................................................................ 14
Figure ES-6: Cradle-to-grave reduction in primary energy demand of aluminum beverage cans in North America.
Note: The sizes of cans are slightly different between studies. .............................................................................. 15
Figure 2-1: Aluminum beverage cans ....................................................................................................................... 19
Figure 2-2: Schematic representations of the end-of-life allocation approaches .................................................. 22
Figure 3-1: Cradle-to-grave life cycle inventory model of North American aluminum cans .................................. 30
Figure 3-2: Gate-to-gate remelting and direct chill casting model.......................................................................... 32
Figure 3-3: Gate-to-gate sheet rolling model ........................................................................................................... 35
Figure 3-4: Gate-to-gate can manufacturing model ................................................................................................ 38
Figure 4-1: Relative contributions for LCI and LCIA indicator results per 1,000 cans (cradle-to-gate) ................ 46
Figure 4-2: Relative contributions for LCI and LCIA indicator results per 1,000 cans (cradle-to-grave) .............. 47
Figure 4-3: Global Warming Potential contributions per 1,000 AI cans (13.46 kg, net scrap w/ embodied burden
debit) .......................................................................................................................................................................... 48
Figure 4-4: Effect of primary aluminum content on Primary Energy Demand ....................................................... 50
Figure 4-5: Effect of primary aluminum content on Global Warming Potential ..................................................... 50
Figure 4-6: Effect of EoL recycling rate on Primary Energy Demand ...................................................................... 51
Figure 4-7: Effect of EoL recycling rate on Global Warming Potential .................................................................... 51
Figure 4-8: Effect of primary aluminum sourcing on cradle-to-gate Primary Energy Demand .............................. 52
Figure 4-9: Effect of primary aluminum sourcing on cradle-to-gate Global Warming Potential ............................ 53
Figure 4-10: Effect of best- and worst-case on cradle-to-grave Primary Energy Demand ..................................... 53
Figure 4-11: Effect of best- and worst-case on cradle-to-grave Global Warming Potential ................................... 54

                                                                                                                                                                        6 of 65
List of Tables
Table 2-1: System boundaries .................................................................................................................................. 20
Table 2-2: LCIA impact category descriptions .......................................................................................................... 25
Table 2-3: Other environmental indicators .............................................................................................................. 25
Table 3-1: Remelting and direct chill casting unit process ..................................................................................... 33
Table 3-2: Sheet rolling unit process ........................................................................................................................ 36
Table 3-3: Can manufacturing unit process ............................................................................................................. 39
Table 3-4: Key fuel and energy datasets used in inventory analysis...................................................................... 40
Table 3-5: Key transportation datasets used in inventory analysis ........................................................................ 41
Table 3-6: Key material and process datasets used in inventory analysis ............................................................ 41
Table 3-7: Selected life cycle inventory results per 1,000 cans ............................................................................. 44
Table 4-1: LCI and LCIA indicator results per 1,000 cans (cradle-to-gate) ............................................................ 45
Table 4-2: LCI and LCIA indicator results per 1,000 cans (cradle-to-grave) .......................................................... 46
Table 4-3. Cradle-to-gate results for various conversions ....................................................................................... 48
Table 4-4. Cradle-to-grave results for various conversions ..................................................................................... 49
Table 4-5. 2015 electricity consumption for regional aluminum production ........................................................ 52
Table B-1: Water consumption results, including turbined water, per 1,000 cans under cut-off approach (cradle-
to-gate) ....................................................................................................................................................................... 64
Table B-2: Water consumption results, including turbined water, per 1,000 cans under closed loop approach
(cradle-to-grave) ......................................................................................................................................................... 64
Table B-3: Effect of primary aluminum content on PED and GWP (cradle-to-gate) ............................................... 64
Table B-4: Effect of EoL recycling rate on PED and GWP (cradle-to-grave) ............................................................ 64
Table B-5: Effect of primary aluminum sourcing on PED and GWP (cradle-to-gate) .............................................. 64
Table B-6: Effect of best- and worst-case on PED and GWP (cradle-to-grave) ....................................................... 65
7 of 65List of Acronyms
AA Aluminum Association
ADP Abiotic Depletion Potential
AP Acidification Potential
CA Canada
CN China
EoL End-of-Life
EP Eutrophication Potential
GaBi Ganzheitliche Bilanzierung (German for holistic balancing)
GHG Greenhouse Gas
GWP Global Warming Potential
IPCC Intergovernmental Panel on Climate Change
ISO International Organization for Standardization
LCA Life Cycle Assessment
LCI Life Cycle Inventory
LCIA Life Cycle Impact Assessment
NCV Net Calorific Value (a.k.a. Lower Heating Value, LHV)
NMVOC Non-Methane Volatile Organic Compound
ODP Ozone Depletion Potential
PED Primary Energy Demand
RME Regional Middle East
RNA Regional North America
SETAC Society of Environmental Toxicology And Chemistry
SFP Smog Formation Potential
TRACI Tool for the Reduction and Assessment of Chemical and Other Environmental Impacts
UBC Used Beverage Can
VOC Volatile Organic Compound
WHO World Health Organization
8 of 65Glossary
Life Cycle
A view of a product system as “consecutive and interlinked stages … from raw material acquisition or generation
from natural resources to final disposal” (ISO 14040:2006, section 3.1). This includes all material and energy
inputs as well as emissions to air, land and water.
Life Cycle Assessment (LCA)
“Compilation and evaluation of the inputs, outputs and the potential environmental impacts of a product system
throughout its life cycle” (ISO 14040:2006, section 3.2)
Life Cycle Inventory (LCI)
“Phase of life cycle assessment involving the compilation and quantification of inputs and outputs for a product
throughout its life cycle” (ISO 14040:2006, section 3.3)
Life Cycle Impact Assessment (LCIA)
“Phase of life cycle assessment aimed at understanding and evaluating the magnitude and significance of the
potential environmental impacts for a product system throughout the life cycle of the product” (ISO 14040:2006,
section 3.4)
Life Cycle Interpretation
“Phase of life cycle assessment in which the findings of either the inventory analysis or the impact assessment,
or both, are evaluated in relation to the defined goal and scope in order to reach conclusions and recommenda-
tions” (ISO 14040:2006, section 3.5)
Functional Unit
“Quantified performance of a product system for use as a reference unit” (ISO 14040:2006, section 3.20)
Allocation
“Partitioning the input or output flows of a process or a product system between the product system under study
and one or more other product systems” (ISO 14040:2006, section 3.17)
Closed-loop and Open-loop Allocation of Recycled Material
“An open-loop allocation procedure applies to open-loop product systems where the material is recycled into
other product systems and the material undergoes a change to its inherent properties.”
“A closed-loop allocation procedure applies to closed-loop product systems. It also applies to open-loop product
systems where no changes occur in the inherent properties of the recycled material. In such cases, the need for
allocation is avoided since the use of secondary material displaces the use of virgin (primary) materials.”
(ISO 14044:2006, section 4.3.4.3.3)
9 of 65Foreground System
“Those processes of the system that are specific to it … and/or directly affected by decisions analyzed in the
study.” (JRC 2010, p. 97) This typically includes first-tier suppliers, the manufacturer itself and any downstream
life cycle stages where the manufacturer can exert significant influence. As a general rule, specific (primary) data
should be used for the foreground system.
Background System
“Those processes, where due to the averaging effect across the suppliers, a homogenous market with average
(or equivalent, generic data) can be assumed to appropriately represent the respective process … and/or those
processes that are operated as part of the system but that are not under direct control or decisive influence of
the producer of the good….” (JRC 2010, pp. 97-98) As a general rule, secondary data are appropriate for the
background system, particularly where primary data are difficult to collect.
Critical Review
“Process intended to ensure consistency between a life cycle assessment and the principles and requirements
of the International Standards on life cycle assessment” (ISO 14044:2006, section 3.45).
10 of 65Executive Summary
This report documents the average life cycle inventory (LCI) and life cycle impact assessment (LCIA) results of
1,000 aluminum beverage cans manufactured in North America (U.S. and Canada) in the reference year 2016.
The study was commissioned by the Aluminum Association (AA) to update a previous study published in 2014 to
respond to increasing market demand for up-to-date life cycle data on the environmental performance of prod-
ucts. The goal of this study is to provide current life cycle inventory data for beverage cans to help the aluminum
industry and its stakeholders, life cycle assessment practitioners, academic researchers and other interested
parties better understand the potential environmental impacts of aluminum cans and their improvement over
time.
A life cycle inventory of a product quantifies all material and energy use and environmental exchanges (re-
sources, emissions) over its entire life cycle from raw material acquisition through to recycling and/or disposal.
The functional unit of the study is 1,000 unfilled aluminum cans with a weighted average size of 13.6 oz. bever-
age volume per can. This average represents a basket of small, medium, and large sized cans, represented by
their relative market shares. The scope of the study is “cradle-to-grave”, i.e., starting with the extraction of bauxite
ore and ending with the recycling and recovery of used beverage cans (UBCs). Beverage filling, distribution, re-
frigeration, and consumption are excluded from this study.
In addition, “cradle-to-gate” results are provided for users who prefer to assess the environmental footprint of
the cans from a different perspective or using an alternative allocation approach. “Cradle-to-gate” refers to the
stages of the life cycle starting with raw material extraction and ending with a finished can at the manufacturing
facility.
Both approaches used primary production data for the reference year 2016 to assess the same baseline sce-
nario:
A total metallic weight of 12.99 kg per 1,000 cans with an average size of 13.6 oz per can;
An end-of-life (EoL) recycling rate of 50.4%;
A recycled metal content of 73% per can including 50% from post-consumer sources and 23% from
pre-consumer sources, but excluding internal scrap from can sheet rolling mills; and
No embedded burden of primary aluminum production assigned to any scrap inputs.
Focusing on two frequently cited assessment parameters – Primary Energy Demand (PED) and Global Warming
Potential (GWP, commonly called carbon footprint) – the study has reached the following conclusions:
The cradle-to-gate PED and GWP for 1,000 cans, from raw material extraction to the point in which an
empty beverage can is made, painted and sealed, are 1,320 MJ LHV and 77.1 kg CO2 equivalents,
respectively.
The cradle-to-grave PED and GWP for 1,000 cans, including end-of-life disposal and recycling, are
1,630 MJ LHV and 96.8 kg CO2 equivalents, respectively.
Notably, the cradle-to-gate footprint is lower than the cradle-to-grave footprint. This is unusual for products that
are fully recycled at the end of their useful life and receive a credit of primary production based on the amount
of the recovered secondary material. In the specific case of aluminum cans made in North America, however,
the EoL recycling rate is lower than the recycled content. Collecting less aluminum scrap in end-of-life recycling
11 of 65than what is consumed during production leads to a net scrap deficit of the product system, which burdens the
product system and increases the PED and GWP of the beverage can over the full life cycle. Bringing back more
aluminum cans through increased consumer recycling is therefore one of the key opportunities to reduce the
cradle-to-grave environmental footprint of aluminum beverage cans in the future (Figure ES-1).
160
Global Warming Potential (kg CO2 eq)
140
120 1.02 kg CO2eq decrease per
1% increase in recycling rate
100
80
Base case
60 recycling rate is
50.4%
40
20
0
0% 20% 40% 60% 80% 100%
Recycling Rate
Figure ES-1: Effect of EoL recycling rate on cradle-to-grave GWP
The study also shows the impact of raw material usage on the environmental footprint of aluminum beverage
cans. The contributions of individual life cycle stages to the total footprint (both cradle-to-gate and cradle-to-
grave) are shown in Figure ES-2 and Figure ES-3. Although the average aluminum can contains only 27% primary
aluminum, that input is responsible for the majority of the can’s total life cycle environmental footprint. As such,
reducing the use of primary aluminum while increasing the use of recycled aluminum can effectively reduce the
cradle-to-gate footprint of the can.
Global warming 77.1
Primary energy, total 1320
Primary energy, fossil 1030
Primary energy, renewable 293
Acidification 0.226
Eutrophication 0.00784
Smog formation 2.63
Particulate matter 0.0233
Water consumption (excl. turbined water) 183
0% 20% 40% 60% 80% 100%
00. Primary ingot 01. Remelting and casting 02. Can sheet rolling 03. Can manufacture
Figure ES-2: Selected LCI/LCIA results per 1,000 cans (cradle-to-gate)
12 of 65Global warming 96.8
Primary energy, total 1630
Primary energy, fossil 1210
Primary energy, renewable 421
Acidification 0.319
Eutrophication 0.00995
Smog formation 3.41
Particulate matter 0.0338
Water consumption (excl. turbined water) 200
-10% 10% 30% 50% 70% 90%
00. Primary ingot 01. Remelting and casting 02. Can sheet rolling
03. Can manufacture 04. UBC EoL processing 05. UBC EoL credit/debit
Figure ES-3: Selected LCI/LCIA results per 1,000 cans (cradle-to-grave)
Raw material sourcing is also critical, as not all primary aluminum is created equal. As seen in Figure ES-4,
changing the source of primary aluminum can have a significant impact on the cradle-to-gate environmental
footprint of the average aluminum can. For instance, primary aluminum sourced from Canada is made almost
exclusively using renewable hydropower while primary aluminum made in China is made largely with coal-gener-
ated power. This difference can have a profound impact – an aluminum can made using the same content (in
the current case 27%) of primary aluminum sourced in China would be almost twice as carbon intensive in pro-
duction than the average North American can made today using a mixture of primary metal sourced from North
America and several other countries. If aluminum can made in China used more primary aluminum and less
recycled metal, the difference would be much wider.
140 130
Global Warming Potential (kg CO2 eq)
120
100 93
77
80
62
60
40
20
0
North America Canada China Middle East
Figure ES-4: Effect of primary aluminum sourcing on cradle-to-gate GWP assuming the same primary aluminum content
of 27 percent but changing its region of origin
13 of 65Finally, it is important to place this study in a historical context to benchmark the progress made by the industry
in reducing the environmental footprint of beverage cans over the years. As seen in Figure ES-5, the cradle-to-
grave carbon footprint of aluminum cans has declined by 43% since 1991. The reduction between 2012 and
2016 is 7%. Reduction in primary energy demand is in a similar range (Figure ES-6). Much of the progress is
attributable to the following:
The metallic weight of an average can has declined by 18% from 15.83 grams to 12.99 grams per can, and
per volume the decline is 27% from 1.32 grams per fluid ounce to 0.96 grams per fluid ounce;
The environmental footprint of primary aluminum production in North America has been significantly re-
duced; and
The manufacturing processes along the entire value chain have become far more efficient.
Unfortunately, one important parameter that could drive even more improvement in the aluminum can’s envi-
ronmental footprint is moving in the wrong direction. The end-of-life recycling rate for aluminum cans has
dropped more than 10 percentage points – from more than 62% in 1991 to around 50% today. This deterioration
offsets a significant amount of positive progress achieved in other areas over the years. The Aluminum Associa-
tion advocates for many policies to increase the quality and quantity of used aluminum beverage cans coming
back into the system. But increasing recycling in a meaningful way will require a wider effort involving hundreds
of millions of individuals and stakeholders.
180
160
140
kg CO2e/1,000 cans
120
-43%
100
80
60
40
20
0
1991 2006 2012 2016
Baseline Production Year
Figure ES-5: Cradle-to-grave reduction in carbon footprint of beverage cans in North America. Note: The sizes of cans are
slightly different between studies.
14 of 653,000
2,500
MJ/1,000 cans
2,000
-41%
1,500
1,000
500
0
1991 2006 2012 2016
Baseline Production Year
Figure ES-6: Cradle-to-grave reduction in primary energy demand of aluminum beverage cans in North America. Note: The
sizes of cans are slightly different between studies.
15 of 65Introduction
Life cycle assessment (LCA) is a quantitative and holistic methodology that assesses the potential environmental
consequences of a product, process or service over its entire life cycle – from the extraction of raw materials
(cradle) until the recycling or disposal of the product at the end-of-life (grave). The goal of LCA is to quantify,
evaluate, and then identify opportunities to reduce the overall environmental impacts of the system under study.
The aluminum industry has been one of the pioneering material industries in adopting LCA to assess its products.
Over the past three decades, a total of three LCAs have been done for aluminum beverage cans. Although these
studies are slightly different in some aspects – including adopted standards, size of individual cans and, in some
cases, scope of the study – they nevertheless enable the industry to track and benchmark its progress over time.
The 1993 Study
The first aluminum can study was completed in 1993. It was a life cycle inventory study of 1,000 cans with a
single size of 12 oz beverage volume per can. It adopted guidelines titled A Technical Framework for Life Cycle
Assessment (1991) developed by the Society of Environmental Toxicology And Chemistry (SETAC). Not only did
the study include can production and recycling, but also beverage filling and distribution. The baseline year of
production was 1991. The cradle-to-grave results of the study were based on a closed-loop substitution ap-
proach. Key parameters of beverage cans were:
Metallic weight of an average can was 15.83 grams;
Recycled content of average can was 80%. However, this was not a result of metal feedstock survey but
a result of the LCA model which assumed closed-loop recycling – all can stamping scrap and recycled
UBC scrap went back to can making. The true recycled content of cans was unknown. Finally;
EoL recycling rate was 62.5%.
The 2010 Study
The second study was completed in 2010. It was a life cycle inventory and impact assessment of 1,000 cans
with a variety of sizes representing shares of market shipment by each size in accordance with the International
Standards ISO 14040 and 14044. The study did not include beverage filling, secondary packaging, and beverage
distribution. The baseline production year was 2006. The study reported results for both cradle-to-gate and cra-
dle-to-grave scopes. Cradle-to-gate results were calculated without assigning any upstream environmental bur-
den to incoming scrap fractions, and cradle-to-grave results were based on a closed-loop substitution approach
applied to the system’s net scrap output. Key parameters of beverage cans were:
Metallic weight of an average can was 13.34 grams and the beverage volume was estimated to be 12.4
oz;
Recycled content was 67.8%, excluding internal rolling mill scrap; and
EoL recycling rate was 51.6%.
The 2014 Study
The third study was completed in 2014. It was a life cycle inventory and impact assessment of 1,000 cans with
a variety of sizes representing shares of market shipment by each size in accordance with the International
Standards ISO 14040 and 14044. The study did not include beverage filling and distribution. The baseline pro-
duction year was 2012. The study reported results for both cradle-to-gate and cradle-to-grave scopes. Cradle-to-
16 of 65gate results were calculated without assigning any upstream environmental burden to incoming scrap fractions,
and cradle-to-grave results were based on a closed-loop substitution approach applied to the system’s net scrap
output. Key parameters of cans were:
Metallic weight of an average can was 13.04 grams and no beverage volume information was reported;
Recycled content was 70%, excluding internal rolling mill scrap; and
EoL recycling rate was 54.6%.
These studies have helped the industry and its stakeholders understand the potential environmental impacts of
beverage cans in great detail, enabling informed decision making and the identification of areas for improve-
ments. In addition, the studies also helped the general public learn more about what they can do as individual
consumers to contribute to the reduction of environmental impacts of beverage cans, particularly with regard to
UBC recycling.
However, the beverage can product system is a dynamic one in which production technologies and efficiencies
are constantly changing. Being able to monitor such changes and evolutions through continuous LCA studies is
a critical strategy of the aluminum industry and it is highly aligned with the sustainability commitment made by
the industry.
17 of 651. Goal of the Study
The aim of this study is to generate high-quality, up-to-date data on the environmental performance of aluminum
beverage can production including the flow of secondary materials from EoL back into beverage cans. With such
LCI data, the Aluminum Association and its member companies can assist other organizations to understand
and communicate the environmental benefits of manufacturing with aluminum rather than other materials with
similar physical properties. It provides useful insights for different stakeholder groups, such as primary or sec-
ondary aluminum producers, aluminum users, waste recyclers, government agencies, non-governmental organ-
izations, LCA practitioners and media.
The intended audience for this study is the Aluminum Association itself, potential customers and decision mak-
ers in the industry, as well as the general public. The Aluminum Association experts will use the information from
this study in an aggregated manner for public communications, to develop marketing materials for potential
customers, and to provide data to customers for the purpose of developing LCIs within their own applications.
This LCA study has been carried out in accordance with the International Standard ISO 14044. It has been criti-
cally reviewed by an independent expert in accordance with ISO 14044, clause 6.1 to conform with all ISO re-
quirements.
18 of 652. Scope of the Study
The following sections describe the general scope of the project to achieve the stated goals. This includes, but
is not limited to, the identification of specific product systems to be assessed, the product function(s), functional
unit and reference flows, the system boundary, allocation procedures, and cut-off criteria of the study.
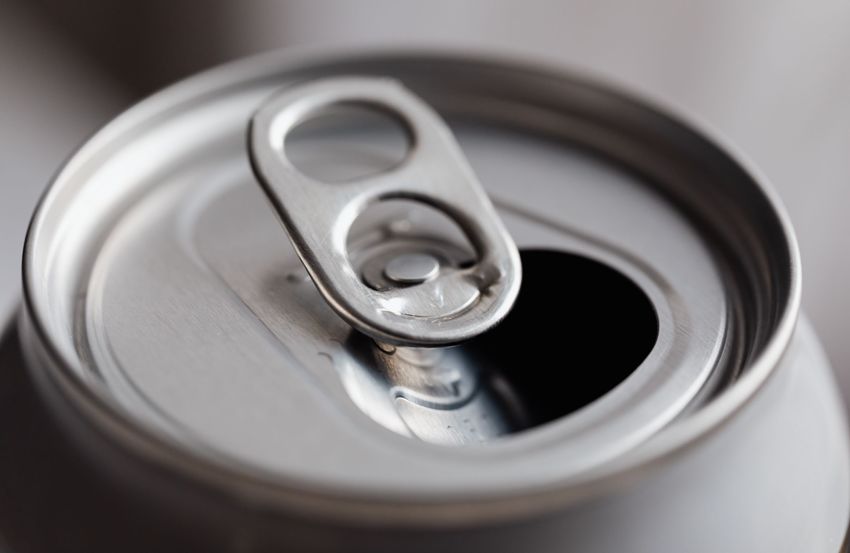
2.1. Product System(s)
The product system assessed in this study is aluminum beverage cans produced in North America and predom-
inantly used for carbonated beverages (Figure 2-1). Based on the data collected for this study, the metallic weight
of an average can is 12.99 grams, the recycled content is 73% (excluding internal rolling mill scrap), and the EoL
recycling rate is 50.4%.
Figure 2-1: Aluminum beverage cans
2.2. Product Function(s), Functional Unit, and Reference Flow
The function of the beverage can is to serve as a container for mostly carbonated beverages such as beer or soft
drinks. No other functions of the analyzed average beverage can are considered in this study.
Accordingly, the functional unit of the study is defined as the volume of beverage contained by 1,000 aluminum
beverage cans with a weighted average can size of 13.6 fl oz per can, equaling 13,600 fl oz in total (106 gal or
402 L).
Based on this functional unit, the reference flow is calculated as 13.46 kg of finished aluminum cans.
19 of 652.3. System Boundaries
The product being examined is an average beverage can made of aluminum. It represents the current techno-
logical situation in the North American market.
The study is “cradle-to-grave” in scope, starting with the extraction of the bauxite ore at the mine, including the
production/processing of aluminum ingot and the manufacturing of the aluminum beverage can, and ending
after the recovery and recycling of the UBC. Table 2-1 summarizes the system boundaries with regard to the
general processes/quantities that are considered in the study.
Table 2-1: System boundaries
Included Excluded
Raw materials extraction Capital equipment and maintenance
Energy and fuel inputs Human labor and employee commute
Further processing materials (e.g., chemi- Maintenance - of equipment
cals, solvents, etc.) Manufacture of any beverage and its filling
Processing of raw materials and semi-fin- in cans
ished products Internal transportation of materials
Overhead (heating, lighting) of manufactur- Packaging of cans for distribution to con-
ing facilities sumers
Transportation of raw and processed materi- Distribution
als Use of product
Product disposal and recycling
2.3.1. Time Coverage
The study aims to represent the calendar year 2016.
2.3.2. Technology Coverage
The study aims to represent the current manufacturing technologies employed by North American aluminum can
sheet producers and can manufacturers.
2.3.3. Geographical Coverage
The study aims to represent the aluminum can industry in North America. Can sheet, can making and recy-
cling/secondary metal production covers the United States and Canada. Primary aluminum production covers
United States, Canada, and countries exporting primary ingot to North America. Alumina production and mining
covers the global situation.
20 of 652.4. Allocation
2.4.1. Multi-output Allocation
No co-product allocation was necessary in the foreground system of the study. Allocation of background data
(energy and materials) taken from the GaBi 2020 databases is documented online at http://documenta-
tion.gabi-software.com/.
2.4.2. End-of-Life Allocation
End-of-Life allocation generally follows the requirements of ISO 14044, section 4.3.4.3. Such allocation ap-
proaches address the question of how to assign impacts from virgin production processes and the recycling
activities to material that is recycled and used in future product systems. Common approaches to account for
end-of-life recycling and recycled content in LCA are described below.
This study applies the embodied burden approach in its “net scrap” variant. It accounts for industry-average
scrap inputs into can sheet production, the U.S. average end-of-life recycling rate and recycling yield of aluminum
cans, and it uses the same consumption-based inventory of North American primary aluminum ingot that is also
used in the manufacturing phase (i.e., the embodied burden) to assign a credit for recovered secondary alumi-
num. Sphera considers this approach to be the most sensible and internally consistent EoL allocation approach
as it avoids both the uncertainties of estimating future substitution rates as well as the potential bias or net-
negative results caused by crediting a different inventory than the one used in manufacturing. Other than the
cut-off approach, it further ensures that any net scrap deficit of a product system is balanced by an additional
burden of primary material by reversing the signs of the recycling and recycling credit in part (ii) of Figure 2-2.
For a more detailed discussion, please refer to (Koffler & Finkbeiner, 2017).
• Cut-off approach (also known as 100:0 or recycled content approach) – The burdens of processing and
recycling of any waste material sent to recycling is attributed to the subsequent, scrap-consuming prod-
uct system and considered to be outside of the system boundary (i.e., they are “cut off”). The system
boundary at end of life is drawn after scrap collection to account for the collection rate. Accordingly, any
scrap inputs into the manufacturing stage are considered to be free of any upstream virgin material
burdens (see part (i) of Figure 2-2). In cases where waste materials are sent to waste incineration, they
are linked to an inventory that accounts for waste composition and heating value as well as for regional
efficiencies and heat-to-power output ratios. In cases where waste materials are sent to landfills, they
are linked to an inventory that accounts for waste composition, landfill gas capture as well as utilization
rates (flaring vs. power production). No credits for power or heat recovered from waste incineration or
landfilling are assigned under the cut-off approach for consistency with the accounting approach for
recycling.
21 of 65Scrap Secondary Virgin Secondary Virgin
Remelting & DC casting Remelting & DC casting
Can sheet rolling Can sheet rolling
Can manufacturing Can manufacturing
Use Use
Scrap (+) Recycling
(-) Recycling credit
(i) Cut-off approach (ii) Substitution & embodied burden approach (net
scrap)
Figure 2-2: Schematic representations of the end-of-life allocation approaches
• Substitution approach (also known as 0:100 or end of life recycling approach) – This allocation ap-
proach is based on the perspective that a material that is recycled into a secondary material at end of
life will substitute another material based on technical substitutability. The substituted material can be
the same material (closed loop recycling) or a different one (open loop recycling). If changes to the
inherent material properties occur (i.e., changes in material quality), these need to be accounted for
(downcycling/upcycling). Hence, a credit is given to account for the material substitution based on the
mass and quality of the recovered secondary material.
This also means that upstream burdens equivalent to the EoL net credit should be assigned to waste
materials used as an input into the manufacturing stage to avoid double-counting the benefits of recy-
cled contents (i.e., by receiving a credit at end-of-life for recycling a secondary material that entered the
product system without any upstream burden of virgin material production).
Mathematically, double-counting is avoided by first subtracting open scrap inputs into the manufactur-
ing stage from scrap to be recycled at end of life to arrive at the overall “net scrap” output from the
product life cycle. This remaining net scrap is then sent to material recycling and the recovered second-
ary material credited using a market-average inventory of the substituted material (see part (ii) of Figure
2-2). Note that the incoming scrap is not burdened with any upstream burden of virgin material produc-
tion under the net scrap approach; instead, the EoL credit is reduced by reducing the amount of scrap
that is sent to recycling. This leads to the exact same cradle-to-grave life cycle result without increasing
the cradle-to-gate burden, and it incentivizes the use of recycled content without sacrificing EoL recycling
credits like the cut-off approach does. Also note that the net scrap may become a negative amount in
cases of high scrap demand in manufacturing and low collection rates in end-of-life. Such a scrap deficit
in the product system would then be addressed the same way as the recycling and crediting of an excess
of end-of-life scrap, but with a negative sign.
Waste material sent to landfill or waste incineration is treated the same way as under the cut-off ap-
proach, but with the difference that recovered power and heat are addressed by crediting average grid
electricity and thermal energy from natural gas, respectively.
22 of 65• Embodied burden approach - This allocation approach is based on the perspective that a waste material
that is recycled into a secondary material at end of life will take its embodied burdens of virgin material
production with it into the next product system (think: relay race or environmental “backpack”). It there-
fore does not matter which material is substituted in the scrap-receiving product system; it only matters
that the scrap-consuming product system accepts the net recycling credit allotted to the scrap-producing
product system as the upstream burden of the received waste material. The embodied burden approach
can be implemented with upstream virgin material burden added to the manufacturing phase or using
the same net scrap approach described above. While it is hence very similar to the substitution approach
described above in its mathematical structure (see also part (ii) of Figure 2-2), the main difference is
that the recycling credit is always modeled using the same inventory data that was (or would have been)
used to model virgin material production in the manufacturing stage.
For example, while the above substitution approach may credit a global average inventory of virgin ma-
terial because that waste material is a globally traded commodity (see for example (worldsteel, 2017)),
the embodied burden approach would credit the same exact inventory that was used to model any virgin
material contents in the manufacturing stage, which are usually specific to a country or region. Waste
material sent to landfill or waste incineration is treated the same way as under the substitution ap-
proach.
2.5. Cut-off Criteria
No cut-off criteria are defined for this study. As summarized in section 2.3, the system boundary was defined
based on relevance to the goal of the study. For the processes within the system boundary, all available energy
and material flow data have been included in the model. In cases where no matching life cycle inventories are
available to represent a flow, proxy data have been applied based on conservative assumptions regarding envi-
ronmental impacts.
The choice of proxy data is documented in Chapter 3. The influence of these proxy data on the results of the
assessment has been carefully analyzed and is discussed in Chapter 5.
2.6. Selection of LCIA Methodology and Impact Categories
The impact assessment categories and other metrics considered to be of high relevance to the goals of the
project are shown in Table 2-2 and Table 2-3. TRACI 2.1 has been selected as it is currently the only impact
assessment methodology framework that incorporates US average conditions to establish characterization fac-
tors (Bare, 2012; EPA, 2012). For impact categories where TRACI characterization factors are not available (e.g.,
water footprinting) or where they are not considered to be the most current (e.g., global warming potential),
alternative methods have been used and are described in more detail below.
Global Warming Potential, Non-Renewable Primary Energy Demand and total Primary Energy Demand were cho-
sen because of their relevance to climate change and energy efficiency, both of which are strongly interlinked,
of high public and institutional interest, and deemed to be one of the most pressing environmental issues of our
time. The global warming potential impact category is assessed based on the current IPCC characterization fac-
tors taken from the 5th Assessment Report (IPCC, 2013) for a 100-year timeframe (GWP) as this is currently the
most commonly used metric. The global warming potential results exclude any photosynthetically bound carbon
(also called biogenic carbon) as well as the release of that carbon as CO2.
23 of 65Eutrophication, Acidification, and Smog Formation Potentials were chosen because they are closely connected
to air, soil, and water quality and capture the environmental burden associated with commonly regulated emis-
sions such as NOx, SO2, VOC, and others.
Particulate matter (PM2.5 equiv.) was included due to its relevance to air quality and human health. According
to the World Health Organization (WHO), “air pollution-related deaths and illness are linked most closely to ex-
posures to small particulate matter (PM) of less than 10 or 2.5 microns in diameter (PM10 and PM2.5). Small
particulates bypass the body's defenses against dust, penetrating deep into the respiratory system. They also
comprise a mixture of health-harming substances, such as heavy metals, sulphur compounds, carbon com-
pounds, and carcinogens including benzene derivatives” (WHO, 2021).
The Montreal Protocol on Substances that Deplete the Ozone Layer was implemented in 1989 with the aim of
phasing out emissions of ozone depleting gases. The protocol has been ratified by all members of the United
Nations – an unprecedented level of international cooperation. With a few exceptions, use of chlorofluorocar-
bons, the most harmful chemicals, have been eliminated, while complete phase-out of less active hydrochloro-
fluorocarbons will be achieved by 2030. As a result, it is expected that the ozone layer will return to 1980 levels
between 2050 and 2070. In addition, no ozone-depleting substances are emitted in the foreground system
under study. For these reasons, ozone depletion potential is not considered in this study.
Blue water consumption, i.e., the anthropogenic removal of water from its watershed through shipment, evapo-
ration, or evapotranspiration has also been selected due to its high political relevance. The UN estimates that
roughly a billion people on the planet don’t have access to improved drinking water, which entails a variety of
problems around ecosystem quality, health, and nutrition. While a detailed water scarcity or water availability
footprint was outside of the scope of this study, two water consumption metrics were considered: one with and
one without inclusion of turbined water from hydropower generation. While the turbined water is technically
“consumed” since hydropower dams may act as a man-made barrier between watersheds, it is not evaporated
but remains in the surface water body. In addition, due to the high share of hydropower in the aluminum supply
chain, the turbined water would dominate the water consumption results and divert attention from other sources
of water consumption that are evaporative in nature and can therefore be argued to be of higher environmental
concern. As such, the base results show water consumption values excluding turbined water, while water con-
sumption results including turbined water are reported in Annex B.
The present study excludes the assessment of mineral resources, as despite 20 years of research, there remains
no robust, globally agreed upon method - or even problem statement - for assessing mineral resource inputs in
life cycle impact assessment (Drielsmaa, et al., 2016). One may further argue that the concern regarding the
depletion of scarce resources is not as much an ‘environmental’ one, but rather about the vulnerability of mar-
kets to supply shortages. These shortages, in return, are driven by various factors that are not captured well by
current metrics. Accordingly, resource criticality has emerged as a separate tool to assess resource consumption
(Nassar, et al., 2012; Graedel & Reck, 2015). As a complete criticality assessment is out of scope for this work
and the environmental interventions associated with the production and consumption of these resource are
captured by the other impact categories the study at hand therefore excluded the assessment of abiotic re-
sources.
24 of 65You can also read