North Essex Garden Communities Employment & Demographic Studies
←
→
Page content transcription
If your browser does not render page correctly, please read the page content below
Colchester Borough Council, Braintree District Council, Tendring District Council and
Essex County Council

North Essex Garden Communities
Employment & Demographic
Studies

  Final Report                 April 2017      Cambridge Econometrics   sp@camecon.com
                                               Cambridge, UK            www.camecon.com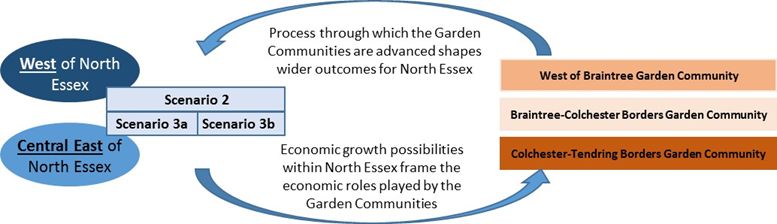
North Essex Garden Communities Employment & Demographic Studies

    Cambridge Econometrics’ mission is to provide rigorous, accessible and relevant independent
 economic analysis to support strategic planners and policy-makers in business and government, doing
                         work that we are interested in and can be proud of.

                       Cambridge Econometrics Limited is owned by a charitable body,
                           the Cambridge Trust for New Thinking in Economics.
                                     www.neweconomicthinking.org

Cambridge Econometrics and SQW                                                                                    2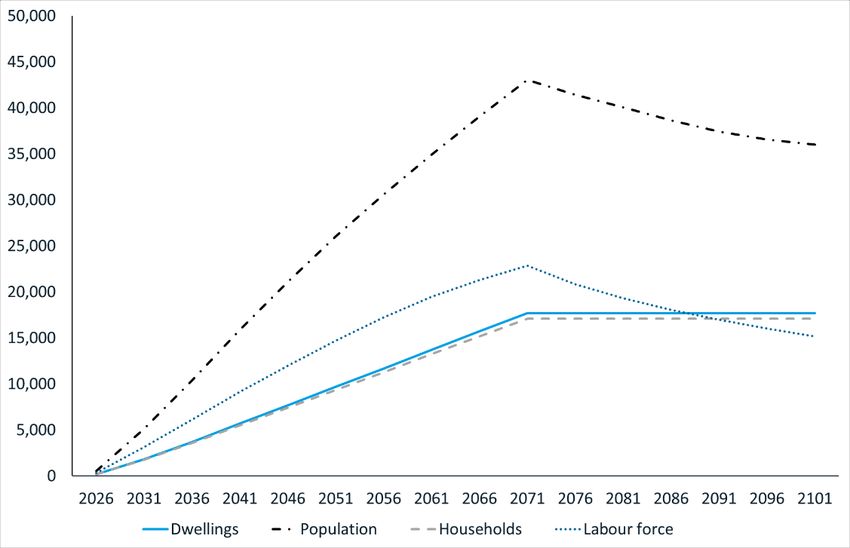
North Essex Garden Communities Employment & Demographic Studies

Authorisation and Version History

 Version    Date         Authorised for                         Description
                           release by
 1.0       28/04/17   Mike May-Gillings           Final Report
                      (Associate Director)

                                                                                    3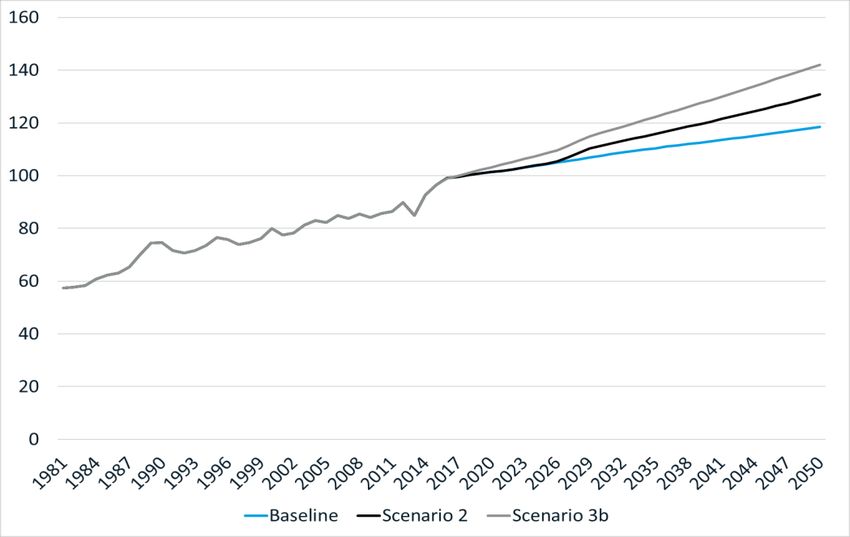
North Essex Garden Communities Employment & Demographic Studies
Contents
Page
1 Introduction 8
2 Demographic modelling 10
2.1 Introduction 10
2.2 The Chelmer Population and Housing Model 10
2.3 Assumptions 10
2.4 Demographic profile and implications for West of Braintree 12
2.5 Demographic profile and implications for Colchester Braintree Borders
18
2.6 Demographic profile and implications for Tendring Colchester Borders
24
3 Approach to analysing future employment 30
3.1 A framework for considering future employment growth 30
3.2 Introducing the employment scenarios 36
4 Employment scenarios 38
4.1 Scenario 1: ‘Business as Usual’ 38
4.2 Scenario 2: ‘Business as Usual + A120 improvements 40
4.3 Scenario 3: ‘Potential Unlocked’ 42
4.4 Comparing the scenarios 49
5 Employment implications for NEGCs 51
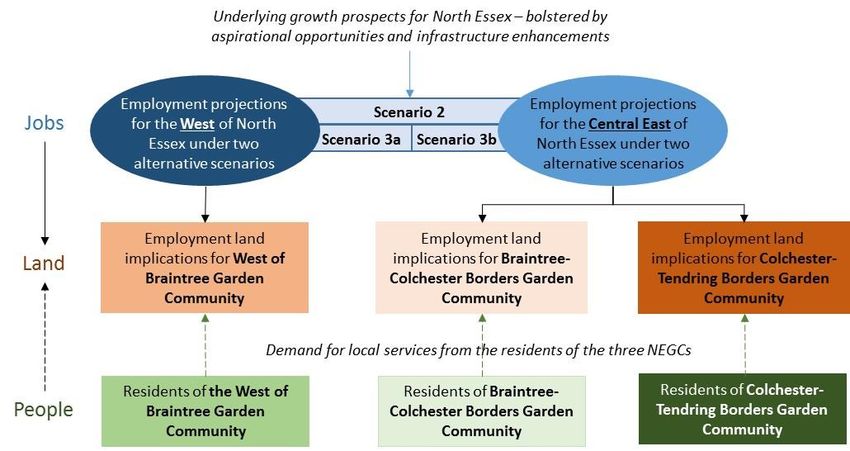
5.1 The relationship between the scenarios and the NEGCs 51
5.2 Employment land possibilities and implications 52
5.3 West of North Essex – and West of Braintree Garden Community 53
5.4 Central East of North Essex – and the two NEGCs in the east of the
area 58
6 Conclusion 68
6.1 Summarising the key demographic findings 68
6.2 Summarising the key employment-related findings 68
6.3 The role of NEGCs in relation to wider growth ambitions for North
Essex 70
6.4 Advancing the NEGC project 71
6.5 Implications for planning policy 73
4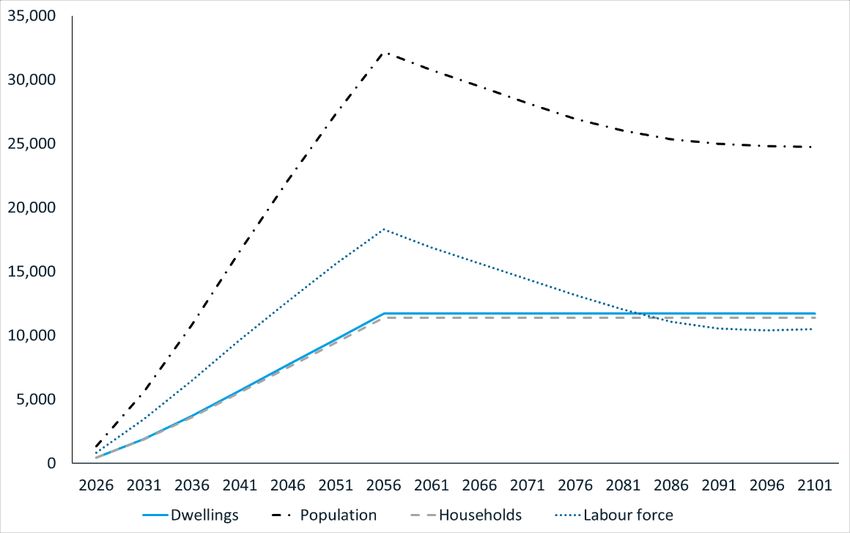
North Essex Garden Communities Employment & Demographic Studies

Appendices                                                                        75

Appendix A   List of Consultees                                                   76

Appendix B   Key strategies and reports                                           77

Appendix C   The Chelmer Population and Housing Model                             78

                                                                                    5
North Essex Garden Communities Employment & Demographic Studies

Executive Summary

•      The shared vision of the three North Essex Districts (Braintree, Colchester
       and Tendring) sets out a need for three new Garden Communities (West of
       Braintree, Colchester Braintree Borders, Tendring Colchester Borders) as
       part of the area’s response to its growth needs.
•      The intention is that the North Essex Garden Communities (NEGC) are
       developed according to ‘Garden City Principles’ as set out by the Town and
       Country Planning Association (TCPA)1, which have been adapted into the
       North Essex Garden Communities Charter to reflect the local ambitions.
•      Consistent with the TCPA principle that there should be a variety of
       employment opportunities within easy commuting distance of homes, the
       local authorities have set a target of creating one new job for each new
       home.
•      Combined, the NEGCs have the capacity for up to 42,000 homes, with the
       potential for the delivery of up to 7,500 dwellings in the current Plan period
       to 2033.
•      Cambridge Econometrics (CE) and SQW have been commissioned to
       determine the likely demographic profile of each Garden Community to
       inform future service provision planning, and to develop quantified scenarios
       for future employment growth, to inform job creation targets.
•      This study has not sought to develop an economic growth plan for North
       Essex – although the findings from it ought to be helpful in seeking to inform
       one.
•      Cambridge Econometrics has used its Chelmer Population and Housing
       Model (Chelmer) to develop a number of demographic scenarios, to provide
       a ‘most likely’ demographic profile for each of the Garden Communities.
•      The demographic scenarios show the impact of alternative assumptions (the
       key ones being timing of the build-out of the settlements, and the gender/age
       profile of in- and out-migration for each settlement) on the demographic
       profile of each settlement.
•      The ‘most likely’ scenario for each settlement assumes the current planned
       (by North Essex Districts) build-out, to reach 2,500 dwellings by the end of
       the plan period (2033), and continuing to rise at similar annual rates
       thereafter until completion of each settlement. The assumptions for in- and
       out-migration in this scenario are based on those for similar new
       settlements.
•      Under the ‘most likely’ demographic scenario for each settlement,
       population is estimated to peak at: just over 32,000 inhabitants by 2056 in
       ‘West of Braintree’; just over 43,000 by 2071 in Colchester Braintree
       Borders, and; just over 20,000 by 2051 in Tendring Colchester Borders.

1
    North Essex Authorities Strategic Part 1 for Local Plans (2016), s.1.6: Key issues – Opportunities and
Challenges

                                                                                                             6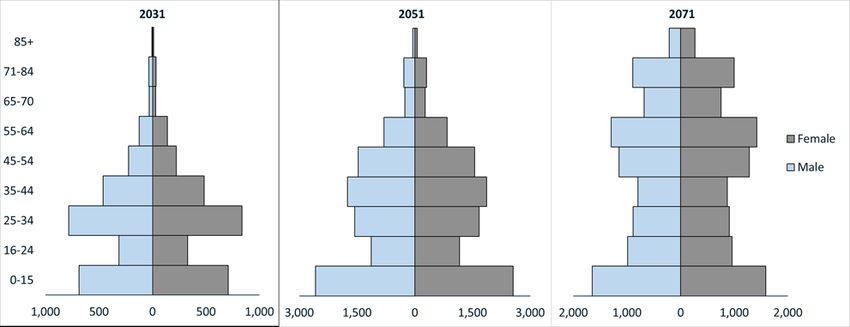
North Essex Garden Communities Employment & Demographic Studies

•   Total population in each settlement is then expected to decline, due to
    ageing of the population (as older people form smaller households), and
    under the assumption of no new houses being built.
•   A faster, more ambitious, build-out rate would lead to a slightly higher peak
    population (which would be reached sooner), due to the larger numbers of
    young population and children moving into the settlements.
•   In order to answer the question: ‘how will future employment be created, in
    order to achieve the one job per dwelling aspiration?’, a framework was
    developed for considering future employment growth, and a series of
    alternative economic scenarios were then identified and quantified (using
    CE’s Local Economy Forecasting Model, LEFM)
•   The economic scenarios were modelled at the level of proxy economic
    areas, defined as ‘West of North Essex’ (for the West of Braintree Garden
    Community) and ‘Central East of North Essex’ (for the Colchester Braintree
    Borders and Tendring Colchester Borders Garden Communities), to reflect
    the travel to work patterns and proximity to existing economic centres.
•   A number of comparator locations were also identified, with similar
    characteristics to the economic areas, and these were then used to help
    quantify the potential faster economic growth for particular sectors impacted
    in each of the scenarios.
•   The economic scenarios were then quantified, and the implications for the
    NEGCs were identified. The NEGCs are likely to account for a significant
    component of the additional employment growth linked to the scenarios,
    associated with up to about 95% of the increment linked to the ‘West of
    North Essex’ scenario and up to about 40% of the increment linked to the
    ‘Central East of North Essex’ scenario.
•   All three NEGCs are likely to be associated with significant jobs growth,
    where jobs linked to exogenous growth processes are presumed to be
    physically on site, those linked to homeworking will be physically associated
    with the homes of residents and therefore also on site, and those related to
    the consumption of local services may or may not be on site, but all will be
    reasonably “local”.
•   All three NEGCs appear to be “within range” of the TCPA aspiration of “one
    job per house”.
•   The scenarios are very ambitious and their achievability depends on many
    different factors, some of which are very difficult to influence, but the
    likelihood of achieving them will increase if there is a proactive economic
    growth plan in place across North Essex and the NEGCs are delivered in a
    manner which itself is proactive, visionary, managed and appropriately
    resourced.
•   By way of conclusion, this report offers some observations on the NEGC
    venture and – from an economic growth perspective – the issues that local
    partners, particularly the local authorities, will need to consider. We then
    comment briefly on the consequences for planning policy.

                                                                                        7
North Essex Garden Communities Employment & Demographic Studies
1 Introduction
In the context of the ‘duty to cooperate’ placed on local authorities in the
preparation of Local Plans, the three North Essex Districts are working together
to address strategic planning matters across their areas, in collaboration with
Essex County Council. As part of this, the shared vision for North Essex sets
out a need for new Garden Communities as part of the area’s response to its
growth needs. The intention is that these are developed according to the
‘Garden City Principles’ set out by the Town and Country Planning Association
(TCPA)2, which have been adapted into the Garden City Charter to reflect the
local ambitions.
Specifically, the local authorities have identified the scope for three North
Essex Garden Communities (NEGCs). These are
• West of Braintree – about four miles west of central Braintree, just north
of the A120 around Blake End. The proposed Community is located in
Braintree District.
• Colchester Braintree Borders – at the junction of the A12 and the A120
and the junction of the Great Eastern Mainline and the Gainsborough Line.
The proposed Community is entirely within Colchester Borough.
• Tendring Colchester Borders – an urban extension to Colchester located
alongside the University of Essex campus between the A120 and the
A133. The proposed Community spans the border between Colchester
Borough and Tendring District.
Combined, the NEGCs have the capacity for up to 42,000 homes, with the
potential for the delivery of up to 7,500 dwellings in the current Plan period to
2033, as outlined in Table 1.1 below.
Table 1.1 North Essex Garden Communities: Planned growth
Community Plan period Total
Homes Population Homes Population
Tendring Colchester Borders 2,500 5,750 7,000-9,000 16,100-20,700
Colchester Braintree Borders 2,500 5,750 15,000-20,000 34,500-46,000
West of Braintree 2,500 5,750 10,000-13,000 23,000-29,900
Total 7,500 17,250 32,000-42,000 73,600-96,600
Source: AECOM (2016) and SQW.
Underpinning this, and consistent with the TCPA principle that there should be
a variety of employment opportunities within easy commuting distance of
homes, the local authorities have set a target of creating one new job for each
new home. While it is not anticipated that these will all be located on site, it is
intended that they will be reasonably accessible, including by public transport.
Substantial work is underway to establish the feasibility of the NEGCs. A multi-
volume Concept Feasibility Study was developed by AECOM in spring 2016.
Currently, Concept Frameworks are being developed for Tendring Colchester
2
North Essex Authorities Strategic Part 1 for Local Plans (2016), s.1.6: Key issues – Opportunities and
Challenges
8North Essex Garden Communities Employment & Demographic Studies
Borders and Colchester Braintree Borders by David Lock Associates, and for
West of Braintree by AECOM.
In parallel, Cambridge Econometrics (CE) and SQW were commissioned to
determine the likely demographic profile of each Garden Community to inform
future service provision planning, and to develop quantified scenarios for future
employment growth. This document sets out both our approach to the technical
aspects of this study and the findings that have been generated.
Our report is divided into five further chapters:
• Chapter 2 reports on the outcomes from the demographic modelling
• Chapter 3 describes the approach we have developed in explaining
economic futures
• Chapter 4 reports on the outcomes in terms of alternative growth scenarios
for different areas within North Essex
• Chapter 5 works through the employment implications for the NEGCs
• Chapter 6 sets out some conclusions.
9North Essex Garden Communities Employment & Demographic Studies
2 Demographic modelling
2.1 Introduction
This chapter presents the demographic projections developed for each of the
three new Garden Communities3. The aim of the demographic modelling was
to prepare a likely demographic profile for each Garden Community using CE’s
Chelmer model, based on assumptions for construction rates, migration rates,
birth rates and death rates. Section 2.2 and 2.3 briefly discusses the modelling
framework and key assumptions underlying the demographic projections, while
the remaining sections describe the projections themselves.
For each new settlement, three scenarios were modelled4, varying the migration
assumptions and the build-out rates. This Chapter focuses on two of the
scenarios, but the full description of all the scenario assumptions and results
can be found in the accompanying individual Demographic Analysis Reports for
each new garden community.
2.2 The Chelmer Population and Housing Model
The Chelmer Population and Housing Model5 is a well-established demographic
model, which models the interaction between population and housing in an area
over time and provides detailed demographic and housing projections for areas
of interest.
For this study, a Chelmer model was set up for each of the new Garden
Communities for the period 2011-2101, to cover the relevant study period
required (Chelmer works in 5-year periods from 2011). The model was used to
calculate the likely demographic profile of the population that would result from
a particular time profile (or build-out rate) of dwellings construction, based on
the trajectories and delivery of the garden communities to 2034 provided by
Colchester Borough Council6. For periods after 2034, the build-out rate was held
constant for the rest of the forecast period, until the midpoint of the overall total
dwellings target for each garden community was reached (as set out in Table
2.1).
The results of the model were used to generate a demographic profile for each
Garden Community, and are described in sections 2.4, 2.5 and 2.6.
2.3 Assumptions
As mentioned above, three scenarios were developed for each new settlement.
Scenario 1 and 2 were based on the dwellings trajectory from the Local Plan,
while Scenario 3 was based on an accelerated dwellings trajectory. The
migration assumptions in Scenario 1 were based on migration trends in the
wider district(s) each settlement is based within. In scenario 2 and 3, however,
3
For the full description of the methodology and assumptions developed for the demographic modelling,
see the individual Demographic Analysis Reports for each new garden community.
4
For the full description of the scenario assumptions and results, see the individual Demographic Analysis
Reports for each new garden community.
5
See Appendix C for full description of Chelmer.
6
See Appendix C for more information on the model logic of dwelling-constrained Chelmer projections.
10North Essex Garden Communities Employment & Demographic Studies
the migration assumptions were tailored to reflect a younger population, as the
initial population moving into a new settlement is likely to be quite young, often
made up of young couples, perhaps with young children.
Dwellings Colchester Borough Council provided new dwellings trajectories, which have
been agreed and used by all the local authorities, for each of the garden
communities on an annual basis to 2034. Thereafter, the build-out rate was held
constant for the rest of the forecast period, until the midpoint of the overall total
dwellings target for each garden community was reached. The assumptions for
each scenario were aggregated to the five-year periods used in Chelmer and
are outlined in Table 2.1 below.
Table 2.1: Cumulative new dwellings trajectory for new Garden Communities
2021- 2026- 2031- 2036- 2041- 2046- 2051- 2056- 2061- 2066-
26 31 36 41 46 51 56 61 66 71
Scenario 2
West of Braintree 450 1,900 3,700 5,700 7,700 9,700 11,700 11,700 11,700 11,700
Colchester Braintree Borders 200 1,800 3,700 5,700 7,700 9,700 11,700 13,700 15,700 17,700
Tendring Colchester Borders 750 2,000 3,400 4,900 6,400 7,900 8,200 8,200 8,200 8,200
Scenario 3
West of Braintree 543 2,293 4,463 6,873 9,283 11,693 11,693 11,693 11,693 11,693
Colchester Braintree Borders 400 3,070 5,869 8,684 11,499 14,314 17,129 17,692 17,692 17,692
Tendring Colchester Borders 1013 2,763 4,648 6,623 8,203 8,203 8,203 8,203 8,203 8,203
Source: Colchester Borough Council.
Migration The migration assumptions7 in Scenario 2 and Scenario 3 were developed using
Census data for ‘young’ settlements. The level of in-migration was reallocated
towards younger age bands, based on the average profile of in-migration in
‘young’ settlements during a period when they were still being built. This
included Cambourne in 2011, Bar Hill in 1981 and Great Notley in 2001. The
‘young’ settlements used to calculate the average migration profile were agreed
with the client group and are also in the East of England, so are likely to face
similar regional patterns. The rates of out-migrants as a percentage of the
population of each age band in ‘young’ settlements on average (Cambourne in
2011 and Great Notley in 2001) were used for the out-migration assumptions.
The same migration profile was applied throughout the forecast period for
simplicity and easier comparison of scenario results, and are summarised in
Table 2.2 below.
7
This includes internal (within the UK) migration and international migration.
11North Essex Garden Communities Employment & Demographic Studies
Table 2.2: Migration assumptions
In-migration Out-migration
% of total in-migration % of population of each age band
1-4 10.0 7.5
5-15 13.6 4.0
16-24 15.1 16.4
25-34 31.9 12.3
35-44 15.5 5.4
45-59 10.3 5.6
60-64 1.2 4.4
65+ 2.4 4.3
2.4 Demographic profile and implications for West of Braintree
Scenario 2 In Scenario 2, 2,500 houses are built by 2033 (the end of the Plan period), and
the settlement is completed by 2056, with a total of 11,700 houses being built.
Houses are being built up to 2056, and so population, households and the
labour force will steadily increase as more dwellings are completed each year
(see Figure 2.1:). Thereafter, no new households are built, and population and
labour force start to decline as people who moved in during the early years of
development start to age.
Figure 2.1: Dwellings, Population, Households and Labour force
Source: Cambridge Econometrics.
12North Essex Garden Communities Employment & Demographic Studies
Over the development period, the population profile will become more balanced.
After building is completed in 2056, the population will continue to age,
increasing the number of people aged over 70 in the settlement and reducing
the number of under 24 year olds (see Figure 2.2).
Figure 2.2: Population Pyramids in 2031, 2056 and 2076
Note: The second time period reflects when the settlement is completed, and the third period is 20 years after
completion.
Source: Cambridge Econometrics.
Households In this scenario, as the population ages, the proportion of households without
children tend to increase over time, while those with children decrease (see
Table 2.3).
Table 2.3: Proportion of households by type
2026 2031 2041 2051 2061 2071 2081
1 adult of pensionable age and no children 3% 3% 3% 5% 8% 13% 17%
1 adult of non-pensionable age and no 17% 17% 18% 19% 18% 15% 12%
children
1 adult of non-pensionable age and 1 adult 3% 3% 4% 5% 9% 15% 21%
of pensionable age and no children or 2
adults of pensionable age and no children
2 adults of non-pensionable age and no 30% 29% 26% 24% 22% 20% 17%
children
3 or more adults and no children 6% 7% 8% 9% 10% 9% 8%
Households with 1 dependent child 21% 21% 21% 19% 17% 13% 11%
Households with 2 dependent children 13% 12% 12% 11% 9% 7% 6%
Households with 3 dependent children 3% 3% 3% 2% 2% 2% 1%
Other households 5% 5% 5% 5% 6% 6% 7%
Source: Cambridge Econometrics.
13North Essex Garden Communities Employment & Demographic Studies
Scenario 3 Scenario 3 was based on an accelerated dwellings trajectory, targeting 3,020
dwellings by 2033, using the same build-out profile as in Scenario 2. Under this
scenario, the settlement is completed by 2051 (five years earlier than in
Scenario 2) with a total of 11,700 houses being built. The advantage of using
an accelerated rate is to see how different the demographic profile might look
like if the settlement is completed earlier and the population starts to age sooner.
As more houses are completed at each stage of development in Scenario 3
than in Scenario 2, more people start moving into the new settlement earlier.
Population growth reaches its peak by 2051, at a faster rate than in Scenario 2
(see Figure 2.3).
Figure 2.3: Total population in Scenario 2 and 3
Source: Cambridge Econometrics.
There is a marginal bias towards older age bands in Scenario 3 (which finished
being built five years earlier), as the population of the settlement starts to age
sooner in this scenario. By 2056, when the settlement has finished being built
in Scenario 2, working-age population accounts for a slightly smaller proportion
of the total population in Scenario 3 than in Scenario 2 (see Figure 2.4).
Figure 2.4: Population in Scenario 2 and Scenario 3 at the end of 2056
Source: Cambridge Econometrics.
14North Essex Garden Communities Employment & Demographic Studies
Child population One major impact of the accelerated build-out rate is on child population growth
and its implication for school requirements. During the earlier phases of the
development, there is likely to be faster growth in children of primary and
secondary school age in Scenario 3 than in Scenario 2, as younger adults
moving in are more likely to bring children with them or form families shortly
after moving in (see Figure 2.5 and Figure 2.6). By the time the settlement is
completed in each scenario, the child population in primary and secondary
education is considerably larger in Scenario 3 than in Scenario 2. Thereafter,
as the population starts to age, the number of children of primary and secondary
school age declines more steeply in Scenario 3, resulting in a much lower
requirement for local schools.
Figure 2.5: Child population of primary school age (4-10)
Figure 2.6:
Source: Child population
Cambridge of secondary school age (11-15)
Econometrics.
Source: Cambridge Econometrics.
15North Essex Garden Communities Employment & Demographic Studies
Elderly The number of people aged 70 and over would grow at a faster rate in Scenario
population 3 than in Scenario 2, as more people move in during the early phases of the
development and the existing population starts to age (see Figure 2.7). As a
result, at its peak (around 40 years after building is completed in each scenario),
the elderly population is slightly larger in Scenario 3, resulting in a higher
requirement for public service provision for the elderly.
Figure 2.7: Elderly (70+) population in Scenario 2 and Scenario 3
Source: Cambridge Econometrics.
Households The household composition in Scenario 3 is very similar to that in Scenario 2
over the forecast period (see Table 2.4).
During the initial development period of the settlement, household size is
between 2.8-3.0 people. This is higher than the district average (2.4 people), as
the community is assumed to be settled largely by young families. After
construction is completed, household size starts to fall as the population starts
to age.
16North Essex Garden Communities Employment & Demographic Studies
Table 2.4: Proportion of households by type in Scenario 2 and 3
2056 2101
Scenario 2 Scenario 3 Scenario 2 Scenario 3
1 adult of pensionable age and no children 6% 6% 23% 23%
1 adult of non-pensionable age and no children 18% 19% 10% 11%
1 adult of non-pensionable age and 1 adult of pensionable age and no 7% 7% 22% 21%
children or 2 adults of pensionable age and no children
2 adults of non-pensionable age and no children 24% 23% 15% 15%
3 or more adults and no children 9% 10% 6% 6%
Households with 1 dependent child 18% 18% 10% 11%
Households with 2 dependent children 10% 10% 6% 6%
Households with 3 dependent children 2% 2% 1% 1%
Other households 6% 6% 7% 7%
Source: Cambridge Econometrics.
17North Essex Garden Communities Employment & Demographic Studies
2.5 Demographic profile and implications for Colchester
Braintree Borders
Scenario 2 In Scenario 2, 2,500 houses are built by 2033 (the end of the Plan period), and
the settlement is completed by 2071, with a total of 17,700 houses being built.
Houses are being built up to 2071, and so population, households and the
labour force will steadily increase as more dwellings are completed each year
(see Figure 2.8). Thereafter, no new households are built, and population and
labour force start to decline as people who moved in during the early years of
development start to age.
Figure 2.8: Dwellings, Population, Households and Labour force
Source: Cambridge Econometrics.
Over the development period, the population profile will become more balanced.
After building is completed in 2071, the population will continue to age,
increasing the number of people aged over 70 in the settlement and reducing
the number of under 24 year olds (see Figure 2.9).
Figure 2.9: Population Pyramids in 2031, 2071 and 2091
Note: The second time period reflects when the settlement is completed, and the third period is 20 years after
completion.
Source: Cambridge Econometrics.
18North Essex Garden Communities Employment & Demographic Studies
Households In this scenario, as the population ages, the proportion of households without
children tend to increase over time, while those with children decrease (see
Table 2.5).
Table 2.5: Proportion of households by type
2026 2031 2041 2051 2061 2071 2081
1 adult of pensionable age and no children 3% 3% 3% 4% 7% 10% 14%
1 adult of non-pensionable age and no 20% 20% 21% 21% 20% 18% 15%
children
1 adult of non-pensionable age and 1 adult 3% 2% 3% 5% 7% 11% 16%
of pensionable age and no children or 2
adults of pensionable age and no children
2 adults of non-pensionable age and no 30% 30% 27% 25% 24% 22% 19%
children
3 or more adults and no children 5% 6% 6% 7% 8% 8% 7%
Households with 1 dependent child 21% 21% 21% 20% 17% 16% 13%
Households with 2 dependent children 11% 11% 11% 10% 9% 8% 7%
Households with 3 dependent children 3% 2% 2% 2% 2% 2% 1%
Other households 6% 6% 6% 6% 7% 7% 7%
Source: Cambridge Econometrics.
Scenario 3 Scenario 3 was based on an accelerated dwellings trajectory, targeting 4,180
dwellings by 2033, using the same build-out profile as in Scenario 2. Under this
scenario, the settlement is completed by 2057 (14 years earlier than in Scenario
2) with a total of 17,700 houses being built. The advantage of using an
accelerated rate is to see how different the demographic profile might look like
if the settlement is completed earlier.
As more houses are completed at each stage of development in Scenario 3
than in Scenario 2, more people start moving into the new settlement earlier.
Population growth reaches its peak by 2057 at a faster rate than in Scenario 2
(see Figure 2.10).
19North Essex Garden Communities Employment & Demographic Studies
Figure 2.10: Total population in Scenario 2 and 3
Source: Cambridge Econometrics.
There is a marginal bias towards older age bands in Scenario 3 (which finished
being built 14 years earlier than in Scenario 2), as the population of the
settlement starts to age sooner in this scenario. By 2071, when the settlement
has finished being built in Scenario 2, working-age population accounts for a
smaller proportion of the total population in Scenario 3 than in Scenario 2, while
the share of the elderly population has increased (see Figure 2.11).
Figure 2.11: Population in Scenario 2 and Scenario 3 at the end of 2071
Source: Cambridge Econometrics.
Child population One major impact of the accelerated build-out rate is on child population growth
and its implication for school requirements. During the earlier phases of the
development, there is likely to be faster growth in children of primary and
secondary school age in Scenario 3 than in Scenario 2, as younger adults
moving in are more likely to bring children with them or form families shortly
after moving in (see Figure 2.12 and Figure 2.13). By the time the settlement is
completed in each scenario, the child population in primary and secondary
education is considerably larger in Scenario 3 than in Scenario 2. Thereafter,
as the population starts to age, the number of children of primary and secondary
school age declines more steeply in Scenario 3, resulting in a much lower
requirement for local schools.
20North Essex Garden Communities Employment & Demographic Studies
Figure 2.12: Child population of primary school age (4-10)
Source: Cambridge Econometrics.
Figure 2.13: Child population of secondary school age (11-15)
Source: Cambridge Econometrics.
Elderly The number of people aged 70 and over would grow at a faster rate in Scenario
population 3 than in Scenario 2, as more people move in during the early phases of the
development and the existing population starts to age (see Figure 2.14). As a
result, the elderly population is larger in Scenario 3 by the end of the forecast
period, at which point it appears to have steadied in Scenario 3 but is still
growing in Scenario 2, resulting in a higher requirement for public service
provision for the elderly.
21North Essex Garden Communities Employment & Demographic Studies
Figure 2.14: Elderly (70+) population in Scenario 2 and Scenario 3
Source: Cambridge Econometrics.
Households As the population starts ageing sooner in Scenario 3, there is a smaller
proportion of households with children by 2071 (see Table 2.6). In the longer
term, the household composition in Scenario 3 becomes very similar to that in
Scenario 2.
During the initial development period of the settlement, average household size
is between 2.7-2.9 people. This is higher than the Colchester and Braintree
district average (2.4 people), as the community is assumed to be settled largely
by young families. As the population starts to age, household size starts to fall.
22North Essex Garden Communities Employment & Demographic Studies
Table 2.6: Proportion of households by type in Scenario 2 and 3
2071 2101
Scenario 2 Scenario 3 Scenario 2 Scenario 3
1 adult of pensionable age and no children 10% 12% 22% 23%
1 adult of non-pensionable age and no children 18% 16% 12% 11%
1 adult of non-pensionable age and 1 adult of pensionable age and no 11% 15% 21% 21%
children or 2 adults of pensionable age and no children
2 adults of non-pensionable age and no children 22% 20% 15% 14%
3 or more adults and no children 8% 8% 6% 5%
Households with 1 dependent child 16% 13% 10% 10%
Households with 2 dependent children 8% 7% 5% 5%
Households with 3 dependent children 2% 1% 1% 1%
Other households 7% 7% 8% 8%
Source: Cambridge Econometrics.
23North Essex Garden Communities Employment & Demographic Studies
2.6 Demographic profile and implications for Tendring
Colchester Borders
Scenario 2 In Scenario 2, 2,500 houses are built by 2033 (the end of the Plan period), and
the settlement is completed by 2052, with a total of 8,200 houses being built.
Houses are being built up to 2052, and so population, households and the
labour force will steadily increase as more dwellings are completed each year
(see Figure 2.15). Thereafter, no new households are built, and population and
labour force start to decline as people who moved in during the early years of
development start to age.
Figure 2.15: Dwellings, Population, Households and Labour force
Source: Cambridge Econometrics.
Over the development period, the population profile will become more balanced.
After building is completed in 2052, the population will continue to age,
increasing the number of people aged over 70 in the settlement and reducing
the number of under 24 year olds (see Figure 2.16).
Figure 2.16: Population Pyramids in 2031, 2051 and 2071
Note: The second time period reflects when the settlement is completed, and the third period is 20 years after
completion.
Source: Cambridge Econometrics.
24North Essex Garden Communities Employment & Demographic Studies
Households In this scenario, as the population ages, the proportion of households without
children tend to increase over time, while those with children decrease (see
Table 2.7).
Table 2.7: Proportion of households by type
2026 2031 2041 2051 2061 2071 2081
1 adult of pensionable age and no children 2% 3% 4% 5% 9% 15% 19%
1 adult of non-pensionable age and no 21% 21% 22% 22% 20% 16% 13%
children
1 adult of non-pensionable age and 1 adult 2% 2% 4% 5% 9% 15% 20%
of pensionable age and no children or 2
adults of pensionable age and no children
2 adults of non-pensionable age and no 29% 28% 26% 24% 22% 19% 16%
children
3 or more adults and no children 5% 5% 6% 7% 8% 8% 7%
Households with 1 dependent child 21% 21% 20% 19% 16% 12% 10%
Households with 2 dependent children 12% 11% 11% 10% 8% 6% 5%
Households with 3 dependent children 3% 3% 2% 2% 2% 1% 1%
Other households 5% 5% 5% 6% 6% 7% 8%
Source: Cambridge Econometrics.
Scenario 3 Scenario 3 was based on an accelerated dwellings trajectory, targeting 3,460
dwellings by 2033, using the same build-out profile as in Scenario 2. Under this
scenario, the settlement is completed by 2045 (seven years earlier than in
Scenario 2) with a total of 8,200 houses being built. The advantage of using an
accelerated rate is to see how different the demographic profile might look like
if the settlement is completed earlier.
As more houses are completed at each stage of development in Scenario 3
than in Scenario 2, more people start moving into the new settlement earlier.
Population growth reaches its peak by 2045 at a faster rate than in Scenario 2
(see Figure 2.17).
25North Essex Garden Communities Employment & Demographic Studies
Figure 2.17: Total population in Scenario 2 and 3
Source: Cambridge Econometrics.
There is a marginal bias towards older age bands in Scenario 3 (which finished
being built seven years earlier than in Scenario 2), as the population of the
settlement starts to age sooner in this scenario. By 2056, when the settlement
has finished being built in Scenario 2, there is a larger proportion of elderly
population and a smaller proportion of child population in Scenario 3 than in
Scenario 2 (see Figure 2.18).
Figure 2.18: Population in Scenario 2 and Scenario 3 at the end of 2056
Source: Cambridge Econometrics.
Child population One major impact of the accelerated build-out rate is on child population growth
and its implication for school requirements. During the earlier phases of the
development, there is likely to be faster growth in children of primary and
secondary school age in Scenario 3 than in Scenario 2, as younger adults
moving in are more likely to bring children with them or form families shortly
after moving in (see Figure 2.19 and Figure 2.20). By the time the settlement is
completed in each scenario, the child population in primary and secondary
education is considerably larger in Scenario 3 than in Scenario 2. Thereafter,
as the population starts to age, the number of children of primary and secondary
school age declines more steeply in Scenario 3, resulting in a much lower
requirement for local schools.
26North Essex Garden Communities Employment & Demographic Studies
Figure 2.19: Child population of primary school age (4-10)
Source: Cambridge Econometrics.
Figure 2.20: Child population of secondary school age (11-15)
Source: Cambridge Econometrics.
Elderly The number of people aged 70 and over would grow at a faster rate in Scenario
population 3 than in Scenario 2, as more people move in during the early phases of the
development and the existing population starts to age (see Figure 2.21). As a
result, at its peak (around 40 years after building is completed in each scenario),
the elderly population is slightly larger in Scenario 3, resulting in a higher
requirement for public service provision for the elderly.
27North Essex Garden Communities Employment & Demographic Studies
Figure 2.21: Elderly (70+) population in Scenario 2 and Scenario 3
Source: Cambridge Econometrics.
Households As the population starts ageing sooner in Scenario 3, there is a smaller
proportion of households with children by 2056 (see Table 2.8). In the longer
term, the household composition in Scenario 3 becomes very similar to that in
Scenario 2.
During the initial development period of the settlement, average household size
is between 2.7-2.9 people. This is higher than the Tendring and Colchester
district average (2.3 people), as the community is assumed to be settled largely
by young families. As the population starts to age, household size starts to fall.
28North Essex Garden Communities Employment & Demographic Studies
Table 2.8: Proportion of households by type in Scenario 2 and 3
2056 2101
Scenario 2 Scenario 3 Scenario 2 Scenario 3
1 adult of pensionable age and no children 7% 8% 24% 24%
1 adult of non-pensionable age and no children 21% 21% 12% 13%
1 adult of non-pensionable age and 1 adult of pensionable age and no 7% 8% 20% 18%
children or 2 adults of pensionable age and no children
2 adults of non-pensionable age and no children 23% 22% 14% 15%
3 or more adults and no children 7% 8% 6% 6%
Households with 1 dependent child 18% 17% 10% 11%
Households with 2 dependent children 9% 8% 5% 5%
Households with 3 dependent children 2% 2% 1% 1%
Other households 6% 6% 7% 7%
Source: Cambridge Econometrics.
29North Essex Garden Communities Employment & Demographic Studies
3 Approach to analysing future
employment
As well as considering the future demographic profile of the three Garden
Communities, the central question for this study is: how will future
employment be created, in order to achieve the one job per dwelling
aspiration? As the Garden Communities are being planned for the long term,
answering this question needs a 40-year view, albeit recognising that there will
be early delivery within the current Plan period.
This chapter is structured in two parts. The first part sets out a broad framework
for considering future employment. Based on this framework, the second
introduces three employment scenarios, which are described further and
quantified in Chapter 4.
3.1 A framework for considering future employment growth
Five main considerations underpin the approach adopted in this study to the
analysis of future employment, summarised in Table 3.1 below and described
further in the paragraphs that follow.
Table 3.1: Considerations in analysing future employment growth
Key considerations Issues
1. How is employment generated? New employment may be population-driven (i.e.
responding to increased local demand) or it may
support production or services oriented to wider
markets
2. What is a realistic employment Some new employment will be created within
catchment area for each Garden each Garden Community and some will be
Community? accessed by Garden Community residents. But
given the Communities’ proximity to existing
centres, there is likely to be some travel to work
in neighbouring towns
3. How is the nature of employment likely While employment forecasts are quantitative,
to change over time? there will also be qualitative change (for example
in relation to home or remote working). This will
have implications for future employment land
provision
4. How can trend-based future growth be The Garden Communities reflect aspirations for
balanced with aspirational growth? higher-value employment and greater
productivity. But achieving these aspirations will
rely on ‘other things happening’ and may require
a broader range of interventions
5. How does the development of the The Garden Communities could provide
Garden Communities relate to the employment opportunities for existing North
wider economic development of North Essex residents and may build on the
Essex? opportunities presented by existing local
institutions. This may (for example) have
implications for the development of local transport
systems
Source: SQW.
30North Essex Garden Communities Employment & Demographic Studies
Consideration 1: How is employment generated?
Employment may be ‘housing-led’ (i.e. driven by demand for increased public
and consumer services created by population growth) or driven by the
production of goods and services in response to external markets. At individual
Garden Community level, there are potentially four ways in which employment
may be created:
• within organisations serving national, international or regional markets (i.e.
through activities that are concerned with the production of goods or
provision of services that are mostly sold outside the area and do not
compete with each other locally)8: generally, demand for employment
within this category is not linked with demand from the development itself;
• within commercial enterprises which respond to local demand (such as
convenience retail);
• within public services, primarily responding to local demand;
• within activities directly connected with the construction of the site.
For each of these, employment may be located:
• on-site, at a fixed location (i.e. within fixed local public service centres,
such as schools, care homes, etc.) or within commercial employment
floorspace (warehouses, offices, production units, etc.)
• off-site, at a fixed location (i.e. in regionally-provided public services or
other industry)
• on-site, through home working (or through peripatetic work with no fixed
base, such as in parts of the care sector)
8
This category might include non-commercial organisations (e.g. public services catering to national or
regional markets), as well as commercial firms, since these would still not be reliant on local demand to
sustain employment.
31North Essex Garden Communities Employment & Demographic Studies
Table 3.2 summarises these categories within a broad typology of employment.
Table 3.2: Typology of employment
Type of location
Type of employment Fixed location (on Fixed location (off Home based or
site) site) peripatetic
Type 1: Commercial/ office/ Commercial/ office/ Self-employed ‘office-
Goods/services sold workshop/ production workshop/ production based’
in regional/ national/ Comparison retail Employed home-
international markets workers
Type 2: During Plan period: Some local retail Self-employed
Goods/services sold Local retail Comparison retail personal services
in local markets Local commercial Most general
services (banks, etc.) commercial services
+ longer term:
Comparison retail
Type 3: During Plan period: Acute health care Personal social
Public services Pre-school facilities Public administration services
Adult care facilities (central/ local)
GP surgery Blue light services
Schools (primary/ HE/FE
secondary) Secondary education
+ longer term:
FE
Public administration
Type 4: On-site construction Off-site construction, -
Construction related activities (e.g.
electrical trades,
etc.); construction
support
Source: SQW.
Implications Local demand-driven employment can be forecast on the basis of the
demographic projections set out in Chapter 2. However, future prosperity largely
depends on the extent to which employment can be generated in activities that
serve wider markets, rather than rely on local consumption. The scenarios
modelled in later chapters therefore focus more on exogenous employment
growth. These largely depend on local competitive strengths, such as workforce
skills, the local research base and proximity to other centres of economic
activity.
32North Essex Garden Communities Employment & Demographic Studies
Consideration 2: What is a realistic employment catchment area for
each Garden Community?
The Garden City Principles defined by the Town and Country Planning
Association include provision of “a strong local jobs offer in the Garden City
itself, with a variety of employment opportunities within easy commuting
distance of homes”9. More generally, the National Planning Policy Framework
states that planning policies should aim for a balance of uses within an area, so
that journey times to employment are minimised10. Reflecting this, the North
Essex local planning authorities have adopted an overall target of one job per
new dwelling.
Travel to work Current commuting patterns across North Essex are complex. The three
areas and Garden Communities fall within three 2011 census-based travel to work areas
commuting (TTWAs): Clacton (covering Tendring), Chelmsford (covering Braintree) and
patterns Colchester. For full-time workers, the ‘alternative TTWA’ centred on Colchester
essentially maps onto the combined North Essex local authority area, reflecting
the greater distances generally travelled by full-time employees.
However, employment opportunities available to Garden Community residents
will extend beyond the standard or alternative TTWAs: the West of Braintree
Garden Community is, for example, almost exactly on the border of the
Colchester, Cambridge and Chelmsford/ South Essex alternative full-time
TTWAs11. At present:
• From Braintree, the main commuter destinations are – at district level –
Chelmsford, Uttlesford, Colchester and London, with further outflows to
districts along the M11 Corridor, such as Harlow and East Herts
• Tendring’s main outflow is to Colchester, with relatively small numbers
travelling to other districts, and relatively low levels of London commuting
• Colchester is relatively self-contained, with the main commuter
destinations being the neighbouring districts of Tendring, Braintree and
Chelmsford, as well as some commuting to London. Tendring is the largest
origin of in-bound commuters
In addition to current commuting patterns, expanded economic activity within a
reasonable travel time of the Garden Communities could provide employment
opportunities for Garden Community residents; conversely, new jobs directly
associated with the new Communities will attract employees from a wider area.
Within a 30-minute car journey, quite a wide range of employment destinations
are available to the Garden Communities:
9
TCPA (2012), Creating Garden Cities and Suburbs Today, p.7
10
DCLG (2012), NPPF, para. 37
11
ONS. See
http://ons.maps.arcgis.com/apps/MapSeries/index.html?appid=397ccae5d5c7472e87cf0ca766386cc2
33North Essex Garden Communities Employment & Demographic Studies
Table 3.3 Driving times from North Essex Garden Communities
West of Braintree Colchester Braintree Tendring Colchester
Borders Borders
Under 30 minutes Braintree, Chelmsford, Colchester, Colchester, Harwich
Stansted, Bishop’s Chelmsford, Braintree
Stortford, Colchester
30-60 minutes Harlow, Cambridge, Ipswich, Harwich, Chelmsford, Braintree,
Basildon, Romford Basildon, Romford, Ipswich, Stansted
Southend, Stansted
Source: SQW, AA. Based on approximate points of origin at Blake End (West of Braintree), Marks Tey
and Crockleford Heath (Tendring Colchester Borders).
In addition, from the existing railway station at Marks Tey on the GEML,
Shenfield (for Crossrail) is accessible in just over 30 minutes, Romford in 39
minutes, Stratford in 47 minutes and London Liverpool Street in 59 minutes.
Much of the eastern side of London (including areas of significant planned
employment growth around Stratford) is therefore reasonably accessible, at
least from Colchester Braintree Borders, although the West of Braintree and
Tendring Colchester Borders sites are more distant from stations offering
London connections.
Implication for Given relatively short commuting distances, a number of other centres
the employment (including London) are likely to be of some importance to the NEGCs, even in
scenarios the context of a general desire to limit out-commuting; conversely, new
employment opportunities within the NEGCs may draw from a wider labour
market catchment.
Given the TCPA principles, the employment scenarios set out in Chapter 4 take
into account employment which could reasonably be located within a local bus
journey or MRT ride from the Garden Communities, using the North Essex
district boundaries as proxies for the limits of a short local public transport
journey. This means that (for example) potential employment growth in central
Colchester is local and relevant to the Tendring Colchester Borders and
Colchester Braintree Borders sites. The employment scenarios also take
account of employment that may be generated within the vicinity of the Garden
Communities as a consequence of other developments further afield (for
example, employment that may be located in Braintree as a result of the
expansion of Stansted airport).
Consideration 3: How is the nature of employment likely to change
over time?
The nature of economic activity in North Essex – as elsewhere in the UK – has
changed significantly over recent decades; the local economy (other than the
public sector) is strongly dominated by SMEs within the service sector, despite
the maintenance of a somewhat higher level of industrial activity in Braintree.
Looking to the future, there are three overarching factors linked with the
changing nature of the economy that are relevant in considering future
employment:
• the nature of the economic output that will be generated in the area and
will require labour input. In other words, which economic sectors are likely
to grow or contract, and what will be the drivers of growth
34North Essex Garden Communities Employment & Demographic Studies
• the nature of the labour activity that will take place. Most simply, this relates
to occupation, likely skill level (measured by qualification) and the extent to
which this implies higher or lower value jobs. But it will also mean changes
in the nature of work (for example, from production-related to service-related
in the same sector, from employment to self-employment, or from fixed-
based to flexibly located)
• the way in which firms organise economic activity. Firms increasingly
outsource activity, including innovation and new product development. On
the one hand, increasing decentralisation creates the opportunity for new
business development in locations remote from major company facilities.
On the other, there is increasing demand for opportunities for smaller firms
to work together and collaborate.
Implication for As aspiration for employment associated with the Garden Communities is
the employment expressed in quantitative terms: one job per dwelling. However, jobs may be
scenarios more or less labour-intensive, value adding or susceptible to technological
innovation; at the same time, the existing labour stock (i.e. the skills of the
workforce) will help to drive demand within specific sectors. Employment
scenarios are therefore likely to be qualitatively as well as quantitatively
different; the implications of this for each scenario are explained in Chapter 5.
Consideration 4: How can trend-based projections be balanced with
aspirations for economic development?
The North Essex Garden Communities are intended to be an aspirational
response to meeting housing need. Local partners stressed in consultation the
association between the development of the Garden Communities and the need
to redress the current imbalance between (higher) population growth and
(lower) employment growth, as well as North Essex’s relatively weak
productivity. However, the most likely sources of market-driven employment
growth may not yield the optimum outcome from the perspective of local
stakeholders. This is especially likely to be the case for the Garden
Communities, given that they will be built out over a long period and are – at
least in their early stages of development – likely to offer comparatively lower
cost housing. At the same time, the NPPF requires local plans to be ‘aspirational
but realistic’12.
Implications for The scenarios set out in Chapter 4 therefore reflect both trend-based and
the employment ‘aspirational but realistic’ approaches, recognising that for the latter to be
scenarios realised, a broader range of interventions to support local economic
development will be needed.
Consideration 5: How do the Garden Communities relate to the
wider economic development of North Essex?
The Garden Communities will make a significant contribution to North Essex’s
overall population base – potentially over 96,000 residents once the settlements
are complete. Linked with partners’ aspirations for economic growth,
employment located within the Garden Communities could provide
opportunities for existing residents, including those in areas with currently
limited employment prospects (such as parts of coastal Tendring). This study
does not provide an economic strategy for North Essex; however, the
12
DCLG (2012), NPPF, para. 154
35North Essex Garden Communities Employment & Demographic Studies
employment scenarios (and the aspirations and assumptions that are
associated with them) could help to inform the development of a broader
strategy.
3.2 Introducing the employment scenarios
Taking into account the five considerations above, three broad employment
scenarios have been developed. These have been quantified to 2050 using
Cambridge Econometrics’ Local Economy Forecasting Model, which analyses
employment growth through 45 economic sectors, taking into account
demographic change and historic trends. The details of the three scenarios are
set out in the next Chapter; in summary they are:
• Scenario 1: ‘Business as Usual’ (the baseline trend-based forecast)
• Scenario 2: ‘Business as Usual + A120 improvements’ (a scenario taking
into account the additional employment that may be generated as a result
of the dualling of the A120 between Braintree and Colchester)
• Scenarios 3a and 3b: ‘Potential Unlocked’ (an aspirational scenario taking
into account the potential for further, higher value employment growth)
Defining economic areas for modelling purposes
As set out above, while the Garden Communities are expected to offer a
balance between housing and employment, some employment meeting the ‘one
job per dwelling’ target is expected to be met within a reasonable local journey
time.
Taking into account current travel-to-work patterns and proximity to existing
centres, two ‘economic areas’ have been defined for modelling purposes. With
the agreement of our Steering Group, these are proxied through two local
authority districts (and hence they do not “add up” to the whole of North Essex):
• The West of North Essex economic area includes the West of Braintree
Garden Community and its hinterland. Braintree local authority district has
been used as the spatial proxy and the unit within which the scenarios have
been quantified (broadly reflecting the area accessible within a short public
transport journey from the West of Braintree site). The West of North Essex
economic area has good connections to Stansted, the M11 Corridor and
Cambridge, as well as eastwards to Colchester and south to Chelmsford.
• The Central East of North Essex economic area includes both the
Colchester Braintree Borders and Tendring Colchester Borders Garden
Communities, recognising the close links between both Communities and
Colchester itself. Although the Tendring Colchester Borders site extends
substantially into Tendring (in fact, the majority of the site is in Tendring
district), simply for modelling purposes, Colchester local authority district
(only) has been used as the spatial unit within which the scenarios have
been quantified. This reflects the strong economic association with
Colchester and the relatively weak trend-based employment growth
associated with Tendring. The Central East of North Essex economic area
is primarily focused on Colchester as the primary regional centre, with
connectivity to Chelmsford and London (and northwards to East Anglia) via
the A12 and GEML.
36North Essex Garden Communities Employment & Demographic Studies
Identifying comparator locations
To develop the scenarios, we have reviewed the LEFM economic forecasts for
a number of comparator areas. These areas have been selected using the 2011
census Area Classifications analysis, which clusters local authority districts into
eight ‘supergroups’ with similar socio-economic characteristics, and include a
combination of districts with strong similarities and districts with strengths in
particular sectors which reflect the expressed aspirations of North Essex
stakeholders13. The comparator areas have been used to help identify where
there is stronger (or weaker) anticipated growth in key sectors in similar
locations, to help inform inputs into alternative scenarios for North Essex.
For the West of North Essex economic area, the comparator locations are
primarily smaller towns benefiting from proximity to airports or other transport
infrastructure. For the Central East of North Essex they include cities with
post-Robbins Report universities (such as Kent and Sussex) and with strengths
in tourism-related and creative industries:
Table 3.4: North Essex comparator locations
West of North Essex Economic Area Central East of North Essex Economic Area
Brentwood: Near neighbour, benefits from good Bath and North East Somerset: University city,
transport connections and proximity to London significant knowledge economy and tourism base
Chelmsford: Near neighbour, sharing growth Brighton and Hove: University city, good access
opportunities and sector strengths to London and Gatwick. Rapid expansion of
creative sector and a significant regional centre.
Cherwell: Rapid growth, associated with Canterbury: Rapid recent growth of universities;
expansion of Oxford and South Midlands established tourism/ leisure market
Horsham: Higher value economy, linked with Cheltenham: Major sub-regional retail and
proximity to Gatwick and access to London leisure destination with significant knowledge
economy (and military industrial sector)
Rugby: Strengths in logistics, linked with Winchester: Historic sub-regional centre with
proximity to road and rail infrastructure and good rail access to London
Birmingham airport
Source: SQW.
13
ONS, 2011 Area Classification for Local Authorities. Methodology and spreadsheet available at
www.webarchive.nationalarchives.gov.uk/20160105160709/http://www.ons.gov.uk/ons/guide-
method/geography/products/area-classsifications/ns-area-classifications/ns-2011-area-classifications/about-
the-area-classifications/index.html
37You can also read