Northeastern Regional Assessment of Strategic Electrification - July 2017
←
→
Page content transcription
If your browser does not render page correctly, please read the page content below

Northeastern Regional Assessment of
             Strategic Electrification
                                 July 2017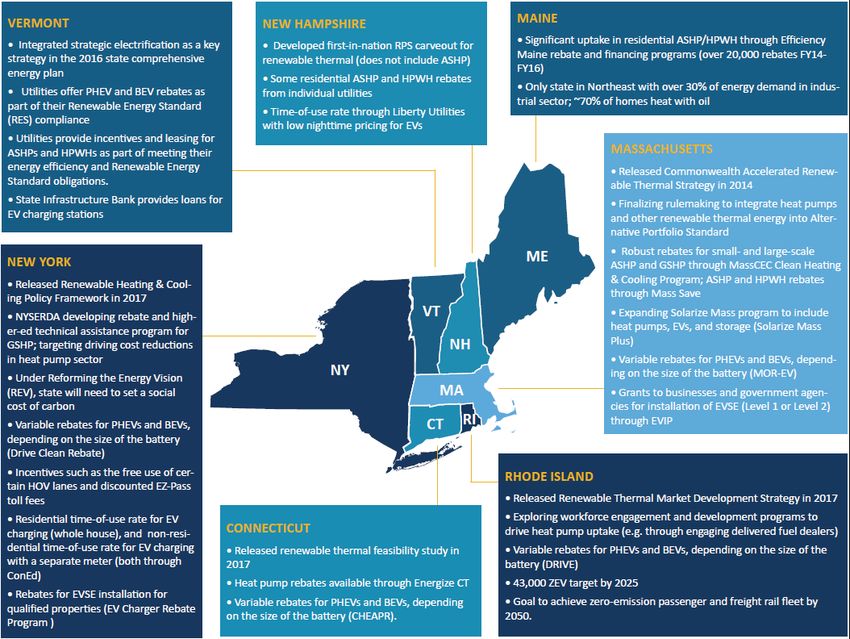
Table of Contents
Executive Summary........................................................................................................................................1
Technology and Market Assessment ...............................................................................................................4
        Buildings.............................................................................................................................................. 6
        Industry ............................................................................................................................................ 17
        Transportation .................................................................................................................................. 23
Policy and Program Options for Expanding Markets ......................................................................................29
        Overview of Strategic Electrification Policies in the Northeast ........................................................ 29
        Regulatory Context ........................................................................................................................... 32
        Targets and Mandates ...................................................................................................................... 35
        Pricing-Based Policies ....................................................................................................................... 38
        Facilitating Emerging Financing and Business Models ..................................................................... 41
        Quality Assurance and Evaluation, Measurement, and Verification ................................................ 44
        Marketing, Outreach, and Education ............................................................................................... 46
Electrification Scenario Analyses ..................................................................................................................48
        Reference Case ................................................................................................................................. 48
        “Max Electric” Scenario .................................................................................................................... 50
        “Plausibly Optimistic” Scenario ........................................................................................................ 52
        Sensitivity Analysis ............................................................................................................................ 54
Grid and Consumer Impacts .........................................................................................................................57
        Electrification and the Grid ............................................................................................................... 58
        Impacts on Consumers ..................................................................................................................... 64
Next Steps ...................................................................................................................................................66
        Near-Term Actions: Develop and Grow Electrification Programs .................................................... 66
        Policy Questions to Study and Resolve............................................................................................. 67
        Research and Data Needs ................................................................................................................. 69
Appendix A: Policy and Program Reference ..................................................................................................72
        Targets and Mandates ...................................................................................................................... 72
        Pricing-Based Policies ....................................................................................................................... 76
        Facilitating Emerging Financing and Business Models ..................................................................... 82
        Quality Assurance and Evaluation, Measurement, and Verification ................................................ 86
        Marketing, Outreach, and Education ............................................................................................... 88

Northeastern Regional Assessment of Strategic Electrification | ii
Policy Discussion: Transportation ..................................................................................................... 90
Appendix B: Highlights of the Literature .......................................................................................................92
       U.S. Deep Decarbonization Pathways Project .................................................................................. 92
       New York Renewable Heating and Cooling Policy Framework ........................................................ 92
       NRECA/RAP Beneficial Electrification ............................................................................................... 93
       Vermont 2016 Comprehensive Energy Plan ..................................................................................... 93
       Northeast EnergyVision 2030 ........................................................................................................... 94
       Zero Emission Vehicle Multi-State Action Plan................................................................................. 94

Acknowledgements
This report reflects the invaluable contributions of multiple individuals.
First and foremost, we recognize Meredith Hatfield, Mariella Puerto and the Barr Foundation for providing NEEP
a grant to undertake this important effort and develop this report.
We recognize the report’s primary authors; Synapse Energy Economics’ Asa S. Hopkins, PhD, Ariel Horowitz,
PhD, Pat Knight, Kenji Takahashi and Tyler Comings and Meister Consulting Group’s Philip Kreycik, Neil Veilleux,
and Jeremy Koo.
Several NEEP staff served key roles in the development of the report including Dave Lis as project manager
(assumed role from Brian Buckley), Sue Coakley as project Director, and Dave Hewitt as special project advisor.
Claire Miziolek provided additional review and input during drafting. Travis Dodge, a graduate student from
Clark University working with NEEP on the project, provided support throughout the development process.
Formatting and edits were provided by NEEP’s Lisa Cascio, Public Relations Manager; and Chris Tanner, Senior
Digital Marketing Associate.
NEEP would like to thank the Strategic Electrification advisory committee members (listed below) for their
invaluable feedback and input. The advisory committee served as a sounding board for NEEP and its consultants
throughout the process of report development, however statements within this report should not be attributed
to specific individuals or organizations on the advisory committee. While the advisory committee is largely
supportive of the report’s contents, listing of the committee members does not necessarily indicate their
concurrence or support for the entire report content or for the analytic methods, assumptions or conclusions
which are the sole responsibility of the authors.

Northeastern Regional Assessment of Strategic Electrification | iii
Advisory Committee Member                                       Organization
              Emily Lewis                             Acadia Center

              J.R. Tolbert                            Advanced Energy Economy

              Meredith Hatfield                       Barr Foundation

              Amy Longsworth                          Boston Green Ribbon Commission

              Peter Fox-Penner                        Boston University

              Ryan Hopping                            Boston University

              Jeff Schlegel                           Consultant

              Tracy Babbidge                          Connecticut Department of Energy and Environmental
                                                      Protection

              Michael Stoddard                        Efficiency Maine

              Kurt Roth                               Fraunhofer Center for Sustainable Energy Systems

              Greggory Wade                           ISO New England

              Eric Johnson                            ISO New England

              Rebecca Tepper                          Massachusetts Attorney General’s Office

              Christopher Walkley                     Massachusetts Department of Energy Resources

              Larry Chretien                          Mass Energy Consumers Alliance

              Eric Dubin                              Mitsubishi

              Rick Nortz                              Mitsubishi

              Jenifer Bosco                           National Consumer Law Center

              Janet Besser                            Northeast Clean Energy Council

              Jamie Dickerson                         Northeast Clean Energy Council

              Arthur Marin                            NESCAUM

              Michael Fitzgerald                      New Hampshire Department of Environmental Services

              Paul Torcellini                         National Renewable Energy Laboratory

              Jon Gordon                              New York State Energy Research and Development Authority

              Janet Joseph                            New York State Energy Research and Development Authority

              Michael Voltz                           PSEG

              Ken Colburn                             Regulatory Assistance Project

              David Farnsworth                        Regulatory Assistance Project

Northeastern Regional Assessment of Strategic Electrification | iv
Danny Musher                            Rhode Island Office of Energy Resources

              Becca Trietch                           Rhode Island Office of Energy Resources

              Barry Coflan                            Schneider Electric

              David Cash                              University of Massachusetts Boston

              Richard Donnelly                        Vermont Energy Investment Corporation

              Sarah Hofmann                           Vermont Public Utility Commission

About NEEP
NEEP was founded more than 20 years ago as a non-profit to accelerate energy efficiency in the Northeast and
Mid-Atlantic states. Today, it is one of six Regional Energy Efficiency Organizations (REEOs) funded, in part by the
U.S. Department of Energy to support state efficiency policies and programs. Our long-term shared goal is to
assist the region to reduce carbon emissions 80% by 2050. For more about our 2017 strategies and projects, see
this 2-page overview or these project briefs. You can also watch this brief video regarding our history.
Disclaimer: NEEP verified the data used for this white paper to the best of our ability. This paper reflects the
opinion and judgments of the NEEP staff and does not necessarily reflect those of NEEP Board members, NEEP
Sponsors, or project participants and funders.
©Northeast Energy Efficiency Partnerships, Inc. 2017

Northeastern Regional Assessment of Strategic Electrification | v
Executive Summary
New York and the New England states have adopted aggressive greenhouse gas (GHG) emission
reduction goals. Deep decarbonization will be required to achieve these goals, and the region has made
substantial progress. Emissions from energy use in these seven states in 2015 was 19 percent less than
2001 emissions. However, there’s still a long way to go: the region’s collective objectives will require
emission reductions of about 80 percent below 2001 levels.
To date, state and market actions that reduce GHG
                                                                            Table 1. Individual state decarbonization targets 1
emissions have focused on the electric supply sector
and on increasing energy efficiency. But even                              Connecticut           80% below 2001 levels by
enhanced energy efficiency and carbon-free electricity                                           2050

can reduce regional emissions by only about 40                             Maine                 75-80% below 2003 levels
percent by 2050—half the amount required. In other                                               in the long term
words, 2050 emissions would still be triple the target
                                                                           Massachusetts         80% below 1990 levels by
level. The remaining emissions result from direct fuel
                                                                                                 2050
use in buildings, transportation, and industry.
                                                                           New Hampshire         80% below 1990 levels by
Consumers in New York and New England use about
                                                                                                 2050
4.2 quadrillion British thermal units (BTU) of fossil fuels
annually for direct end-uses. A small number of end-                       New York              80% below 1990 levels by
uses account for 85 percent of this direct fossil fuel                                           2050
use: space and water heating in residential and
                                                                           Rhode Island          85% below 1990 levels by
commercial buildings; industrial process heat and
                                                                                                 2050
steam; and on-road vehicles.
                                                                           Vermont               75% below 1990 levels by
Reducing emissions 80 percent will require adding a
                                                                                  2050
third strategy: Move end-uses to electricity, and to
other lower carbon fuels where electrification is not practical. Electric technologies with the potential to
displace, and eventually replace, direct fossil fuel use are available now in the market, although at
varying levels of maturity.
This report examines electrification in detail. We show how electrification can work with efficiency and
clean electric supply to drive deep decarbonization.
Importantly, emissions reduction goes hand in hand with other goals that factor into decision-making.
State governments and other stakeholders are also pursuing objectives such as economic development,
new business opportunities, energy security, resiliency to natural or other disasters, consumer savings,
and reduction of trade deficits from the import of fossil fuels produced elsewhere.

1   Sourced from the Center for Climate and Energy Solutions, “Greenhouse Gas Emission Targets” at www.c2es.org/us-states-
    regions/policy-maps/emissions-targets. Note that state targets are not for energy only, and include emissions from waste,
    chemicals, agriculture, etc. This report addresses only energy-related emissions, and assumes the same targets would apply to
    energy emissions alone.

Northeastern Regional Assessment of Strategic Electrification | 1
Figure 1: Direct fossil fuel use divided by end use and sector in New York and New England. The region uses about 4.2 quadrillion
BTUs of direct fossil fuel energy each year.
Source: U.S. Energy Information Administration
Meeting these objectives while also achieving GHG emission reductions will require careful planning and
informed decision-making about how, when, and if end-uses are moved to electricity, as well as how the
electric grid evolves and develops to meet new demands. What is required is not simply electrification, it
is strategic electrification.
Strategic electrification means powering end-uses with electricity instead of fossil fuels
in a way that increases energy efficiency and reduces pollution, while lowering costs to
customers and society, as part of an integrated approach to deep decarbonization.
Different stakeholders will play different roles in electrification and decarbonization. They will develop
and define their own definitions and approaches to strategic electrification. State officials, including
both policy and regulatory leaders, have a key role to play in coordinating the actions of these diverse
stakeholders.
Northeastern states are already taking actions that encourage electrification, including encouraging
adoption of electric vehicles and recognizing the thermal renewable value of heat pumps as part of
Northeastern Regional Assessment of Strategic Electrification | 2renewable portfolio standard policies. Stakeholders as diverse as electric utilities, equipment suppliers,
environmental and clean energy advocates, and auto manufacturers are actively engaged in exploring
pieces of this transformation.
Figure 2. Strategic electrification in the context of decarbonization
The purpose of this report is to inform the development of regional activities, including a regional action
plan. It provides a resource to stakeholders across the region as they develop electrification strategies
that allows them to base their planning on qualitative and quantitative analysis. Section 0 assesses the
current state of technology and markets for the potentially electrifying end-uses that correspond to the
vast majority of regional fossil fuel use. Section 0 examines the policy landscape: what states are already
doing, and what options are in front of them to foster these developing technologies. Section 0 presents
the results of scenario analysis, showing the emissions reductions possible with and without
electrification and identifying the pace of market deployment of new electric technologies necessary to
reduce emissions 80 percent from 2001 levels by 2050. These scenarios show substantial increases in
electric demand: Section 0 discusses the most significant impacts of that increase on the electric grid
and on electric consumers. The report concludes in Section 0 with a discussion of near-term actions and
policy questions for stakeholder discussion in the next five years.
Northeastern Regional Assessment of Strategic Electrification | 3Technology and Market Assessment
This section describes the end-use technologies that are considered in this study. For each technology or
end-use application, this includes a description of the technology and its current level of deployment in
the marketplace or sector. It also describes the impact that market barriers have historically had on
deployment of these technologies. See the box below for a description of barriers that typically impact
new technology deployment and market development.
Building on this assessment, each subsection includes a qualitative description of the potential for each
technology to scale over time. This assessment informs the scenario analysis found in Section 4.
The end-uses addressed in this report are space and water heat in residential and commercial buildings;
process heat and steam; 2 and on-road vehicles. Together, these end-uses account for 85 percent of the
direct fossil fuel use in New York and New England. Figure 1 illustrates the breakdown across all direct
regional fossil fuel use, showing the dominance of these end-uses. (Indirect fossil fuel use resulting from
the use of electricity is not reflected here, and is not the subject of these analyses.)
2 This assessment addresses process heat and steam only in applications outside of combined heat and power (CHP) and the
paper industry. The “process” wedge of Figure 1 includes only assessed end-uses.
Northeastern Regional Assessment of Strategic Electrification | 4Overview of Typical Market Barriers for Strategic Electrification Economic barriers. Economic barriers broadly fall into two main categories: (1) high upfront costs of replacement technologies relative to conventional technologies, and (2) slow accrual of savings due to low fossil fuel prices. Taken together these barriers create an inadequate return on investment for displacing conventional systems with electric options. Social/institutional barriers. Social barriers primarily relate to customers’ lack of awareness 3 and inertia. 4 Institutional barriers act more at the organizational and societal levels, at which adoption can be limited or even disincentivized depending on economic arrangements, institutional priorities, or utility business models. A classic institutional barrier is the split incentive problem faced by landlords and tenants, whereby the benefits of an energy saving initiative accrue to a different party than the one that has control over the investment that generates those savings. Another example is least-cost procurement requirements that governments may impose on themselves. Technical/infrastructure barriers. Technical and infrastructure barriers limit the suitability of electric technologies for deployment in wide ranges of applications. Examples include insufficient electric vehicle charging infrastructure, limited cost-effective options for heavy duty electric vehicles, limitations to the installation of ground-source heat pumps (GSHPs) in some urban areas, and limitations to the ability of air-source heat pumps (ASHPs) to reliably fulfill whole-home heating needs in cold regions. Policy/regulatory barriers. Regulatory barriers limit the ways funds can be applied and programs can be designed. The most important example is the way in which utility energy efficiency programs are set up. Regulatory barriers inhibit the formation of effective policy and are discussed in depth in Section 3.2. Each of these barriers plays out differently across the technologies and across the sectors. Specific barriers and policies designed to address them are described in greater detail in Section 3. 3 In the Northeast, overall awareness of heat pumps is quite low, according to a recent study by MacWilliams Sanders Communication and Meister Consultants Group. Consumers that do know about heat pumps frequently remember poorly performing models in the 1970’s and 80’s, or consider high costs and reliability issues of electric resistance heat. While awareness of electric vehicles is more common, some consumers remain concerned about range and performance. 4 Customers may be unwilling to learn new energy management habits that heat pumps require, and may be unwilling to change their expectations for refueling infrastructure in the case of EVs. Northeastern Regional Assessment of Strategic Electrification | 5
Buildings
Across the region, energy consumption in buildings for thermal energy and HVAC applications account
for roughly one third of all energy consumption and energy-related GHG emissions. 5 In particular, the
Northeast is highly dependent on fossil fuels for space heating applications, with natural gas and
delivered petroleum fuels (i.e. oil and propane) accounting for the vast majority of thermal energy
consumption. 6 Achieving deep decarbonization goals across the region will require reducing thermal
energy emissions in buildings through a combination of thermal load reduction (i.e. energy efficiency
and weatherization) and replacement of fossil fuel equipment with heat pumps and/or other renewable
heating and cooling technologies.
Strategic electrification with regards to the buildings sector focuses on the displacement and
replacement of fossil fuel equipment used for space heating/cooling and domestic hot water with heat
pump technologies that operate at significantly higher efficiencies than existing electric technologies in
all climate zones of the Northeast. Notably, building space cooling and some space heating systems are
already electrified, as are other HVAC applications (e.g. ventilation). Current heat pumps can provide
higher efficiency cooling than other existing technologies and have seen robust support from utilities for
summer peak load reduction. 7 Other HVAC applications have similarly been targeted by some utility
efficiency programs (e.g. through commercial/industrial custom measure programs), though are largely
not the focus of this report.
This section provides a market and technology assessment of electric replacement technologies in the
buildings sector, divided into three subsections by application: (i) residential space heating and cooling;
(ii) commercial space heating and cooling; 8 and (iii) water heating.

Residential Space Heating and Cooling
Residential space heating is dominated by fossil fuels, with gas and delivered fuels serving as the primary
heating fuel for over 80 percent of one- to four-family homes across the region, as shown in Figure 3.
Gas penetration is highest in densely populated areas, serving over half of homes in New York,
Massachusetts, and Rhode Island, though gas access across the region is steadily increasing. Delivered
fuels (i.e. oil and propane) account for the majority or plurality of homes in the more rural northern
forest states. Wood heating is also common in many households in these states, with many homes using

5 Estimates vary depending on the state as well as on the scope of building-related energy consumption included in estimates:
  for example, Rhode Island estimates approximately 35 percent of energy-related GHG emissions are related to thermal
  energy (RI Division of Planning, 2015. Energy 2035: Rhode Island State Energy Plan), while New York estimates that 32 percent
  of energy-related GHG emissions are related to building HVAC systems (which include thermal energy) (NYSERDA (2017)
  RH&C Policy Framework) and Massachusetts estimates 36 percent of energy-related GHG emissions are related to non-
  electricity building energy consumption (MA DEP 2016, 2014 GHG inventory).
6 U.S. EIA Residential Energy Consumption Survey

7 Most utilities and utility efficiency programs in CT, MA, NY, and RI (the warmer Northeastern states) provide rebates for high-

  efficiency cooling at the residential sector: Mass Save, EnergizeCT, National Grid (RI/NY), ConEd, and others offer residential
  rebates for heat pumps, primarily based on their ability to reduce cooling energy consumption and demand.
8 Space heating and cooling technologies and markets for the industrial sector are similar to those in the commercial sector and

  are included in this subsection. Industrial process heating applications (e.g. steam, direct heat) are discussed in Section 2.2.

Northeastern Regional Assessment of Strategic Electrification | 6
a mix of delivered fuels and wood heating (e.g. central oil heating with pellet stove for supplemental
heating).
Additionally, while over 70 percent of homes in the United States have forced-air distribution (including
electric heat pumps, the majority of which are central heat pumps using forced-air distribution) only
about 54 percent of homes in the Northeast have forced-air distribution systems. 9

                     Figure 3: Primary heating fuels in one- to four-family homes in the Northeast and by state

                                   Source: American Community Survey 2015, 5-year estimates

Residential space cooling is provided by a mix of central and window AC units. Due to relatively mild
summers, approximately half of homes use window AC units and a large number of homes across the
region lack AC entirely (nearly one quarter of homes in New England). 10

Potential electrification technologies in the residential sector include air-source heat pumps and ground-
source heat pumps.
       •    Air-source heat pumps (ASHPs), which use an electric-powered vapor compression
            cycle to transfer heat in and out of buildings, using ambient thermal energy in the air as
            a reservoir. A wide range of ASHP systems are available, ranging from single-head
            ductless to multi-head ductless and ducted to central ducted systems. As discussed
            further below, the variety of applications provide flexibility for replacing or displacing
            heating systems across the diverse housing stock of the Northeast.

9   U.S. EIA Residential Energy Consumption Survey (RECS) 2015 – Table HC6.7 (includes NJ/PA)
10   RECS 2015 – Table HC7.7 (includes NJ/PA)

Northeastern Regional Assessment of Strategic Electrification | 7
• Ground-source heat pumps (GSHPs), use a vapor compression cycle similar to ASHPs
but use the ground (or groundwater) as a heat reservoir, which can offer higher
efficiencies at low or high outdoor air temperatures due to the more consistent
temperature of the earth year-round. GSHP can also provide domestic hot water
through desuperheaters.
The status of these technologies and the market penetration and growth are described in Table 2 and
Table 3 respectively:
Table 2: Technology status for residential sector building electrification technologies
Air-source heat pumps Ground-source heat pumps
Until recently, ASHPs had not achieved optimal cold GSHPs are an established technology with a variety of
climate performance. In recent years, the technology different options for the ground loop (e.g. closed
has advanced and new models perform at high loop, open loop, direct exchange) and wells (e.g.
efficiency at 5°F. They can extract useful heat from horizontal, vertical, standing column). Ground loops
ambient air down to -15°F. For more information, see can also be placed within nearby bodies of water at
NEEP’s ccASHP specification. 11 significantly lower cost due to lack of drilling.
While most ASHPs installed in the United States are
“air-to-air” systems, “air-to-water” systems designed
for integration into hydronic distribution systems are
popular in Asian and European markets. These
systems will perform most efficiently at low hydronic
supply water temperatures (e.g. 120°F), which may
limit retrofit applications in existing buildings. 12
11 http://www.neep.org/initiatives/high-efficiency-products/emerging-technologies/ashp/cold-climate-air-source-heat-pump
12 https://blog.heatspring.com/low-ambient-air-water-heat-pumps/
http://www.greenbuildingadvisor.com/articles/dept/musings/air-water-heat-pumps
Northeastern Regional Assessment of Strategic Electrification | 8Table 3: Market status for residential sector building electrification technologies
Air-source heat pumps Ground-source heat pumps
ASHP systems that have been installed across the The GSHP market is nascent, with a relatively small
region are primarily 1-2 single-head systems for number of installations at the residential level
supplemental heating/cooling, while (near) whole- accounting forcycle. With the more recent growth in ccASHP installations, it is unclear what customers who have installed heat pumps for supplemental heating will use to replace primary heating systems (given limitations in heat pump ability to serve whole-home heating load in the majority of residential buildings without significant weatherization work and/or improvements in cold climate performance). In addition to slow turnover, heat pumps face other barriers to adoption. Upfront cost is still a significant barrier. While heat pumps can offer energy savings against oil, propane, and electric resistance, timelines for achieving payback can be lengthy depending on the cost of the fuels displaced. 20 Moreover, heat pumps are not cost-competitive against natural gas in retrofit applications due to the relatively low cost of gas and high cost of electricity across the region. For new construction, the economics of heat pumps can be favorable even against natural gas. Performance is another barrier. While ASHP cold climate performance has improved, there is still a significant reduction in heating capacity below 0°F (and these systems shut down below -15°F). Therefore, most systems are not able to effectively serve whole-home heating loads in much of the Northeast without a backup system, with the exception of “tight” homes. There are also concerns about GSHP performance in residential installations, given the need for super high-efficiency performance to offset the significantly higher upfront cost of GSHP. A 2016 field study of 37 homes in Minnesota found that while median heating and cooling efficiencies were comparable to expectations, there was wide variability in performance. 21 Home suitability is another barrier, particularly for GSHP. The need for drilling/excavation limits uptake in retrofit applications, particularly in urban areas where available land area can be limited and permitting processes can be more challenging. Future developments hold great promise in the residential heating and cooling sector. On the ASHP side, cold climate performance and efficiency have improved markedly in recent years, and manufacturers expect to continue working towards improved efficiencies and heating output at low temperatures. This will enable ASHPs to more effectively serve whole-home heating loads in a larger share of buildings without relying on backups. The growth of ductless systems will also provide more flexibility in non-forced air homes, and newer multi-head ductless systems provide a greater range of options for displacing a larger share of home heating and cooling loads. Central ducted systems may also play a larger role in the future (either to supplement or replace existing systems) due to the fact that most homes in the Northeast use forced air distribution. 22 Overall, we should see substantial market growth as customer awareness of the suitability of ASHP for a wider range of applications and the improving performance of cold climate systems increases. On the GSHP side, growing the market will help achieve economies of scale. While new GSHP technologies and designs (e.g. co-axial or twister loops, use of underground thermal energy storage, integration of solar thermal) are being tested, these alternatives are not yet cost-effective and have not 20 NYSERDA (2017) RH&C Policy Framework; Gronli et al. (2017) Feasibility of Renewable Thermal Technologies in Connecticut 21 http://mn.gov/commerce-stat/pdfs/card-residential-gound-source-heat-pump-study.pdf 22 Cadmus DMSHP Report (2016) Northeastern Regional Assessment of Strategic Electrification | 10
seen broader uptake across the industry. 23 With support from state policymakers (e.g. the New York
State Energy Research and Development Authority), industry may focus on driving cost reductions
through the value chain primarily related to non-equipment costs—potentially in looking at drilling and
other non-equipment costs. 24 GSHP market growth will likely be higher in regions that are experiencing
a higher rate of new construction, due to the fact that the capital cost is lower in new construction than
in the retrofit market.
For the most difficult applications to electrify, fossil-fuel alternatives to heat pumps are available,
though these technologies also face barriers. Wood pellet boilers or furnaces are central systems that
can fully replace conventional boilers and furnaces (as opposed to more common wood stoves across
the region). Uptake of these systems has been limited by high upfront costs and high fuel costs that limit
cost-competitiveness against other fuels. Moreover, pellet fuels are less available in states like
Connecticut and Rhode Island which have limited or no in-state production. Solar thermal (air heating)
can provide supplemental space heating, though is less commercially viable at the residential level and
faces challenges related to diminishing capacity during periods of highest demand. Biodiesel can be
blended into heating oil on a near 1:1 replacement to reduce emissions. There are some challenges
associated with increasing biodiesel blends in heating oil. These include equipment limitations on higher
blends (B5+) and challenges with the higher gel point of biodiesel relative to heating oil, which can clog
filters, pumps, tanks, and other equipment and limit applicability in colder Northeastern states. 25

Commercial Space Heating and Cooling
Commercial space heating is similarly dominated by fossil fuels, with large commercial buildings
primarily gas heated and small commercial buildings more reliant on delivered fuels and electricity.
Commercial buildings (esp. larger buildings) often have multiple systems serving heating and cooling
loads (e.g. water source heat pump plus boiler and cooling tower). Space cooling is common across most
commercial buildings for occupant comfort.

23 GSHP industry engagement interviews and workshops completed through the NYSERDA RH&C Cost and Cost Reductions
    Advisory Committee (2016).
24 NYSERDA (2017) RH&C Policy Framework.

25 http://www.energy.ri.gov/documents/Efficiency/Rhode%20Island%20Renewable%20Thermal%20Market%20

    Development%20Strategy%20January%202017.pdf

Northeastern Regional Assessment of Strategic Electrification | 11
Table 4: Prevalence of each fuel among commercial buildings in the Mid-Atlantic and New England regions
% of total buildings % of commercial square footage
Natural Gas 50% 56%
Fuel Oil 19% 13%
Electricity 19% 15%
Other (propane, wood, district 12% 17%
heating, etc.)
Numbers may not sum to 100 percent due to rounding. Source: U.S. EIA, 2012 Commercial Buildings Energy Survey
Potential electrification technologies in the commercial sector are similar to the technologies in the
residential sector, though variable refrigerant flow (VRF) technologies are also an option for larger
commercial buildings. Table 5 describes the market status for each of the technologies listed below.
• ASHP technologies used in the residential sector can be a good fit for small commercial
buildings, which often have similarly-sized conditioned spaces to residential buildings.
Given the similarities in market and technology status, discussion in this section will
focus on large commercial ASHP applications, for which large-scale variable refrigerant
flow technologies are more suitable.
• Variable refrigerant flow describes a similar technology to ASHP (using refrigerant and
vapor compression to extract and reject heat from surrounding air), though sized for
larger commercial heating and cooling loads. VRF systems run at varying speeds to
provide zoned heating and cooling to different parts of a commercial building.
• GSHP technologies used in the commercial sector are similar to those in the residential
sector, but on a larger scale and requiring more wells for the increased heating and
cooling load.
Northeastern Regional Assessment of Strategic Electrification | 12Table 5: Market status for commercial sector building electrification technologies
Air-source heat pumps Variable refrigerant flow systems Ground-source heat pumps
Limited uptake, but Vermont and VRF is an emerging technology in the GSHP market is small for
Maine programs are leading to the Northeast. Some VRF systems can commercial buildings, at ~1-
installation of ductless minisplits by enable different zones to heat and cool 2 percent of market.
small businesses. simultaneously. Similar to ASHP, recent Installation costs are notably
advances have aimed to improve cold lower on a per-ton basis
climate performance. relative to residential due to
economies of scale (e.g.
installation and drilling labor,
The U.S. VRF market is similarly technology costs). 28 Unlike
nascent, with the technology residential systems,
introduced to the market in 2003. 26 commercial scale GSHP
VRF technology is commonplace in systems can still receive a 10
Asian markets, accounting for percent business investment
approximately 50 percent of tax credit. 29
small/medium commercial buildings
and nearly 30 percent of large
commercial buildings in Japan. 27
Potential for market scale
Similar to the residential sector, heat pump adoption is limited by slow replacement of technologies,
with an annual replacement rate of 50 percent of square footage and ~44 percent of
buildings are at least partially rented). 30 And the decision-makers who purchase energy systems for
commercial buildings may be less directly involved with the operation of the heating and cooling
systems beyond providing the necessary comfort to occupants.
26 Mitsubishi Electric. (2016). Advanced Heating Technology: Applying VRF in Cold Climates (White Paper).
27 http://www.asiagreenbuildings.com/7809/development-market-penetration-vrf-systems-asia/
28 NYSERDA (2017) RH&C Policy Framework
29 http://programs.dsireusa.org/system/program/detail/658
30 Commercial Buildings Energy Consumption Survey (2012) https://www.eia.gov/consumption/commercial/data/2012/
Northeastern Regional Assessment of Strategic Electrification | 13Future developments may gradually overcome these barriers. As noted above in the discussion of residential heating and cooling, the steady improvement of technology will help expand the number of sites suitable for electrification of heating. The discussion of improved cold climate performance is equally relevant to the commercial sector, and the growth of economies of scale in these nascent industries will benefit ASHP and GSHP purchasers in all building sectors. Notably, some higher education institutions are beginning to invest more in geothermal to achieve campus energy goals, and NYSERDA in particular is developing a program to drive GSHP adoption in higher education. While most GSHP systems are installed in individual buildings, GSHP can also be installed at a district scale, providing thermal energy to multiple campus buildings using the same loop field. For instance, Ball State University is in the process of drilling 3,600 wells to replace boilers in 47 buildings. 31 This can yield many benefits and cost efficiencies when properly designed. Higher education institutions and developers of office parks may be good candidates for this type of district installation, particularly in new construction. Public buildings subject to “Lead by Example”-type policies may also help drive accelerated deployment of commercial-scale heat pumps, which could have a significant impact given that 20-25 percent of commercial building square footage is government-owned. 32 There will be buildings that are difficult to electrify in the commercial sector. The non-electric fossil-fuel alternatives that were discussed in the context of residential buildings are also available in the commercial sector. In particular, biomass thermal boilers using wood pellets or chips are more common at the commercial level, with a relatively higher number of wood pellet/chip installations in schools in Northern forest states. Likewise, solar thermal (air heating) can provide space heating and is more viable at the commercial scale than the residential scale. Finally, biodiesel blending into heating oil is an option, as discussed above. Water Heating Water heating is similarly dominated by fossil fuels. Most buildings with access to gas heating using gas for both space heating and hot water heating. There is a significantly greater share of electric resistance water heating, particularly in homes served by delivered fuels, due to the relatively low upfront cost of electric water heaters. 31 http://cms.bsu.edu/about/geothermal 32 Commercial Buildings Energy Consumption Survey (2012) https://www.eia.gov/consumption/commercial/data/2012/ Northeastern Regional Assessment of Strategic Electrification | 14
Table 6: Prevalence of each water heating fuel among residential buildings in the Mid-Atlantic and New England regions

                                           % of total buildings in            New England             Mid-Atlantic
                                             Northeast Region
       Natural Gas                                    50%                          38%                     57%

       Electricity                                    19%                          36%                     29%

       Fuel Oil/Kerosene                              19%                          20%                      9%

       Propane                                        12%                           7%                     34%

       Other                                           1%                                                   1%

        Numbers may not sum to 100 percent due to rounding. Source: U.S. EIA, 2015 Residential Building Energy Survey

The primary potential electrification technology for water heating is heat pump water heaters (HPWHs).
HPWHs use an electric-powered vapor compression cycle to heat hot water using heat from the ambient
air. HPWHs are generally designed as hot water storage tanks with heat pump elements attached to the
top. HPWHs can operate at efficiencies of 2-3 times that of electric resistance water heaters, though
HPWHs will draw heat from the surrounding air, which can result in heat loss (and an increase in space
heating demand unless it is placed outdoors).
HPWHs are an emerging technology in the Northeast, with a small number of manufacturers accounting
for a significant share of the market. Some HPWHs are installed with backup electric resistance elements
to enhance recovery during periods of high usage, while others use only heat pump elements to provide
heating. As an emerging technology, the HPWH market is nascent but growing in the Northeast. It is
supported by utility rebates in most states due to load reduction benefits over electric resistance.
HPWHs account for 1 percent of all water heaters sold. 33
Notably, in 2010 the U.S. Department of Energy passed new regulations that required that all electric
storage water heaters of over 55 gallons achieve a rated energy factor of 2.0, which would have
required usage of HPWH for larger water heaters after April 2015. 34 However, as water heaters under 55
gallons were not affected by this rule, HPWH sales have been lower than expected. The low sales drove
GE to cease production of its HPWH despite having recently built a new manufacturing plant in
anticipation of increased uptake following passage of the rule. 35 Future rulemaking may phase out
electric resistance water heaters entirely. But it is likely that until then, customers pursuing the lowest
upfront cost replacement option will continue to use smaller electric resistance water heaters.

33 Energy Star Unit Shipment and Market Penetration Report: Calendar Year 2015 Summary,
    https://www.energystar.gov/ia/partners/downloads/unit_shipment_data/2015_USD_Summary_Report.pdf
34 U.S. Department of Energy (2010). 10 CFR Part 430: Energy Conservation Program: Energy Conservation Standards for

    Residential Water Heaters, Direct Heating Equipment, and Pool Heaters (Final Rule)
    https://www.regulations.gov/document?D=EERE-2006-STD-0129-0005
35 Interview w/ Gregg Holladay

Northeastern Regional Assessment of Strategic Electrification | 15
Potential for market scale
Just as in the case of building heating systems, HPWH technologies are somewhat limited by turnover of
existing water heating systems. Among the approximately 10.5 million one- to four-family homes in the
Northeast, the annual replacement rate of domestic hot water systems is less than 10 percent.
Additional barriers to adoption include upfront cost, lack of building suitability, and lack of planning for
replacement prior to equipment failure. While HPWHs can offer significant energy savings against
electric resistance and delivered fuel water heaters, they are not cost-competitive against gas in the
Northeast due to high electricity prices and low gas prices. Not all buildings are suitable for HPWHs.
HPWHs must be placed in a large, high-ceiling room to ensure sufficient air-flow to maintain
performance and efficiency. 36 Sufficient ambient air temperature is also necessary to maintain
efficiency, and HPWHs should ideally be placed in unconditioned basements (as placement in
conditioned spaces will cause greater space heating loss). 37 Larger-scale HPWHs are not yet available on
the market, and placing a large number of HPWHs in one space can significantly affect space heating.
HPWHs are also noisier than other water heaters. Finally, over 80 percent of water heater replacements
in the United States are due to emergency replacement (e.g. failure or in need of servicing). 38 Customers
in need of an emergency replacement typically lack the time to conduct research about energy savings
and available rebates, and thus customers shopping for a new water heater often lack awareness of
HPWHs as a cost-effective alternative to electric resistance water heaters.
A number of future developments could positively affect the potential for HPWHs to contribute
significantly to strategic electrification. Rebate programs are beginning to be applied upstream rather
than as a mail-in program, which can have a tremendous impact on the number of installations. 39
Modifications to HPWH rebate structures (including upstream rebates to distributors that require them
to have HPWHs in stock), as well as greater emphasis on marketing HPWHs as cost-effective energy
efficiency measures to electric water heating customers could result in significantly greater uptake
across the region. Manufacturers are also aiming to improve the efficiency and recovery rate of HPWHs
to make them more cost-competitive against natural gas. Some recent models of HPWHs are rated with
energy factors of over 3.0; models with even higher coefficients of performance (COP) are available in
Japan.
There will remain some water heating applications that are not suitable for HPWHs. Fossil-fuel
alternatives are available for providing water heating, both as standalone technologies and as
attachments to heat pump and other primary heating systems. Solar hot water (SHW) systems are a
well-established technology that can provide 60-80 percent of a home’s domestic hot water load
depending on placement and insolation. SHW systems require a backup system when solar insolation
36 https://www1.eere.energy.gov/buildings/publications/pdfs/building_america/measure_guide_hpwh.pdf
37 Ibid.
38 https://www.energystar.gov/sites/default/files/asset/document/1_Francois%20LeBrasseur_Early%20and%20Often
_FINAL.pdf
39 EnergizeCT changed its HPWH rebate program from a mail-in rebate program to an upstream rebate applied at point of sale
in 2014. This resulted in an over 600% increase in installations from 2013 to 2014.
https://www.energystar.gov/sites/default/files/asset/document/3_Jennifer%20Parsons_Early%20and%20Often_FINAL.pdf
Northeastern Regional Assessment of Strategic Electrification | 16drops in winter months. The freeze protection requirements for systems in the Northeast result in higher upfront and maintenance costs for systems. Additionally, desuperheaters can be added to GSHP systems to use waste heat from the compression cycle to heat domestic hot water through a secondary heat exchanger. Desuperheaters provide auxiliary heat to an existing hot water system and typically cannot produce enough heat alone during non-cooling seasons. For buildings using biomass heating, indirect fired water heaters can be added to biomass heating systems to provide domestic hot water in addition to space heating. Finally, just as in the space heating sector, biodiesel can be blended into heating oil. Industry Electrification Opportunities in Industry The industrial sector includes a diverse range of business models and technologies. Traditional heavy industry, such as manufacturing of glass, steel, and concrete, fall into this category along with relatively small-scale, value-added processes such as preparation of specialty foodstuffs. The assessment conducted in this report explores electrification opportunities in four particular industries: manufacturing of food; chemicals; non-metallic minerals (glass and cement); and primary metals (iron and steel, aluminum, and other metals). These industries were chosen based on two criteria. First, they represent large portions of industrial fuel consumption in the Northeast (Table 7). Second, fuel use in these industries is independent of byproducts of the industries themselves. Much direct use of fossil fuels in industry is difficult to electrify because the fuel is burned along with an industrial byproduct. For example, the paper industry burns large amounts of a waste product called “black liquor” that is produced during papermaking. However, natural gas is often blended into the combustion mix to improve the properties of the fuel or to ensure an easily-controllable level of combustion. Electrifying this use of natural gas and similar “co-firing” uses of fossil fuels would require either fundamental changes to the industrial processes in question or creation of a new (and potentially costly) waste stream. As such, these industries were judged to have low potential for electrification. Northeastern Regional Assessment of Strategic Electrification | 17
Table 7. Fuel use by industry in the Northeast Census Division

                         Industry                Percent of Fossil               Selected for Further Analysis?
                                                    Fuel Usea
           Primary Metals                                26%                                     Yes

           Paper                                         15%                No; fuel is co-fired with process byproduct

           Chemicals                                     14%                                     Yes

           Petroleum and Coal Products                   11%                No; fuel is co-fired with process byproduct

           Nonmetallic Mineral Productsb                  9%                                     Yes

           Food                                           9%                                     Yes

           All Othersc                                   14%               No; impractical due to diversity of processes
a Fossil   fuels defined as oil, natural gas, and coal; data from the 2010 Manufacturing Energy Consumption Survey (MECS), Table
3.2

b   This industry includes both concrete and glass production

c   “All Others” comprises an additional 15 industries as classified by NAICS codes

The direct uses of fossil fuels in industry are as diverse as the industries themselves. The Energy
Information Administration (EIA) measures 11 separate “end-uses” of fuel in the industrial sector, 40
ranging from onsite transportation of raw, semi-finished, and finished materials to combined heat-and-
power generation. The dominant end-use in terms of fuel consumption can also vary widely by industry.
In general, end-uses can be separated into “process” and “non-process” applications. “Process”
applications are those uses of fuel which directly power the core activity of the industry itself. For
example, melting silica (sand) to produce glass is one of the key steps of the glassmaking process. “Non-
process” uses are those which support the core activity but are not in and of themselves part of it. The
truck that transports sand from a receiving dock to a glassmaking furnace is employed in a non-process
use and the diesel with which that truck is fueled would be considered part of non-process fuel use. The
industrial component of this assessment considers only process-related uses of fuel, because
electrification of non-process uses (including transportation and space heating and cooling) is similar in
the industrial sector to corresponding shifts in the commercial and residential sectors.
This assessment concentrates on two particular process uses: direct use of fuels to generate dry heat,
and use of fuels in boilers to generate steam (which can be considered “wet heat”). Many non-heat-
related process uses are essentially impossible to electrify 41—and, moreover, constitute a very minor
component of industrial fuel use. Process heating and steam generation are, quite simply, the dominant
forms of industrial fuel usage. Nationally, these end-uses account for 86 percent of industrial

40   2010 MECS, Table 5.2.
41   For example, fossil fuels and their derivatives (including methane from natural gas and alcohol distilled from petroleum) are
      used as a direct feedstock in chemical synthesis processes. For these uses, biofuels may be a suitable replacement.

Northeastern Regional Assessment of Strategic Electrification | 18
consumption of fossil fuels. 42 The percentage is somewhat less in the Northeast, where combined-heat- and-power is more common. Nonetheless, no other end-use approaches the importance of process heating and steam generation. Conversion of only one-fifth of the fuel used for heat and steam to electricity would be equivalent to electrifying the entirety of every other industrial use of fossil fuel. As such, while it may be possible to electrify certain other process uses, the most strategic electrification opportunities focus on heat and steam. Electrification of Process Heating Direct process heating accounts for the majority of fuel use in both the non-metallic mineral and primary metal industries. Process heating represents at least 78 percent of fuel use in the former and 80 to 90 percent of fuel use in the latter. 43 In sum, process heating in these industries accounts for approximately 50 TBTU/year of the 54 TBTU/year total fuel consumption by the mineral and metal industries. This equates to around 14 percent of total industrial use of natural gas, coal, and oil in the Northeast, resulting in annual emissions of over 3.4 million metric tons of carbon dioxide (CO2). Much of this fuel usage can be electrified by focusing on commercially available technologies in two key applications: glassmaking and production of iron, steel, and other metal products. Based on the mass and value of product produced in each industry, these particular applications are likely the dominant fuel users within their respective industries in the Northeast. 44 For both applications, the bulk of the region’s fuel use and industrial activity is centered in New York. New York State alone represents over half of the glass, iron, and steel value produced in the Northeast region. For both glassmaking and steel production, the primary electrification technology is electric furnaces. In both applications, heat is applied to a raw material to transform it into a semi-finished process. In glassmaking, furnaces are used to melt raw silica feedstocks and anneal (or harden) the newly formed glass. In steelmaking, furnaces are used to both melt iron and to chemically convert it into steel. Different electric furnace types are required for each application. Electric steelmaking (and processing of other metals) relies on arc furnaces, which run electric current through the metal stock that is to be melted (Figure 4). The electric current also allows the necessary chemical reactions to occur that transform iron into steel. Electric arc furnace technology is mature and has gained wide market share in the United States. Nationally, electric arc furnaces have represented over half of all steel production on a per-ton basis since the early 2000s and have accounted for over 60 percent of all steel production since 2009. 45 In the Northeast, electricity represents approximately a fifth of the total energy usage in iron and steel production. 46 However, because electric arc furnaces are more thermally efficient than traditional fossil-fired blast furnaces, this value suggests that electric technologies have become a major part of the iron and steel industry in the Northeast. Little further development is required to advance 42 2010 MECS, Table 5.2. 43 2010 MECS, Table 5.2. Range due to fuel use for which end use was not reported. 44 U.S. Census Bureau, 2012 Commodity Flow Survey. 45 http://usa.arcelormittal.com/sustainability/our-business/the-steel-industry/industry-statistics 46 2010 MECS, Table 3.2. Northeastern Regional Assessment of Strategic Electrification | 19
You can also read