Norwegian Air Shuttle ASA - Investor Presentation January 2020

Page created by Terrence Garner
 
CONTINUE READING
Norwegian Air Shuttle ASA - Investor Presentation January 2020
Norwegian Air Shuttle ASA
Investor Presentation       January 2020
Norwegian Air Shuttle ASA - Investor Presentation January 2020
Norwegian at a glance

                                                                   150+
                            4th                                       GLOBAL
                                                                   DESTINATIONS
                                                                                     ~10,000
                         LARGEST LOW-                                                HARD WORKING STAFF
                          COST AIRLINE
                           IN EUROPE*

                                                                                         ~36M
                              160+                                                        PASSENGERS FLOWN
                              AIRCRAFT IN FLEET
                                                                       500+
                                                                            ROUTES

                                                                                                             2
* Based on passengers in 2019, based on company traffic reports.
Norwegian Air Shuttle ASA - Investor Presentation January 2020
Set to leverage on scale
                                 Local short-haul focus                                                   Global growth phase, long-haul focus                          Focus on profitability

Aircraft orders                              42                 6         15     15+3   222                          19+8       30          2

New markets and other
key milestones                                                                                                                                                           Leading position
                                                                                                                                                                         on Nordic short
                                                                                                                                                                               haul
Number of Aircraft                                                                                                                                164
                                                                                                                                                   10        156
  787-8/9 Owned
  787-8/9 Leased                                                                                                                           144                11          Maturing long-
                                                                                                                                                   22
  737 MAX 8 Owned                                                                                                                           7                              haul offering
  737 MAX 8 Leased                                                                                                                          14                26          with improving
  737-800 Owned                                                                                                                                    14
                                                                                                                                116         6                                margins
  737-800 Leased                                                                                                                       3                 4
                                                                                                                                                              14
                                                                                                                                 9
  737-300 Owned                                                                                                       99                                            4
                                                                                                           95               3
  737-300 Leased                                                                                                 2
                                                                                                85         5
                                                                                                                      5
                                                                                                                                            53                            Solid platform
  M80 Leased                                                                                          1                                            52
                                                                                                      2                                                       40          and sufficient
                                                                                         68                                      64                                      scale to achieve
                                                                                  62            30         41         51
                                                                           57                                                                                              profitability
                                                                                  15     23
                                                                46         7
                                                         40           2
                                              32         7                 23
                                                    2
                                                                16
                                                                                  31            42                                          64     62
                                                                                                                                                                           Top ranked by
                                   22                    5                                                                                                    61
                                                                5                        35                42                                                             both short-haul
                                                                           5
                           13            2    22                                                                      40         40
         8
                    11                                   23
                                                                                  5                                                                                        and long-haul
 6                                 20                           23         22
 6       8          11     13                 8          5
                                                                                  11     5
                                                                                         5
                                                                                                5
                                                                                                5          5
                                                                                                                                                                            passengers
2002   2003        2004   2005    2006       2007       2008   2009       2010   2011   2012   2013       2014       2015       2016       2017   2018       2019

Europe’s Best Low-Cost Airline

World’s Best Low-Cost Long Haul Airline
                                                                                                                                                                                        3
Norwegian Air Shuttle ASA - Investor Presentation January 2020
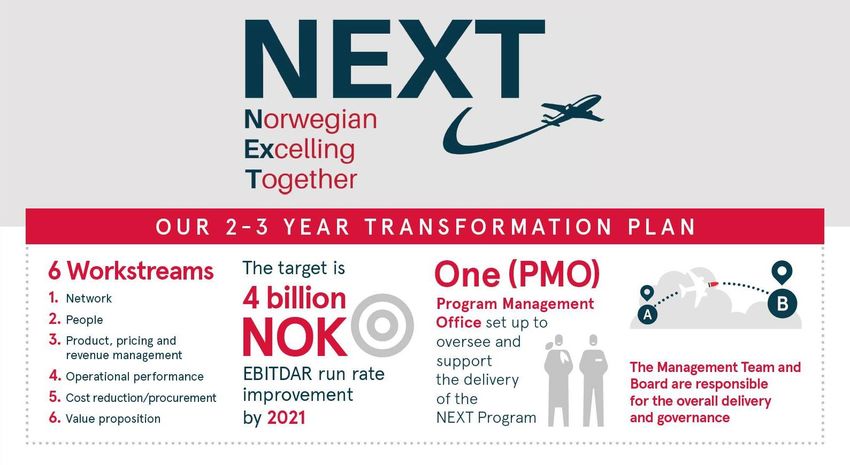
Key pillars of our corporate strategy 2018-2022

                                                                            KEY FOCUS AREAS
LONG TERM

             “We shall be the leading long-haul low-cost airline                                        • Reduce cost base
  VISION

              in Europe operating as the engine of global low-               Competitive cost base      • Sustainable unit cost position
               cost alliance and dominating the Nordic short-                                           • Cost control and automation
                                haul market”
                                                                                                        • Focus is to capitalize on long haul
                                                                            Profitable operations and
                                                                                                        • Fortify position in the Nordics
                                                                                  global alliance
                                                                                                        • Improve connectivity and feed

                                                                                                        • Improve operational simplicity
             Return to sustainable profitability                             Operational resilience     • Develop resilient program
                                                                                                        • Optimize technical & crew
OBJECTIVES

                                                                                                        • Commercially-driven fleet plan
STRATEGIC

             Be the preferred airline for customers seeking value               Optimized asset
             for money                                                                                  • Fleet renewal program
                                                                                 management
   2022

                                                                                                        • Maximize return on assets

                                                                                                        • Deliver on the basics
             Fortify position as the leading short-haul carrier in
                                                                             Shared customer focus      • One customer journey
             the Nordics
                                                                                                        • Personalization and Reward

                                                                                                        • Standardize and reduce complexity
             Build global low-cost alliance with our long-haul                 Improve digital and
                                                                                                        • Strategic sourcing
             operation as the backbone                                        analytics capabilities
                                                                                                        • Agile development processes

     CORE
    VALUES                                                           Innovation Teamwork Simplicity

                                                                                                                                                4
Norwegian Air Shuttle ASA - Investor Presentation January 2020
Changing strategic focus from growth to
profitability

           2013 - 2018                                   2019 -

           Focus on growth                 Focus on profitability and cash flow

  Built up market position and scale       Continuous efforts to reduce costs

                                            Optimization of the base structure
 Captured slots at constrained airports   and route network based on 12-month
                                                    profitability criteria

     Onboarded new aircraft and             Divest aircraft not required for the
       launched new routes                    company’s commercial needs

                                                                                   5
Norwegian Air Shuttle ASA - Investor Presentation January 2020
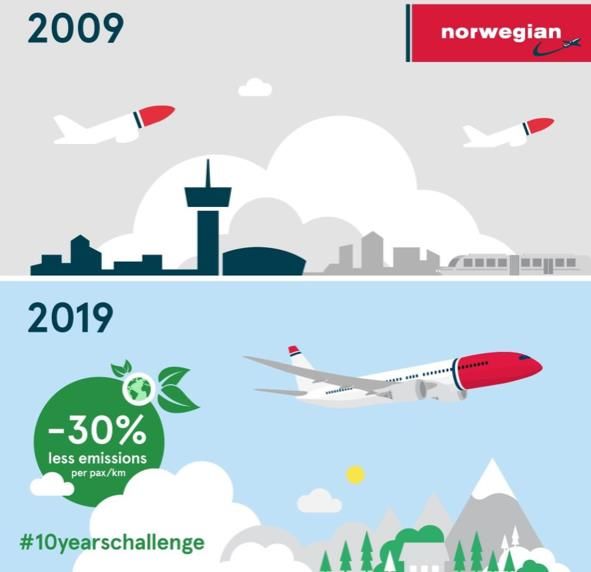
Changes to network and
operations
Stable demand at key airports

TOTAL PASSENGERS
In million
                                                                                        2015   2016   2017   2018   LTM Q3 2019

60

50

40

30

20

10

 0
                  Oslo                        Stockholm                    Copenhagen             Gatwick           Barcelona

                                                                                                                                  7
Source: Avinor, Swedavia, Copenhagen Airports, Gatwick Airport and Aena.
New strategy starting to show results

            → Profits in Q3 was the highest in the Company’s history
            → The planned capacity reduction supports higher unit revenue, better load
              factor and increased punctuality

            MONTHLY TRAFFIC DEVELOPMENT
                ASK (12m rolling)      Unit revenue growth y/y

            120,000                                                                   30%

            100,000                                                                   20%

             80,000                                                                   10%

             60,000                                                                   0%

             40,000                                                                   -10%

             20,000                                                                   -20%

                 0                                                                    -30%
                                    2016                         2017   2018   2019

                                                                                             8
Exhaustive review of the short-haul operation

SUMMER 2020 AIRCRAFT ALLOCATION
                                                                                       Focus on Nordic core
      Existing base
      Restructured base
      Closed base
()    Versus same
      season last year                                                      Short-haul network connectivity and density

                                        NO       TRD                 FI
                                      40 (+1)           SE         7 (-2)
                                                       14 (-3)
                                          BGO   OSL              HEL        Support long-haul feed, where appropriate
                           EDI                            ARN
                          0 (-1)          SVG

                                                 CPH
           DUB            DUB EDI                                           Closed down more than 70 routes, of which
           2 (-5)                                        DK
                                    LGW                 12 (0)                      more than 50 on short haul

                                     LGW
                                     7 (-4)
                                                          IT                            Reduce complexity
                                                        0 (-3)
                                          BCN
              ES                                 FCO
             20 (-6)          MAD
                                          PMI
                                    ALC
     TFS                     AGP                                             Handle fleet deficit from MAX grounding
           LPA

                                                                                                                          9
Our long-haul business in context

  Business       Long haul, low cost mainly focused on connecting primary airport / city
   model         points

                 Value for money fares with quality inflight services, leveraging our
Product focus
                 award-winning brand

                 A fleet of 37 Boeing 787 Dreamliners
    Fleet
                 Two-class configuration and high-density cabin

 Geographic      Connecting large catchment areas
   focus         Seek connectivity with the rest of the network where necessary

                 Finetuning network to improve operational resilience
 Profitability
                 Focus on core EU and US markets

                                                                                        10
Long haul developing according to strategy

SUMMER 2020 AIRCRAFT ALLOCATION             TRAFFIC AND YIELD DEVELOPMENT

                                                        ASK, 12m rolling (million)        Yield, 12m rolling (index; Q2 2013 = 100)
                                            60,000                                                                                      120

                                            50,000                                                                                      110

                                            40,000                                                                                      100

                                            30,000                                                                                      90
                           NO
                          787: 2            20,000                                                                                      80

                                            10,000                                                                                      70

                                                0                                                                                       60

                                                     Q2
                                                     Q3
                                                     Q4
                                                     Q1
                                                     Q2
                                                     Q3
                                                     Q4
                                                     Q1
                                                     Q2
                                                     Q3
                                                     Q4
                                                     Q1
                                                     Q2
                                                     Q3
                                                     Q4
                                                     Q1
                                                     Q2
                                                     Q3
                                                     Q4
                                                     Q1
                                                     Q2
                                                     Q3
                                                     Q4
                                                     Q1
                                                     Q2
                                                     Q3
             UK                                      2013      2014         2015          2016         2017         2018        2019
           787: 13
  US
 787: 2
                      FR
                                                                                                                             LTM
                     787: 7                                                        2017                 2018
                                                                                                                            Q3 2019
                                     IT      Passengers (million)                     3.0                   5.4                   6.0
            ES                     787: 4
           787: 5
                                             ASK (billion)                           23.9                 45.0                  49.9

                                             Legs                               11,500                 20,600                21,600

33 aircraft deployed on long-haul network    Load factor                             90%                  87%                   87%

                                                                                                                                        11
Largest foreign carrier in New York
 and largest European carrier in Los Angeles

Connecting networks
to feed long haul

                                               12
Our young fleet is a key sustainability,
commercial and financial advantage

                                                                                                              ~20% more fuel efficient than
                                                                                                                world average for airline

                                                                                                                         Lower fuel costs

                                                                                                       Significantly improved environmental
                                                                                                                     friendliness

                                                                                                        Newer and more sustainable aircraft
                                                                                                         are preferred by travellers globally

                                                                                                                                                13
Source: Planespotter.net, January 2019.
        The International Council on Clean Transportation (ICCT) Working Paper 2019-16: CO2 emissions from commercial aviation, 2018.
Our low-cost business model is one of the
most carbon efficient in the world

                               ONGOING INITIATIVES

                               Fleet renewal program

                             Advanced weather data from
                                      Avtech

                              SkyBreathe app for pilots

                                                          14
Disciplined low cost operating model

                Cost development in 2018 and 2019                                                                   Cost level compares well to peers

    Operating costs excl. fuel and ownership costs per ASK (NOK)                                   Operating costs (EBIT level) per ASK (NOK)1

        0.28                                                                                           AirAsia X                            0.27

                              0.25                     0.25                                              WizzAir                                0.32
                                           0.24
                  0.23                                             0.23
                                                                               0.22                      Ryanair                                   0.35
                                                                                                                                                                    Norwegian has the
                                                                                                                                                          0.43        youngest fleet

                                                                                                         easyJet                                                  0.56

                                                                                                         Vueling                                                    0.56

                                                                                                         JetBlue                                                      0.59

                                                                                                     Southwest                                                          0.59

                                                                                                          Finnair                                                        0.62

                                                                                                             SAS                                                                     0.76
       Q1 18     Q2 18       Q3 18       Q4 18       Q1 19        Q2 19       Q3 19

1 Based on 2018 annual reports or corresponding fiscal year.
• Foreign exchange rates used are equivalent to the daily average rates corresponding to the reporting periods and as stated by the Central Bank of Norway
• Other losses/(gains) are not included in the unit cost measure as it primarily contains hedge gains/losses offset under financial items, as well as other non-operational income   15
and/or cost items such as gains on the sale of spare part inventory and unrealized foreign currency effects on receivables/payables and (hedges of operational expenses).
#FOCUS2019:
    Raising full-year target to NOK 2.3 billion
                                                                                                                        Actual
                                                                                                           Actual Q3
   Cost area                                     Completed cost initiatives                                             YTD Q3
                                                                                                           (NOK m)
                                                                                                                       (NOK m)

Airport, handling
                    •   High effect of airport- and handling-related cost initiatives during peak season
  and technical
                    •   Progressing on several items with key technical suppliers
                                                                                                             408        924
     costs

                    •   Lower personnel costs due to improved planning and efficiency measures
   Operating        •   Standardizing operational tools and consumables
   efficiency       •   Improving disruption handling
                                                                                                             237        582
                    •   Processes to close operational bases announced

 Procurement,       •   Stronger effects from renegotiated volume-driven agreements
 administration     •   Consolidating office locations in Norway and Spain                                    68        177
    and IT          •   Implemented new flight planning system

  Commercial,
                    •   Product offering optimization
 marketing and
                    •   Working with partners to release synergies
                                                                                                             114        165
product offering

      Total                                                                                                  827       1,848

                                                                                                                        16
Continuing to deliver on
strategic changes
Fuel is the largest variable expense and
           accounted for 30 percent of costs in 2018
      Jet fuel                                                                                                                                                                    Brent
      (USD/MT)                                          Jet fuel price and effective fuel price including hedging1                                                       (USD per BOE)
      1200                                                                                                                                                                          140

                                                                                                                                                                                     120
      1000

                                                          885
                                                                                                                                  639                                                100
                                                          859
       800                                                                                                                        601
                                                          728                 719                                                 569
                                                                                                                                                         685
                                                                                                                                                                  674                80
                                                                              672                                                                                 647
       600                                                                    580                        582                                                      605
                                                          614
                                                                                                         568
                                                                              498                                     526          560                                               60
                                                                                                                      514

       400
                                                                                                                                                                                     40

       200
                                                                                                                                                                                     20

          0                                                                                                                                                                        0
                                                                                                                                                    2
           2014                     2015                      2016                      2017                      2018                      2019                2020           2021
                                         JET1NECC INDEX                 SAS           easyJet          Ryanair           Norwegian               Brent   Brent forward
Hedging ratio 12m fwd at FY reporting
SAS                                 80 %                        45 %                    43 %                       52 %                      62 %               n.a.
easyJet                             83 %                        81 %                    75 %                       65 %                      68 %               n.a.
Ryanair                             90 %                        95 %                    90 %                       90 %                      90 %               n.a.
Norwegian                           50 %                        52 %                    25 %                       35 %                      00 %               n.a.
                                                                                                                                                                                18
       1) Numbers presented are annualised numbers on a December year-end basis due to the different reporting standards of the peer companies
       2) 2019 full year estimated with a forward fuel cost at 626 USD/MT as per 12.12.2019
Impact of MAX grounding and engine issues

 Status and impact from MAX grounding
   18 aircraft grounded 12 March 2019
   16 new deliveries deferred
   Estimated negative impact on P&L of NOK 1 billion for 2019
   Discussions on compensation and new delivery schedule

 Engine issues Dreamliners
   Estimated negative impact on P&L of NOK 300 million for 2019

 Credit card acquirers
   Onboarded two new acquirers in Q4 plus a new account-to-account solution
   In discussions with existing acquirers
Significant actions to increase financial
 headroom while transforming the business

  #Focus2019                          Sale of NOFI                Partnership                 Joint Venture            Sale of
  Target achieved                     Completed sale of           Letter of intent for        Established joint        Argentina
  through continuous                  shares with final           partnership with            venture with CCBLI       Sold Argentinian
  cost focus and                      settlement in Q4            JetBlue                     reducing capex by        subsidiary to
  revised target to                   and cash release of                                     NOK 13.7 billion         JetSMART
  NOK 2.3 billion                     NOK 0.9 billion

                    Deferring                      Bond maturity                 Sale of aircraft         Capital raise
                    deliveries                     NOK 3.4 billion               Concluded 24 AC          Private placement of
                    Restructuring of               extended with                 for 2019 and 2020        NOK 1.1 billion and CB
                    aircraft orders                approx. 2 years               with net liquidity       of USD 150 million.
                    reducing capex by              compared to                   effect of NOK 2.2        This comes on top of
                    NOK 22.0 billion for           original maturity             billion                  NOK 3 billion rights
                    2019 and 2020                  dates                                                  issue in Q1 2019

       Ongoing                            Aug         Sept                           Oct                     Nov             Dec

                                                                                                                                20
Based on exchange rate USD/NOK of 9.10.
Sold a total 24 aircraft with net proceeds of
NOK 2.2 billion in 2019 and 2020

NUMBER OF AIRCRAFT BASED ON ANNOUNCED SALES

       164          164          162          161
                                                             156                                           158
       10             10          11                                     150          149        152
                                               11
                                                             11                                             15
       22             24                                                 14            15         15
                                  25           26
                                                             26                                             26
       14             14                                                 26                       26
                                  14                                                   26                                      787-8/9 Owned
        4             4                        14
                                   4                         14                                                                787-8/9 Leased
                                                4
                                                              4          19                       23        30
                                                                                       19                                      737 MAX 8 Owned
       52             51                                                  4            4          4                            737 MAX 8 Leased
                                  47           45                                                           4
                                                             40
                                                                         30                                                    737-800 Owned
                                                                                       30         30        30
                                                                                                                               737-800 Leased

       62             61          61           61            61          57            55         54        53

      Q4 18        Q1 19        Q2 19        Q3 19         Q4 19        Q1 20        Q2 20       Q3 20    Q4 20

   Fleet (2020 vs. 2018)                  Aircraft sales*                Aircraft re-deliveries          Aircraft deliveries       Net development

            Short haul                                  22                                   9                       16                           -15

            Long haul                                    0                                   0                        9                            9

              Total                                     22                                   9                       25                            -6

                                                                                                                                                        21
* In addition, the company sold two Airbus A320neo in Q1 2019 that were on external lease.
NEXT steps
Fly Norwegian

  Book tickets at Norwegian.com
You can also read