Novel climates, no-analog communities, and ecological surprises
←
→
Page content transcription
If your browser does not render page correctly, please read the page content below
PALEOECOLOGY PALEOECOLOGY PALEOECOLOGY
                                                                                                                                          475
Novel climates, no-analog communities, and
ecological surprises
John W Williams1* and Stephen T Jackson2

        No-analog communities (communities that are compositionally unlike any found today) occurred frequently in the
        past and will develop in the greenhouse world of the future. The well documented no-analog plant communities of
        late-glacial North America are closely linked to “novel” climates also lacking modern analogs, characterized by high
        seasonality of temperature. In climate simulations for the Intergovernmental Panel on Climate Change A2 and B1
        emission scenarios, novel climates arise by 2100 AD, primarily in tropical and subtropical regions. These future
        novel climates are warmer than any present climates globally, with spatially variable shifts in precipitation, and
        increase the risk of species reshuffling into future no-analog communities and other ecological surprises. Most eco-
        logical models are at least partially parameterized from modern observations and so may fail to accurately predict
        ecological responses to these novel climates. There is an urgent need to test the robustness of ecological models to cli-
        mate conditions outside modern experience.
Front Ecol Environ 2007; 5(9): 475–482, doi:10.1890/070037

H     ow do you study an ecosystem no ecologist has ever
       seen? This is a problem for both paleoecologists and
global-change ecologists, who seek to understand ecolog-
                                                                        past or future, is heavily conditioned by our current
                                                                        observations and personal experience.
                                                                           The further our explorations carry us from the present,
ical systems for time periods outside the realm of modern               the murkier our vision becomes. This is not just because
observations. One group looks to the past and the other                 fossil archives become sparser as we look deeper into the
to the future, but both use our understanding of extant                 past, nor because the chains of future contingency
ecosystems and processes as a common starting point for                 become increasingly long. Rather, the further we move
scientific inference. This is familiar to paleoecologists as            from the present, the more it becomes an inadequate model
the principle of uniformitarianism (ie “the present is the              for past and future system behavior. The current state of
key to the past”), whereby understanding modern                         the Earth system, and its constituent ecosystems, is just
processes aids interpretation of fossil records. Similarly,             one of many possible states, and both past and future sys-
global-change ecologists apply a forward-projected form                 tem states may differ fundamentally from the present.
of uniformitarianism, using models based on present-day                 The more that environments, past or future, differ from
ecological patterns and processes to forecast ecological                the present, the more our understanding of ecological
responses to future change. Thus, both paleoecology and                 patterns and processes will be incomplete and the less
global-change ecology are inextricably rooted in the cur-               accurately will our models predict key ecological phe-
rent, and research into long-term ecological dynamics,                  nomena such as species distributions, community com-
                                                                        position, species interactions, and biogeochemical-
                                                                        process rates.
                          In a nutshell:
                                                                           Here, we focus on “no-analog” plant communities
    • Many past ecological communities were compositionally             (Panel 1), their relationship to climate, and the chal-
      unlike modern communities                                         lenges they pose to predictive ecological models. We
    • The formation and dissolution of these past “no-analog” com-
      munities appear to be climatically driven and linked to cli-      briefly summarize a niche-based, conceptual framework
      mates that are also without modern analogs                        explaining how no-analog communities arise (Jackson
    • If anthropogenic greenhouse-gas emissions continue unabated,      and Overpeck 2000). We discuss past no-analog commu-
      many future climates will probably lack modern analogs, with      nities, using the well documented late-glacial communi-
      tropical regions at greatest risk                                 ties as a detailed case study (Jackson and Williams 2004),
    • Regions over much of the globe are likely to develop novel
      communities and other ecological surprises in a future green-     and argue that these communities were shaped by envi-
      house world                                                       ronmental conditions also without modern counterpart
                                                                        (Williams et al. 2001). We then turn to the future, identi-
                                                                        fying regions of the world at risk of developing future
1
 Department of Geography and Center for Climatic Research, University   novel climates (Williams et al. 2007). Finally, we discuss
of Wisconsin, Madison, WI 53706 *(jww@geography.wisc.edu);              the implications for global-change ecology, including the
2
 Department of Botany and Program in Ecology, University of             risk of future novel ecosystems (Hobbs et al. 2006) and
Wyoming, Laramie, WY 82071                                              the challenges posed for ecological forecasting.

© The Ecological Society of America                                                                         www.frontiersinecology.or g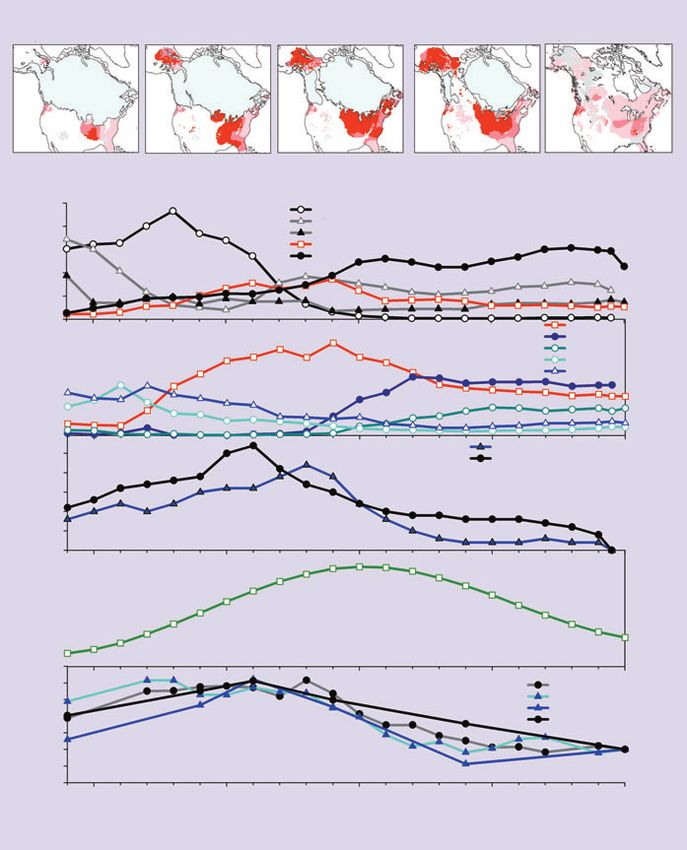
No-analog communities                                                                                 JW Williams and ST Jackson

476                                                                          state and variability (Clark et al. 1999). These complex
                                              Present
                                                                             climate changes accompanied, and were partially driven
                                                                             by, glacial–interglacial changes in atmospheric CO2 and
                            Sp 1                                             CH4 concentrations (Siegenthaler et al. 2005; Spahni et al.
                                                                             2005). Similarly complex changes are expected for this
       Climate variable 2

                                                                             century (IPCC 2007). The richly varied trajectories of
                                                                             species migrations, both past (Williams et al. 2004) and
                                                                             future (Iverson et al. 2004) derive from these multivariate
                                                                             changes in climate, energy inputs, and atmospheric chem-
                                                             time t          istry (Jackson and Overpeck 2000; Webb et al. 2004).
                                                                                Individualistic species dynamics and the formation of
                                                                             no-analog communities can be explained by a niche-based
                                                       Sp 2                  conceptual framework (Jackson and Overpeck 2000;
                                                                             Figure 1). Each species has a unique, multidimensional
                                                                             fundamental niche, defined as the environmental enve-
                                                Sp 3                         lope within which it maintains viable populations (Araújo
                                                                             and Guisan 2006). Not all combinations of environmental
                                                                             variables are realized, however, and so portions of a funda-
                             Climate variable 1                              mental niche may not exist today (Jackson and Overpeck
      Fi gure 1. A conceptual diagram showing how no-analog                  2000; Figure 1). If climate change leads to new combina-
      combinations of species arise in response to novel climates. The set   tions of climate variables, species can expand into previ-
      of climates in existence at two periods, “present” and an arbitrary    ously unrealized portions of their fundamental niche.
      “time t”, are represented as open ellipses. The fundamental niches        Depending on the environments available, groups of
      for three species are shown as colored ellipses. Associations          species may co-occur at some times but not others (Fig-
      between species can occur only when their fundamental niches           ure 1). As climate changes, shifts in the realized environ-
      overlap with one another and with the set of climates in existence     mental space may drive disaggregation of some species
      at a particular time period. A present-day ecologist would therefore   associations and emergence of others. The formation of
      sometimes observe communities containing both Species 1 and 2,         no-analog communities, past or future, should therefore
      but would never observe co-occurrences of Species 2 and 3 (nor         result from the development of climates also lacking any
      Species 1 and 3). If the right climates arise, however, Species 2      modern counterpart (Williams et al. 2001; Jackson and
      and 3 could co-occur, forming a “no-analog” community from the         Williams 2004).
      perspective of the present-day ecologist. Adapted from Figure 5 in        In this conceptualization, species’ niches are static, but
      Jackson and Overpeck (2000).                                           the environment is not. Of course, in reality, species evolve
                                                                             and niches are not static, so this conceptual model is best
       Individualistic species shifts and no-analog                         suited to time scales at which rates of environmental
                communities: a conceptual framework                          change are large relative to rates of evolutionary change.
                                                                             Paleoecologists have generally assumed that adaptive
      The formation and disappearance of no-analog commu-                    responses to late-Quaternary environmental changes were
      nities (see Panel 1 for definition) are part of a more gen-            small, because plant and mammalian niches appear to have
      eral phenomenon: the individualistic responses of species              been largely conserved during the late Pleistocene
      to environmental change. Ranges and abundances of ter-                 (Huntley et al. 1989; Martínez-Meyer et al. 2004).
      restrial species shifted dramatically during the last                  Adaptive responses to past climate change, however
      deglaciation. Species varied widely in the timing, magni-              important, are still poorly understood (Davis et al. 2005).
      tude, and direction of these responses, and communities                Because rates of evolutionary change are controlled in part
      did not migrate as intact units (Gleason 1926; Davis 1981;             by generation time and within-species genetic correlations
      FAUNMAP Working Group 1996; Jackson and Overpeck                       among traits (Etterson and Shaw 2001), the importance of
      2000). Similar responses occurred during earlier periods of            adaptive responses to 21st-century climate change will
      climate change (Wing et al. 2005) and individualistic                  vary among taxa and will presumably be greatest for organ-
      behavior is documented for species responding to current               isms with comparatively short (< 1 year) generation times.
      climate changes (Walther et al. 2002).
        Quaternary vegetation dynamics were driven by                         No-analog communities of the past: a late-glacial
      orbitally controlled glacial–interglacial climate cycles, as             case study
      well as by sub-orbital (millennial) modes of climate vari-
      ability (Overpeck et al. 2003). These environmental                    No-analog fossil assemblages are pervasive in Quaternary
      changes varied regionally, and included changes in multi-              paleoecological records, documented for plants (eg
      ple variables (eg seasonal temperature, precipitation mag-             Overpeck et al. 1992; Jackson and Williams 2004), mam-
      nitude and timing, insolation) and changes in both mean                mals (eg Stafford et al. 1999; Graham 2005), coleopterans

      www.fr ontiersinecology.or g                                                                         © The Ecological Society of America
JW Williams and ST Jackson                                                                               No-analog communities

(eg Morgan and Morgan 1980), mollusks (eg Kitamura              Panel 1. What is a “no-analog” community?                               477
2004), and foraminifera (eg Cannariato et al. 1999; Mix et      No-analog communities consist of species that are extant today,
al. 1999). No-analog assemblages occur in terrestrial and       but in combinations not found at present. “No-analog” is there-
marine settings and from high latitudes (Edwards et al.         fore shorthand for “no present analog” and can refer to both past
2005) to low (Bush et al. 2004). The assemblages appear to      and potential future communities. This definition casts no-analog
represent truly anomalous communities and are not due to        communities as ecological, not evolutionary, phenomena, because
after-death mixing of fossils from temporally or spatially      it is assumed that the constituent species still exist today but are
distinct communities (Jackson and Williams 2004). The           reshuffled into combinations not found at present. No-analog fos-
best-known cases are from the most recent glacial–inter-        sil assemblages also have been called “disharmonious”, “mixed”,
glacial transition in North America (Anderson et al. 1989;      “intermingled”, “mosaic”, or “extraprovincial” assemblages
Overpeck et al. 1992; FAUNMAP Working Group 1996;               (Graham 2005), whereas future no-analog ecosystems have also
Williams et al. 2001; Edwards et al. 2005).                     been called “novel” or “emerging” (Milton 2003; Hobbs et al.
                                                                2006). Here, we use “no-analog” and “novel” interchangeably. Our
   Networks of fossil pollen data collected from lake and
                                                                usage is not the same as in Ohlemüller et al. (2006), who use “non-
mire sediments reveal the distribution (Figure 2a) and
                                                                analogue” to mean current climates with no future analog (which
composition (Figure 2 b,c) of late-glacial no-analog plant      we call “disappearing” climates; Williams et al. 2007).
communities in North America. In the minimum-dissimi-
larity maps (Figure 2a), high dissimilarities (darker reds)
indicate where fossil assemblages have no close analog in         In eastern North America, the high pollen abundances of
modern pollen assemblages (Williams et al. 2001). These        temperate tree taxa (Fraxinus, Ostrya/Carpinus, Ulmus) in
communities are characterized by anomalously high abun-        these highly seasonal climates may be explained by their
dances of some taxa (eg Betula; Figure 2c), co-occurrences     position at the edge of the current North American climate
at high abundances of taxa now nearly allopatric (eg           envelope (Williams et al. 2006; Figure 3). This pattern sug-
Picea, Fraxinus; Figure 2b), and/or very low abundances of     gests that the fundamental niches for these taxa extend
now common taxa (eg Pinus; Figure 2b). The no-analog           beyond the set of climates observed at present (Figure 3), so
plant associations in Alaska and eastern North America         that these taxa may be able to sustain more seasonal regimes
are broadly contemporaneous with each other (indicated         than exist anywhere today (eg Figure 1), as long as winter
by similar trends in the minimum dissimilarity between         temperatures do not fall below the –40˚C mean daily freez-
fossil pollen assemblages and their closest modern coun-       ing limit for temperate trees (Sakai and Weiser 1973).
terparts; Figure 2d), and are also apparently contempora-         However, the evidence for higher-than-present season-
neous with no-analog plant assemblages in Europe               ality does not rule out effects of other environmental fac-
(Huntley 1990; Willis et al. 2000) and the southwestern        tors (eg lowered CO2 concentrations, absent or sparse
US (Betancourt et al. 1990), and with North American           human populations, existence of now-extinct mega-herbi-
no-analog mammalian communities (FAUNMAP                       vores) upon late-glacial vegetation composition and struc-
Working Group 1996; Stafford et al. 1999). These phe-          ture (Owen-Smith 1987). Lowered CO2 concentrations,
nomena are very likely related. However, conclusively          in particular, probably affected late-glacial vegetation pro-
demonstrating that no-analog communities were contem-          foundly, by limiting the amount of carbon substrate for
poraneous across taxonomic groups and continents               photosynthesis and increasing sensitivity to moisture
requires more systematic data integration as well as re-dat-   stress (Sage and Coleman 2001). These alternative mech-
ing key sites (often collected decades ago) using the pre-     anisms require testing (eg Robinson 2005; Wu et al. 2007).
cise radiometric dating techniques now available (eg              In summary, many late-glacial ecosystems would appear
Stafford et al. 1999; Grimm and Jacobson 2004).                strange to modern ecologists, even though they consisted of
   Several lines of evidence indicate that development of      extant species. The observed correspondence between past
late-glacial, no-analog plant communities was linked to        no-analog communities and climate suggests a causal rela-
the occurrence of no-analog climates, characterized by         tionship – further evidence that no-analog communities
higher-than-present temperature seasonality (Delcourt          may develop in the future if novel climates arise.
and Delcourt 1994; Williams et al. 2001; Edwards et al.
2005). The similar timing between the development of            Risk of novel climates by 2100 AD
Alaska and eastern North American no-analog commu-
nities (Figure 2 a,d), which were separated by the             Although community reshuffling driven by individualistic
Laurentide and Cordilleran Ice Sheets, suggests a common       species responses to 21st-century climate change has been
atmospheric driver. Simulations from two climate models        discussed (Schneider and Root 1998; Stafford et al. 1999;
(Kutzbach et al. 1998; Marsiat and Valdes 2001) indicate       Jackson and Overpeck 2000; Davis and Shaw 2001;
that both regions had anomalously large annual ranges          Overpeck et al. 2003), there has been no attempt to quan-
(maximum–minimum monthly mean values) of insola-               tify the magnitude or spatial distribution of risk. We
tion and temperature (Williams et al. 2001; Figure 2 e,f)      review our recent work that maps risk of novel climates by
with the largest temperature ranges coinciding with peak       2100 AD (Williams et al. 2007).
vegetation dissimilarity (Figure 2 d, f).                         Our risk maps (Figure 4) are based upon analyses of an

© The Ecological Society of America                                                                       www.frontiersinecology.or g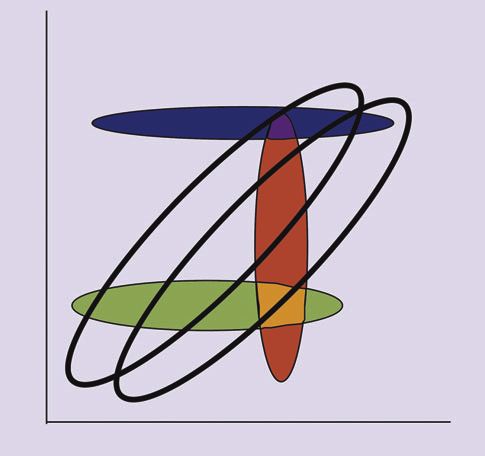
No-analog communities JW Williams and ST Jackson
478 (a) century climate simulated for a
21 000 yrs bp 16 000 yrs bp 14 000 yrs bp 12 000 yrs bp 6000 yrs bp model grid-cell is novel if its com-
bination of seasonal temperature
and precipitation differs substan-
tially from all late 20th-century
climates (Williams et al. 2007).
More formally, we deemed a 21st-
(b) century climate grid-cell novel if
50 Picea its dissimilarity to its closest 20th-
Pinus
dissimilarity
40 Cyperaceae century match exceeded a critical
Minimum
Fraxinus + Ostrya/Carpinus + Ulmas
30 Quercus threshold, here defined as the dis-
20 similarity value that optimally dis-
10 criminates whether a pair of
0 80 1980–1999 climate grid-cells were
abundance (%)
Betula
(c) Alnus
Picea drawn from the same or different
Relative
66
Poaceae
Cyperaceae
40
biomes (Williams et al. 2007).
Risk is represented by the fraction
20
(d) of climate models simulating
0.30 0
Alaska novel climates out of all models
0.25 ENA
disimilarity
analyzed. We analyzed simulations
Minimum
0.20
0.15 for the IPCC A2 emissions sce-
0.10 nario (where atmospheric pCO2
0.05
reaches 850 ppm by 2100 AD and
0.00 15
is not yet stabilized) and the IPCC
Seasonality
insolation (%)
(e)
10 B1 scenario (pCO2 stabilized at
6 550 ppm by 2100 AD).
(f) 0 Our projected novel climates
–5
were concentrated in tropical
50
temperature (%)
and sub-tropical regions (Figure
Seasonality
40 HadUM ENA
30 HadUM Alaska
CCM1 Alaska 4). This spatial fingerprint is
20
10
CCM1 ENA
the result of global warming: as
0 the world warms, the warmest
–10
–20
areas are the first to move out-
20 15 10 5 0 side the present climate space.
Age (ka BP) Precipitation changes are im-
portant, but secondary. In the
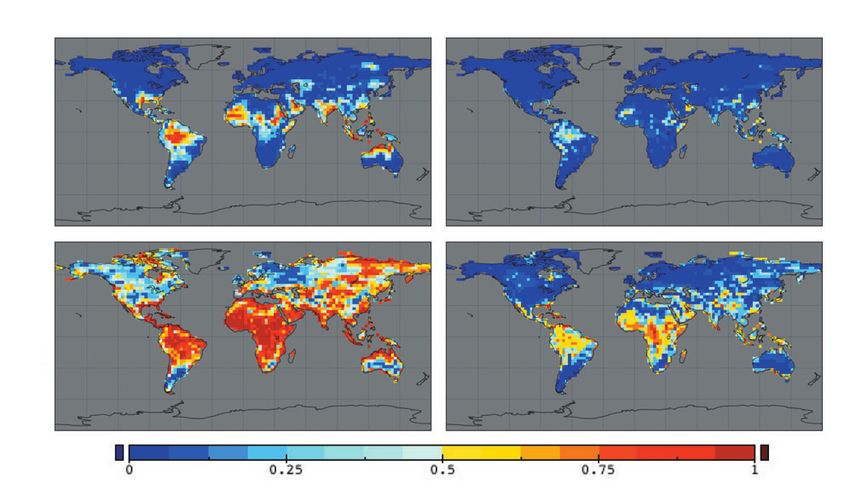
Figure 2. “No-analog” plant communities in North America were most extensive between A2 simulations (Figure 4a),
17 000 and 12 000 years ago and were most prevalent in Alaska and the interior of eastern North novel climates are likely to
America (a; red shading is scaled to the dissimilarity between fossil pollen assemblages and their develop in lowland Amazonia,
closest modern analogs). Trends in community composition between the “no-analog” pollen the southeastern US, the
assemblages of (b) east-central North America (ENA) and (c) Alaska are quite different, (d) yet African Sahara and Sahel, the
the timing of peak no-analog conditions is similar, suggesting a common forcing. Likely candidate eastern Arabian Peninsula,
forcings include seasonality of (e) insolation and (f) temperature, both of which were higher than southeast India and China, the
present during the late-glacial period. Changes in temperature and insolation seasonality are IndoPacific, and northern
expressed as 100%*(AnnualRangePast– AnnualRangePresent)/AnnualRangePresent. Insolation values Australia (“likely” defines cases
are for 60˚N (Berger and Loutre 1991); temperature time series are based on simulations from the in which over half of analyzed
HadUM and CCM1 climate models (Kutzbach et al. 1998; Marsiat and Valdes 2001). climate models simulate novel
climates). Novel climates
ensemble of global climate simulations performed for the might develop in the western US, central Asia, and
IPCC 2007 report, from which we calculated the dissimi- Argentina (“might” defines cases in which fewer than
larity between mean 1980–1999 and 2080–2099 climates half of models simulate novel climates). Temperate
across all terrestrial grid-cells (in the climate model simu- and upper latitudes have little apparent risk of future
lations analyzed here, mean grid-cell size was 2.8 degrees novel climates, at least by 2100. Risk is distributed
latitude by 2.8 degrees longitude). Climate change is rep- similarly in the B1 simulations, but at lower levels
resented by a dissimilarity index that integrates four vari- (Figure 4b).
ables: mean summer temperature, winter temperature, In this analysis, if a 21st-century climate grid-cell has
summer precipitation, and winter precipitation. A 21st- an analog anywhere in current climates, it is not counted
www.fr ontiersinecology.or g © The Ecological Society of America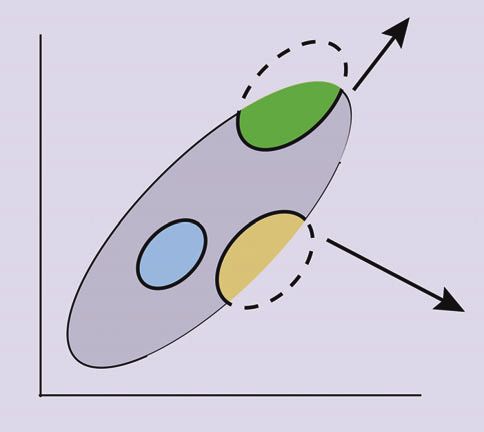
JW Williams and ST Jackson                                                                               No-analog communities

                                                                         30           Implications for ecological                      479
                                                                              (b)       forecasting
                                                                         20

                                        January temperature (˚C)
                                                                                        Novel climates represent a serious chal-
                                                                         10             lenge for forecasting ecological responses
                                                0
                                                                                        to climate change. Bioclimatic niche
                                                                                        models are widely used to predict future
                                              –10                                       species range shifts and extinction risks
                                                                                        (Hannah et al. 2002; Iverson et al. 2004;
                                              –20
                                                                                        Thomas et al. 2004; Thuiller et al. 2005).
                                              –30                                       Such models are based on correlations
                                                                                        between current climates and species dis-
         (a)                                  –40
                                                  0       10       20         30        tributions. It is widely recognized that
                                                        July temperature (˚C)           dispersal limitations and other biotic fac-
    30                                         30                                       tors prevent species from fully occupying
        (c)                                         (d)
                                              January temperature (˚C)
January temperature (˚C)

    20                                         20                                       their fundamental niches, reducing the
                                                                                        predictive power of niche models
    10                                         10
                                                                                        (Araújo and Guisan 2006). It is less
     0                                          0                                       widely recognized that, even in the
   –10                                        –10                                       absence of biotic limitations, fundamen-
   –20                                        –20                                       tal niches will be incompletely repre-
                              Fraxinus
No-analog communities JW Williams and ST Jackson
480 A2 B1
(a) (b)
Global
(c) (d)
500-km limit
Figur e 4. Analyses of IPCC climate-change scenarios (A2 and B1) suggest that climates with no modern analog may develop by the
end of this century. The mapped risk estimates show for each grid-cell the fraction of climate models indicating that 2080–2099
climates will lack any close match with 1980–1999 climates. In (a and b), the search for 20th-century analogs was global, so that
“novel” 21st-century climates lack analogs anywhere in global 20th-century terrestrial climate space. In (c and d), the search for
20th-century analogs was limited to < 500 km from the target grid-cell, so that in this context, “novel” 21st-century climates are novel
regionally, and may or may not be novel globally. (a and c) Results for the “business-as-usual” A2 scenario, in which CO2
concentrations reach 850 ppm by 2100 AD. (b and d) Results for the B1 scenario, in which CO2 concentrations stabilize at 550 ppm
by 2100 AD. Adapted from Figures 2 and 3 in Williams et al. (2007).
1991; Martínez-Meyer et al. 2004), and particularly for Conclusions: “Here there be dragons”
no-analog climates. Past no-analog climates differ from As we sail into the future, we need to forecast what lies
those we will encounter in the future, but they can be ahead (Clark et al. 2001). However, novel climates repre-
used to test the robustness of ecological models. sent uncharted portions of climate space, where we have
Demonstrating that ecological models can accurately no observational data to parameterize and validate ecolog-
simulate past species distributions and community com- ical forecasts. They are the climatic equivalent of
position is necessary but not sufficient to impart confi- uncharted regions of the world, to which early European
dence in future predictions. cartographers supposedly applied the label, “Here there be
The challenge posed by future novel climates is com- dragons”. Of course, dragons were never found, although
pounded by their apparent concentration in regions of other hazards and opportunities were encountered. While
high ecological complexity and diversity (Figure 4). This dragons may or may not lurk in our future, the problem of
increases the likelihood of ecological surprises arising novel climates needs to be confronted squarely, and the
from species interactions and other emergent phenom- adequacy of ecological models under novel climates rigor-
ena. Furthermore, the high rate of projected climate ously assessed. Ecological forecasts for novel climates will
change means that novel communities will arise as tran- always be less certain because they are inherently extrap-
sient responses owing to interspecific differences in cli- olative. Given the risk of ecological surprises and the loss
mate sensitivity and migration capacity (Kirilenko and of ecological services in a greenhouse world, there is con-
Solomon 1998). Human land use, landscape fragmenta- siderable societal value in keeping climate “on the map”,
tion, biological invasions, increases in atmospheric CO2, within the range of optimal predictive capacity.
and other biogeochemical shifts will interact with novel
climates to yield yet more ecological surprises (Milton Acknowledgements
2003; Hobbs et al. 2006). Shifts in species composition
may lead to changes in ecosystem functioning, the nature The IPCC climate simulations were provided by interna-
and direction of which may be difficult to predict. tional modeling groups, collected and archived by the
www.fr ontiersinecology.or g © The Ecological Society of AmericaJW Williams and ST Jackson No-analog communities
distribution modelling. J Biogeogr 33: 1677–88.
Berger A and Loutre MF. 1991. Insolation values for the climate of 481
the last 10 million years. Quaternary Sci Rev 10: 297–317.
Betancourt JL, Van Devender TR, and Martin PS (Eds). 1990.
A Packrat middens: the last 40 000 years of biotic change.
Tucson, AZ: University of Arizona Press.
Sp 3 Bush MB, De Oliveira PE, Colinvaux PA, et al. 2004. Amazonian
paleoecological histories: one hill, three watersheds.
Palaeogeogr Palaeocl 214: 359–93.
Cannariato KG, Kennett JP, and Behl RJ. 1999. Biotic response to
late Quaternary rapid climate switches in Santa Barbara Basin:
E2 ecological and evolutionary implications. Geology 27: 63–66.
B Clark JS, Carpenter SR, Barber M, et al. 2001. Ecological forecasts:
Sp 1 Sp 2 an emerging imperative. Science 293: 657–60.
Clark PU, Webb RS, and Keigwin LD (Eds). 1999. Mechanisms of
global climate change at millennial time scales. Washington,
DC: American Geophysical Union.
Cramer W, Bondeau A, Woodward FI, et al. 2001. Global response
of terrestrial ecosystem structure and function to CO2 and cli-
mate change: results from six dynamic global vegetation mod-
E1 els. Glob Change Biol 7: 357–73.
Davis MB. 1981. Quaternary history and the stability of forest com-
Figur e 5. Conceptual diagram showing that the predictive munities. In: West DC, Shugart HH, and Botkin DB (Eds).
ability of niche-based ecological models varies by species, and Forest succession. New York, NY: Springer-Verlag.
depends on (1) whether the present climate space (gray ellipse) Davis MB and Shaw RG. 2001. Range shifts and adaptive
encompasses species’ fundamental niches (colored ellipses) and responses to Quaternary climate change. Science 292: 673–79.
Davis MB, Shaw RG, and Etterson JR. 2005. Evolutionary
(2) the trajectory of climate change (arrows). Niche model- responses to changing climate. Ecology 86: 1704–14.
based forecasts for Species 1 should be fairly reliable regardless of Delcourt HR and Delcourt PA. 1994. Postglacial rise and decline of
climate-change trajectory, because its niche is entirely Ostrya virginiana (Mill) K Koch and Carpinus caroliniana Walt
encompassed by the present climate space. Conversely, the in eastern North America: predictable responses of forest
fundamental niches for Species 2 and 3 are only partially species to cyclic changes in seasonality of climates. J Biogeogr
21: 137–50.
described by modern climate observations, and the predictive
Edwards ME, Brubaker LB, Lozhkin AV, and Anderson PM. 2005.
ability of niche models for these species varies with climate- Structurally novel biomes: a response to past warming in
change trajectory. If trajectory A, then currently unobserved Beringia. Ecology 86: 1696–1703.
portions of the fundamental niche for Species 2 will open up Etterson JR and Shaw RG. 2001. Constraint to adaptive evolution
(resulting in unexpected behavior by Species 2) but not for in response to global warming. Science 294: 151–54.
Species 3. The inverse is true if trajectory B is followed. FAUNMAP Working Group. 1996. Spatial response of mammals
to late Quaternary environmental fluctuations. Science 272:
1601–06.
Program for Climate Model Diagnosis and Intercomparison Gleason HA. 1926. The individualistic concept of the plant associ-
(PCMDI). The Coupled Model Intercomparison Project ation. B Torrey Bot Club 53: 7–26.
(CMIP) and Climate Simulation Panel facilitated commu- Graham RW. 2005. Quaternary mammal communities: relevance
nity analyses. P Behling (UW Center for Climatic of the individualistic response and non-analogue faunas.
Paleontol Soc Pap 11: 141–58.
Research) and the IPCC WGI Technical Support Unit pro- Grimm EC and Jacobson Jr GL. 2004. Late-Quaternary vegetation
vided technical support. The IPCC Data Archive at the history of the eastern United States. In: Gillespie AR, Porter
Lawrence Livermore National Laboratory is supported by SC, and Atwater BR (Eds). The Quaternary period in the
the US Department of Energy. J Kutzbach collaborated on United States. Amsterdam, Netherlands: Elsevier.
the future-climate analyses and J Kaplan and L Zajac Hannah L, Midgley GF, Lovejoy T, et al. 2002. Conservation of bio-
diversity in a changing climate. Conserv Biol 16: 264–68.
assisted with data preparations for the HadUM simulations. Hobbs RJ, Arico S, Aronson J, et al. 2006. Novel ecosystems: theo-
We thank the many contributors and maintainers of the retical and management aspects of the new ecological world
North American Pollen Database. Comments from A order. Global Ecol Biogeogr 15: 1–7.
Solomon and J McLachlan improved the manuscript. This Huntley B. 1990. Dissimilarity mapping between fossil and con-
work was supported in part by grants from the National temporary pollen spectra in Europe for the past 13 000 years.
Quaternary Res 33: 360–76.
Science Foundation (ATM-0507999, DEB-0716471, DEB- Huntley B, Bartlein PJ, and Prentice IC. 1989. Climatic control of
0613952, DEB-0345012, DEB-0716591) and the Univer- the distribution and abundance of beech (Fagus L) in Europe
sity of Wisconsin-Madison Graduate School. and North America. J Biogeogr 16: 551–60.
IPCC (Intergovernmental Panel on Climate Change). 2007.
Climate change 2007: the physical science basis. Summary for
References policymakers. Geneva, Switzerland: Intergovernmental Panel
Anderson PM, Bartlein PJ, Brubaker LB, et al. 1989. Modern on Climate Change.
analogs of late-Quaternary pollen spectra from the western Iverson LR, Schwartz MW, and Prasad AM. 2004. How fast and far
interior of North America. J Biogeogr 16: 573–96. might tree species migrate in the eastern United States due to
Araújo MB and Guisan A. 2006. Five (or so) challenges for species climate change? Global Ecol Biogeogr 13: 209–19.
© The Ecological Society of America www.frontiersinecology.or gNo-analog communities JW Williams and ST Jackson
Jackson ST and Overpeck JT. 2000. Responses of plant populations Sakai A and Weiser CJ. 1973. Freezing resistance of trees in North
482 and communities to environmental changes of the late America with reference to tree regions. Ecology 54: 118–26.
Quaternary. Paleobiol 26S: 194–220. Schneider SH and Root TL. 1998. Climate change. In: Mac MJ,
Jackson ST and Williams JW. 2004. Modern analogs in Quaternary Opler PA, Puckett Haeker CE, and Doran PD (Eds). Status and
paleoecology: here today, gone yesterday, gone tomorrow? trends of the nation’s biological resources. Reston, VA: US
Annu Rev Earth Pl Sc 32: 495–537. Geological Survey.
Kirilenko AP and Solomon AM. 1998. Modeling dynamic vegeta- Siegenthaler U, Stocker TF, Monnin E, et al. 2005. Stable carbon
tion response to rapid climate change using bioclimatic classifi- cycle–climate relationship during the late Pleistocene. Science
cation. Climatic Change 38: 15–49. 310: 1313–17.
Kitamura A. 2004. Effects of seasonality, forced by orbital–insola- Spahni R, Chappellaz J, Stocker TF, et al. 2005. Atmospheric
tion cycles, on offshore molluscan faunal change during rapid methane and nitrous oxide of the late Pleistocene from
warming in the Sea of Japan. Palaeogeogr Palaeocl 203: 169–78. Antarctic ice cores. Science 310: 1317–21.
Kutzbach JE, Gallimore R, Harrison SP, et al. 1998. Climate and Stafford Jr TW, Semken Jr HA, Graham RW, et al. 1999. First
biome simulations for the past 21 000 years. Quaternary Sci Rev accelerator mass spectrometry 14C dates documenting contem-
17: 473–506. poraneity of non-analog species in late Pleistocene mammal
Marsiat I and Valdes PJ. 2001. Sensitivity of the northern hemi- communities. Geology 27: 903–06.
sphere climate of the last glacial maximum to sea surface tem- Thomas CD, Cameron A, Green RE, et al. 2004. Extinction risk
peratures. Clim Dynam 17: 233–48. from climate change. Nature 427: 145–48.
Martínez-Meyer E, Peterson AT, and Hargrove WW. 2004. Ecological Thompson RS, Anderson KH, and Bartlein PJ. 1999. Atlas of rela-
niches as stable distributional constraints on mammal species, tions between climatic parameters and distributions of impor-
with implications for Pleistocene extinctions and climate change tant trees and shrubs in North America: hardwoods. Denver,
projections for biodiversity. Global Ecol Biogeogr 13: 305–14. CO: US Geological Survey. Professional paper 1650-B.
McLachlan JS, Clark JS, and Manos PS. 2005. Molecular indica- Thuiller W, Lavorel S, Araújo MB, et al. 2005. Climate change
tors of tree migration capacity under rapid climate change. threats to plant diversity in Europe. Proc Natl Acad Sci USA
Ecology 86: 2088–98. 102: 8245–50.
Milton SJ. 2003. “Emerging ecosystems”: a washing-stone for ecol- Walther G-R, Post E, Convey P, et al. 2002. Ecological responses to
ogists, economists, and sociologists? S Afr J Sci 99: 404–06. recent climate change. Nature 416: 389–95.
Mix AC, Morey AE, Pisias NG, and Hostetler SW. 1999. Webb III T, Shuman BN, and Williams JW. 2004. Climatically
Foraminiferal faunal estimates of paleotemperature: circum- forced vegetation dynamics in North America during the late
venting the no-analog problem yields cool ice age tropics. Quaternary period. In: Gillespie AR, Porter SC, and Atwater
Paleoceanography 14: 350–59. BF (Eds). The Quaternary period in the United States.
Morgan AV and Morgan A. 1980. Faunal assemblages and distribu- Amsterdam, Netherlands: Elsevier.
tional shifts of Coleoptera during the late Pleistocene of Canada Whitmore J, Gajewski K, Sawada M, et al. 2005. North American and
and the northern United States. Can Entomol 112: 1105–28. Greenland modern pollen data for multi-scale paleoecological
Ohlemüller R, Gritti ES, Sykes MT, and Thomas CD. 2006. and paleoclimatic applications. Quaternary Sci Rev 24: 1828–48.
Towards European climate risk surfaces: the extent and distrib- Williams JW, Jackson ST, and Kutzbach JE. 2007. Projected distri-
ution of analogous and non-analogous climates 1931–2000. butions of novel and disappearing climates by 2100 AD. Proc
Global Ecol Biogeogr 15: 395–405. Natl Acad Sci USA 104: 5738–42.
Overpeck JT, Webb RS, and Webb III T. 1992. Mapping eastern Williams JW, Shuman B, Bartlein PJ, et al. 2006. An atlas of
North American vegetation change of the past 18 ka: no- pollen–vegetation–climate relationships for the United States
analogs and the future. Geology 20: 1071–74. and Canada. Dallas, TX: American Association of Strati-
Overpeck JT, Whitlock C, and Huntley B. 2003. Terrestrial bios- graphic Palynologists Foundation.
phere dynamics in the climate system: past and future. In: Williams JW, Shuman BN, and Webb III T. 2001. Dissimilarity
Bradley RS, Pedersen TF, Alverson KD, and Bergmann KF analyses of late-Quaternary vegetation and climate in eastern
(Eds). Paleoclimate, global change and the future. Berlin, North America. Ecology 82: 3346–62.
Germany: Springer-Verlag. Williams JW, Shuman BN, Webb III T, et al. 2004. Late Quaternary
Owen-Smith N. 1987. Pleistocene extinctions: the pivotal role of vegetation dynamics in North America: scaling from taxa to
megaherbivores. Paleobiology 13: 351–62. biomes. Ecol Monogr 74: 309–34.
Prentice IC, Bartlein PJ, and Webb III T. 1991. Vegetation and cli- Willis KJ, Rudner E, and Sümegi P. 2000. The full-glacial forests
mate changes in eastern North America since the last glacial of central and southeastern Europe. Quaternary Res 53:
maximum: a response to continuous climatic forcing. Ecology 203–13.
72: 2038–56. Wing SL, Harrington GJ, Smith FA, et al. 2005. Transient floral
Robinson GS. 2005. Landscape paleoecology and megafaunal change and rapid global warming at the Paleocene–Eocene
extinction in southeastern New York State. Ecol Monogr 75: boundary. Science 310: 993–96.
295–315. Wu H, Guiot J, Brewer S, et al. 2007. Dominant factors controlling
Sage RF and Coleman JR. 2001. Effects of low atmospheric CO2 on glacial and interglacial variations in the treeline elevation in
plants: more than a thing of the past. Trends Plant Sci 6: 18–24. tropical Africa. Proc Natl Acad Sci USA 104: 9720–24.
www.fr ontiersinecology.or g © The Ecological Society of AmericaYou can also read