NOVELIS Q2 FISCAL 2020 EARNINGS CONFERENCE CALL - Steve Fisher President and Chief Executive Officer

Page created by Jamie Jacobs
 
CONTINUE READING
NOVELIS Q2 FISCAL 2020 EARNINGS CONFERENCE CALL - Steve Fisher President and Chief Executive Officer
NOVELIS Q2 FISCAL 2020
  EARNINGS CONFERENCE CALL
 November 6, 2019

 Steve Fisher
 President and Chief Executive Officer
 Dev Ahuja
 Senior Vice President and Chief Financial Officer

© 2019 Novelis
NOVELIS Q2 FISCAL 2020 EARNINGS CONFERENCE CALL - Steve Fisher President and Chief Executive Officer
SAFE HARBOR STATEMENT

Forward-looking statements
Statements made in this presentation which describe Novelis' intentions, expectations, beliefs or predictions may be forward-
looking statements within the meaning of securities laws. Forward-looking statements include statements preceded by, followed by,
or including the words "believes," "expects," "anticipates," "plans," "estimates," "projects," "forecasts," or similar
expressions. Examples of forward looking statements in this news release are statements about our expectation that the proposed
Aleris acquisition will close by the outside date under the merger agreement, subject to closing conditions and regulatory
approvals. Novelis cautions that, by their nature, forward-looking statements involve risk and uncertainty and Novelis' actual results
could differ materially from those expressed or implied in such statements. We do not intend, and we disclaim any obligation, to
update any forward-looking statements, whether as a result of new information, future events or otherwise. Factors that could
cause actual results or outcomes to differ from the results expressed or implied by forward-looking statements include, among
other things: changes in the prices and availability of aluminum (or premiums associated with such prices) or other materials and
raw materials we use; the capacity and effectiveness of our hedging activities; relationships with, and financial and operating
conditions of, our customers, suppliers and other stakeholders; fluctuations in the supply of, and prices for, energy in the areas in
which we maintain production facilities; our ability to access financing including in connection with potential acquisitions and
investments; risks relating to, and our ability to consummate, pending and future acquisitions, investments or divestitures, including
the proposed acquisition of Aleris Corporation; changes in the relative values of various currencies and the effectiveness of our
currency hedging activities; factors affecting our operations, such as litigation, environmental remediation and clean-up costs, labor
relations and negotiations; breakdown of equipment and other events; economic, regulatory and political factors within the
countries in which we operate or sell our products, including changes in duties or tariffs; competition from other aluminum rolled
products producers as well as from substitute materials such as steel, glass, plastic and composite materials; changes in general
economic conditions including deterioration in the global economy; changes in government regulations, particularly those affecting
taxes, derivative instruments, environmental, health or safety compliance; changes in interest rates that have the effect of
increasing the amounts we pay under our credit facilities and other financing agreements; and our ability to generate cash. The
above list of factors is not exhaustive. Other important risk factors are included under the caption "Risk Factors" in our Annual
Report on Form 10-K for the fiscal year ended March 31, 2019.

© 2019 Novelis                                                                                                                     2
NOVELIS Q2 FISCAL 2020 EARNINGS CONFERENCE CALL - Steve Fisher President and Chief Executive Officer
Q2FY20 BUSINESS HIGHLIGHTS

    Excellent operational performance                Trailing Twelve Month ending September 30 Shipments
                                                      (kilotonnes)

            Improving recovery & quality              3,400
                                                                                                        3,335
                                                       3,300
            Unlocking capacity
                                                                                              3,205
                                                       3,200
            Increasing customer satisfaction                                3,095
                                                                                     3,126
                                                       3,100         3,071

    Broadly favorable market conditions
                                                       3,000
     and demand, particularly in                                     FY16    FY17    FY18     FY19      FY20

     Beverage Can
                                                      Trailing Twelve Month ending September 30 Adjusted EBITDA
    Strong financial position                        ($ millions)

                                                      $1,500                                           1,425
            Q2FY20 Adjusted EBITDA/ton $448          $1,400                                 1,313
                                                      $1,300
            Strong liquidity position $1.8 billion   $1,200
                                                                             1,053
                                                                                     1,138
                                                      $1,100
                                                      $1,000
            Net leverage further improved to 2.4x      $900
                                                                      890

                                                        $800
    All major strategic capacity                       $700
                                                                     FY16    FY17    FY18    FY19      FY20
     expansion projects are on track
    © 2019 Novelis                                                                                          3
NOVELIS Q2 FISCAL 2020 EARNINGS CONFERENCE CALL - Steve Fisher President and Chief Executive Officer
END MARKET HIGHLIGHTS

    Beverage Can                 Automotive                     Specialties
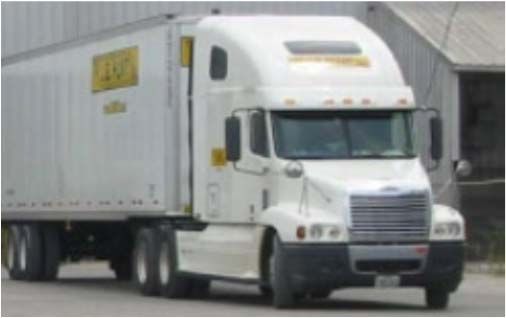
   Demand trends strong        Exposure to trucks,          North America tailwinds
    globally                     SUVs, electric &              reducing
   Growth in emerging           premium vehicles             Increasing competition
    markets                     North America market          with Chinese imports in
   Package mix shift from       remains strong                regions outside U.S.
    other substrates to         Broad aluminization          Novelis capacity
    aluminum                     trend throughout Europe       constraints create
   New beverage types          Some challenges in            opportunities for portfolio
    released in aluminum         Europe due to exposure        optimization
   Rising consumer              to one large customer
    preference favors           Trade war/weak
    sustainable aluminum         consumer confidence in
    packaging                    China

    © 2019 Novelis                                                                  4
NOVELIS Q2 FISCAL 2020 EARNINGS CONFERENCE CALL - Steve Fisher President and Chief Executive Officer
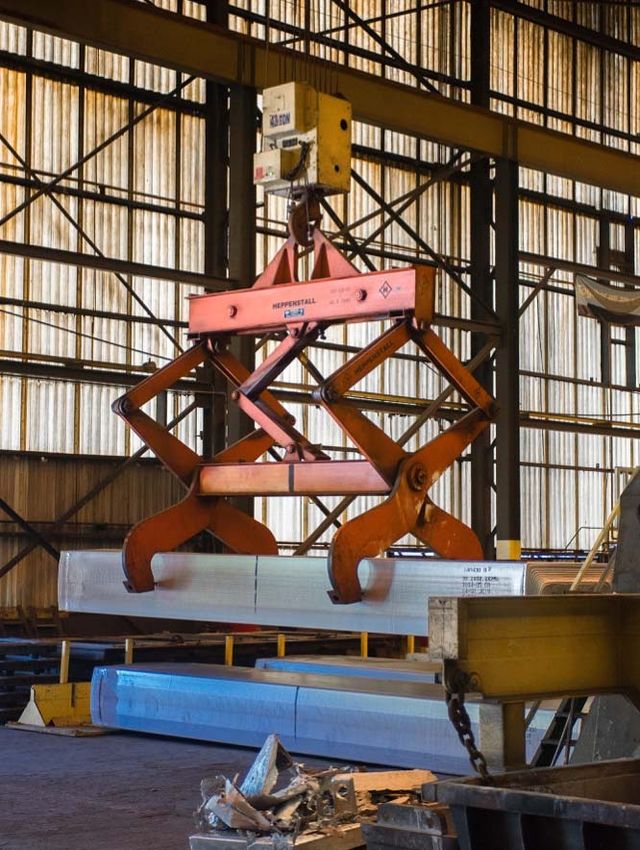
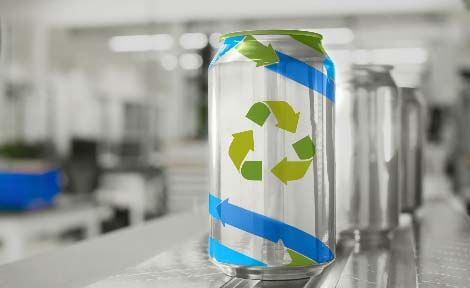
SUSTAINABILITY JOURNEY CONTINUES

       Novelis is the world’s largest recycler of aluminum
       Support increased consumer demand for sustainable products in
        Beverage Packaging, Automotive, and Specialty markets
               FY19 recycled content in our products at 61%
               Leveraging Customer Solution Centers
                                                                                     Berea
               Expanding closed-loop recycling systems                             Recycling

       Recently announced US recycling
        expansion                                      Guthrie
                                                    Auto finishing
                                                                                            Greensboro
                                                                                             Recycling

               $36 million capital investment in                      Logan
                                                                     rolling mill
                Greensboro, Georgia
               Expands capacity to recycle
                automotive aluminum scrap

                           Shaping a sustainable world together
    © 2019 Novelis                                                                                       5
ALERIS ACQUISITION UPDATE

     Continue to work through regulatory and closing process
             Conditional approval granted in Europe, pending divestment of Duffel plant
             Clear path to approval in the US
             China discussions in process
     Expected to close the transaction by January 21, 2020, the outside date
      under the merger agreement, subject to closing conditions and
      regulatory approvals

    © 2019 Novelis                                                                  6
FINANCIAL HIGHLIGHTS

© 2019 Novelis
Q2 FISCAL 2020 FINANCIAL HIGHLIGHTS
    Q2FY20 vs Q2FY19
                                                                                                       Quarterly Adjusted EBITDA ($ millions)
      Net income of $123 million                                                                      400
                                                                                                                                                                 372             374
                                                                                                       375
                  Excluding tax-effected special                                                                   355                           357
                                                                                                       350
                   items*, net income of $160 million                                                                              322
                                                                                                       325
                   compared to $122 million in the                                                     300
                   prior year                                                                          275
                                                                                                       250
                  Q2 FY20 $32 million restructuring

      Adjusted EBITDA up 5% from
       $355 million to $374 million
                                                                                                       Quarterly Adjusted EBITDA per ton ($)
      Adjusted EBITDA per ton $448                                                                    475
                                                                                                                                                                  448            448
                                                                                                       450          440
      Sales down 9% to $2.9 billion on                                                                425                                        410
       lower LME prices and local                                                                      400
                                                                                                                                   403

       market premiums                                                                                 375

                                                                                                       350
      Total FRP Shipments up 3% to
       835 kilotonnes

    © 2019 Novelis                                                                                                                                                                     8
*Tax-effected special items may include restructuring & impairment, metal price lag, gain/loss on assets held for sale, loss on extinguishment of debt, loss on sale of business, business
acquisition and other integration costs.
Q2 ADJUSTED EBITDA BRIDGE
$ Millions

                       23           7
                                                                             374
                                                                  3

        355                                      (14)

       Q2FY19        Volume      Price/Mix   Operating Cost   FX, SG&A and   Q2FY20
                                                                  Other

                 Maximizing our capacity, optimizing the portfolio
© 2019 Novelis                                                                        9
FREE CASH FLOW AND NET LEVERAGE

    $ Millions                                             YTD      YTD     Net Leverage ratio
                                                           FY20     FY19    Net debt/TTM Adjusted EBITDA

     Adjusted EBITDA                                         746    689     5.0

                                                                            4.5
     Interest paid                                          (116)   (122)
                                                                            4.0
     Taxes paid                                             (99)    (95)
                                                                            3.5
     Working capital & other                               (213)    (254)
                                                                            3.0
     Free cash flow before CapEx                             318    218                                    2.4
                                                                            2.5
     Capital expenditures                                  (300)    (114)   2.0

     Free cash flow                                          18     104
    Prior period is adjusted to conform to current presentation

 Free cash flow before capital expenditures increased 46%
        Higher adjusted EBITDA
        Lower working capital outflow
 YTD capital expenditures $300 million, primarily to support strategic
  capacity expansions
 Net leverage ratio decreased to 2.4x

  © 2019 Novelis                                                                                            10
SUMMARY

© 2019 Novelis
SUMMARY

       Overall excellent operating
        performance in broadly favorable
        market conditions driving record
        results
       Delivering high-quality,
        sustainable, innovative products to
        customers
       Strategic investments to enhance
        our product portfolio, expand
        recycling operations, and
        strengthen our business for the
        long term are on time and on
        budget

    © 2019 Novelis                            12
THANK YOU
                  QUESTIONS?

© 2019 Novelis
APPENDIX

© 2019 Novelis
NET INCOME RECONCILIATION TO ADJUSTED EBITDA

                                                                                                                          Q1     Q2
  (in $ m)                                                                          Q1     Q2     Q3     Q4     FY19
                                                                                                                         FY20   FY20

  Net income attributable to our common shareholder                                 137    116     78    103     434     127    123

  - Noncontrolling interests                                                          -      -      -      -      -        -      -
  - Income tax provision                                                             53     64     37     48     202      63     45
  - Interest, net                                                                    63     66     64     65     258      62     58
  - Depreciation and amortization                                                    86     86     88     90     350      88     88

  EBITDA                                                                            339    332    267    306    1,244    340    314

  - Unrealized (gain) loss on derivatives                                             4     (1)     6      1     10       (6)    (3)
  - Realized (gain) loss on derivative instruments not included in segment income     -     (1)     -     (1)    (2)       2      1
  - Proportional consolidation                                                       16     15     14     13     58       15     14
  - (Gain) loss on sale of fixed assets                                               3     (1)     2      2      6       (1)    (1)
  - Restructuring and impairment, net                                                 1      -      1      -      2        1     32
  - Metal price lag (income) expense                                                (33)    (1)    13     25      4        2      5
  - Business acquisition and other integration costs                                  2      8     14      9     33       17     12
  - Other, net                                                                        2      4      5      2     13        2      -

  Adjusted EBITDA                                                                   $334   $355   $322   $357   $1,368   $372   $374

© 2019 Novelis                                                                                                                         15
FREE CASH FLOW AND LIQUIDITY

                                                                                                                                 Q1         Q2
                                                           (in $ m)        Q1          Q2         Q3        Q4       FY19
                                                                                                                                FY20       FY20

 Cash provided by (used in) operating activities                           48        162         114        404       728         57        240
 Cash provided by (used in) investing activities                           (52)     (291)        (91)      (123)     (557)      (149)      (127)
 Plus: Cash used in the acquisition of assets under a
                                                                            -        239             -         -      239          -          -
 capital lease
 Less: (proceeds) outflows from sale of assets, net of
                                                                            -           (2)          -         -      (2)        (2)        (1)
 transaction fees, cash income taxes and hedging

Free cash flow                                                             $(4)     $108         $23       $281      $408       $(94)      $112

Capital expenditures                                                       54           60        96        141       351        162        138

“Free cash flow” consists of: (a) “net cash provided by (used in) operating activities,” (b) plus "net cash provided by (used in) investing
activities” (c) plus cash used in the “Acquisition of assets under a capital lease”, and (d) less “proceeds from sales of assets and business, net
of transaction fees, cash income taxes and hedging”. All prior periods presented conform to the presentation adopted for the current period.

                                                                                                                                Q1         Q2
                                                      (in $ m)       Q1           Q2           Q3         Q4       FY19
                                                                                                                               FY20       FY20

 Cash and cash equivalents                                           853          829          797        950       950         859        935
 Availability under committed credit facilities                    1,059          907          884        897       897         870        875

 Liquidity                                                         $1,912       $1,736        $1,681     $1,847    $1,847     $1,729     $1,810

© 2019 Novelis                                                                                                                                       16
You can also read