November 2018 - Monetary Authority of Singapore
←
→
Page content transcription
If your browser does not render page correctly, please read the page content below
November 2018

November 2018
Macroprudential Surveillance Department
 Monetary Authority of Singapore
ISSN 1793-3463

Published in November 2018

Macroprudential Surveillance Department
Monetary Authority of Singapore

http://www.mas.gov.sg

All rights reserved. No part of this
publication may be reproduced, stored in a
retrieval system or transmitted in any form
or by any means, electronic, mechanised,
photocopying, recording or otherwise,
without the prior written permission of the
copyright owner except in accordance with
the provisions of the Copyright Act (Cap. 63).
Applications for the copyright owner’s
written permission to reproduce any part of
this publication should be addressed to:

Macroprudential Surveillance Department
Monetary Authority of Singapore
10 Shenton Way
MAS Building
Singapore 079117
Financial Stability Review, November 2018

 PREFACE i

 OVERVIEW ii

 1 GLOBAL ENVIRONMENT
 Risks in the External Environment 1
 Box A: Do Exchange-traded Funds Pose Procyclicality Risks? – A 6
 Comparison with Open-ended Funds
 Box B: Monitoring Digital Token Markets: An Early Look at Frameworks 10
 and Techniques
 Box C: A Framework to Assess the Implications of Cyber Risk on 16
 Financial Stability
 2 SINGAPORE FINANCIAL SECTOR
 Risks in the Banking Sector 24
 Chart Panel 2A: Credit Growth Trends 29
 Chart Panel 2B: Cross-border Lending Trends 30
 Chart Panel 2C: Asset Quality and Liquidity Indicators 31
 Chart Panel 2D: Local Banking Groups 32
 Chart Panel 2E: Insurance Sector 33
 Chart Panel 2F: Over-the-counter Derivatives 34
 Box D: Top-Down Stress Test 2018: Leveraging on Granular Housing 35
 Loan Data
 Box E: Assessing the Effects of Post-crisis Regulatory Reforms on 38
 Liquidity in the Singapore Government Securities and MAS Bills
 Market
 Box F: A Review of the Small and Medium-sized Enterprise Financing 46
 Landscape in Singapore
 Box G: An Overview of the Securities Financing Market in Singapore 52
 Box H: Drivers of Domestic Loans ― Do Spillover Effects of 58
 Macroprudential Policies Matter?
 3 SINGAPORE CORPORATE SECTOR
 Risks in the Corporate Sector 65
 Chart Panel 3A: Small and Medium-Sized Enterprise Financing 72
 Conditions
 Box I: Early Identification of Corporate Distress in Singapore 73
 4 SINGAPORE HOUSEHOLD SECTOR
 Risks in the Household Sector 78
 Box J: Update on the Private Residential Property Market 82

Monetary Authority of Singapore Macroprudential Surveillance Department
Financial Stability Review, November 2018

Statistical appendix may be accessed from:
http://www.mas.gov.sg/regulations-and-financial-stability/financial-stability.aspx

Disclaimer: MAS is not liable for any damage or loss of any kind, howsoever caused as a result (direct
or indirect) of the use of any information or data contained in this publication, including but not limited
to any damage or loss suffered as a result of reliance on the information or data contained in or
available in this publication. You are reminded to observe the terms of use of the MAS website, on
which this publication is made available.

Monetary Authority of Singapore Macroprudential Surveillance Department
Financial Stability Review, November 2018 Definitions and Conventions As used in this report, the term “country” does not in all cases refer to a territorial entity that is a state as understood by international law and practice. As used here, the term also covers some territorial entities that are not states but for which statistical data are maintained on a separate and independent basis. In this report, the following groupings are used: “ASEAN” comprises Brunei, Cambodia, Indonesia, Laos, Malaysia, Myanmar, the Philippines, Singapore, Thailand and Vietnam “Asia-10” comprises China (CHN), Hong Kong (HK), India (IND), Indonesia (IDN), Korea (KOR), Malaysia (MYS), the Philippines (PHL), Singapore (SGP), Taiwan (TWN) and Thailand (THA) “Euro zone” comprises Austria, Belgium, Cyprus, Estonia, Finland, France, Germany, Greece, Ireland, Italy, Latvia, Lithuania, Luxembourg, Malta, Netherlands, Portugal, Slovakia, Slovenia and Spain “European Union” (EU) comprises the euro zone, Bulgaria, Croatia, Czech Republic, Denmark, Hungary, Poland, Romania, Sweden and the United Kingdom (UK) “G3” refers to the euro zone and United Kingdom, Japan, and the United States (US) “G7” refers to Canada, France, Germany, Italy, Japan, the United Kingdom and the United States “G20” refers to the Group of Twenty comprising Argentina, Australia, Brazil, Canada, China, France, Germany, India, Indonesia, Italy, Japan, Korea1, Mexico, Russia, Saudi Arabia, South Africa, Turkey, the United Kingdom, the United States and the European Union Abbreviations used for financial data are as follows: Currencies: Chinese Renminbi (RMB), Euro (EUR), Hong Kong Dollar (HKD), Indian Rupee (INR), Indonesian Rupiah (IDR), Japanese Yen (JPY), Korean Won (KRW), Malaysian Ringgit (MYR), Philippine Peso (PHP), Singapore Dollar (SGD), Taiwan Dollar (TWD), Thai Baht (THB), Vietnamese Dong (VND), US Dollar (USD) Other Abbreviations: ABS Association of Banks in Singapore ABSD Additional Buyer’s Stamp Duty ACRA Accounting and Corporate Regulatory Authority of Singapore ADB Asian Development Bank AMF Autorité des marchés financiers ATO Asset Turnover AUM Assets Under Management B&C Building and Construction BCBS Basel Committee on Banking Supervision BIS Bank for International Settlements BoE Bank of England BoJ Bank of Japan BPS Basis Points BTC Bitcoin CAR Capital Adequacy Ratio 1 Republic of Korea Monetary Authority of Singapore Macroprudential Surveillance Department
Financial Stability Review, November 2018

 CBOE Chicago Board Options Exchange
 CBS Credit Bureau Singapore
 CCP Central Counterparty
 CCR Core Central Region
 CCS Credit Counselling Singapore
 CCyB Countercyclical Capital Buffer
 CGIO Centre for Governance, Institutions and Organisations
 CPI Consumer Price Index
 CPMI Committee on Payments and Market Infrastructures
 DBU Domestic Banking Unit
 DDRS DTCC Data Repository (Singapore) Pte Ltd
 DiD Difference-in-Differences
 DOS Department of Statistics
 D-SIBs Domestic Systemically Important Banks
 DTCC Depository Trust & Clearing Corporation
 EBIT Earnings Before Interest and Tax
 EBITDA Earnings Before Interest and Tax, Depreciation and Amortisation
 EC European Commission
 ECB European Central Bank
 ECF Equity Crowdfunding
 EM Emerging Markets
 EMEA Europe, Middle East and Africa
 EPFR Emerging Portfolio Fund Research
 ETF Exchange-Traded Fund
 FI Financial Institution
 FinTech Financial Technology
 FSB Financial Stability Board
 FSI Financial Stress Index
 FSR Financial Stability Review
 FX Foreign Exchange
 GDP Gross Domestic Product
 GFC Global Financial Crisis
 GFMA Global Financial Markets Association
 GFSR Global Financial Stability Report
 GLS Government Land Sales
 HCE Household Consumption Expenditure
 ICR Interest Coverage Ratio
 IE International Enterprise
 IIF Institute of International Finance
 IMF International Monetary Fund
 INFRA Infrastructure Recovery and Assets
 IORP Institution for Occupational Retirement Provision
 IOSCO International Organisation of Securities Commissions
 IPTO Insolvency and Public Trustee’s Office
 IR Interest Rate
 ISCA Institute of Singapore Chartered Accountants
 ISDA International Swaps and Derivatives Association
 IWST Industry-Wide Stress Test
 JFMC Japan Financial Markets Council
 LCR Liquidity Coverage Ratio
 LGD Loss Given Default

Monetary Authority of Singapore Macroprudential Surveillance Department
Financial Stability Review, November 2018

 LR Leverage Ratio
 LTD Loan-to-Deposit
 LTV Loan-to-Value
 M&OE Marine and Offshore Engineering
 MAS Monetary Authority of Singapore
 MDR Merchant Discount Rate
 MMO Money Market Operations
 MOVE Merrill Lynch Option Volatility Estimate index
 NBFI Non-Bank Financial Institutions
 NFC Non-Financial Corporate
 NIM Net Interest Margin
 NPA Non-Performing Asset
 NPL Non-Performing Loan
 NSFR Net Stable Funding Ratio
 NUS National University of Singapore
 O&G Oil and Gas
 OCR Outside Central Region
 OECD Organisation of Economic Co-operation and Development
 OEF Open-Ended Funds
 OIF Offshore Insurance Fund
 OSV Offshore Support Vessel
 OTC Over-the-Counter
 P2P Peer-to-Peer
 PCA Principal Component Analysis
 PD Probability of Default
 RCR Rest of Central Region
 ROA Return on Assets
 SBF Singapore Business Federation
 SCF Securities-based Crowdfunding
 SEACEN South East Asian Central Banks
 SEC Securities and Exchange Commission
 SFA Securities and Futures Act
 SFT Securities Financing Transactions
 SGS Singapore Government Securities
 SGTI Singapore Governance and Transparency Index
 SGX Singapore Exchange Limited
 SIBOR Singapore Interbank Offered Rate
 SME Small and Medium-Sized Enterprise
 SPRING Standards, Productivity and Innovation Board
 SWF Sovereign Wealth Fund
 TCH The Clearing House
 TSC Transport, Storage and Communications
 URA Urban Redevelopment Authority
 VAR Vector Auto Regressive
 VIX CBOE Volatility Index
 YoY Year-on-Year

Monetary Authority of Singapore Macroprudential Surveillance Department
Financial Stability Review, November 2018 i

PREFACE

The Monetary Authority of Singapore (MAS) conducts regular assessments of
Singapore’s financial system. Potential risks and vulnerabilities are identified, and the
ability of the financial system to withstand potential shocks is reviewed. The analyses
and results are published in the annual Financial Stability Review (FSR). The FSR aims
to contribute to a better understanding of issues affecting Singapore’s financial system
among market participants, analysts and the public.

Section 1 of the FSR provides a discussion of the risks in the external environment.
This is followed by an analysis of the Singapore financial sector in Section 2. Finally, a
review of the corporate and household sectors is provided in Sections 3 and 4
respectively.

The production of the FSR was coordinated by the Macroprudential Surveillance
Department (MSD) team that comprises Andrew Tan, Kenneth Gay, Ng Heng Tiong,
Lily Chan, Alex Phua, Aloysius Lim, Ang Shu Qin, Angeline Lam, Cheryl Ho, Choo Chian,
Denise Yeo, Evelyn Chen, Gael Soon, Howie Lee, Koh Zhi Xing, Kong Yu Chien, Kwek
Kiat Cong, Lim Yong Long, Moses Soh, Tan Aik Khim, Teoh Shi-Ying, Wendy Lee, Wong
Jian Xiang, and Wong Siang Leng under the general direction of Rosemary Lim,
Executive Director (MSD) and Loo Siew Yee, Assistant Managing Director (Policy, Risk
& Surveillance). The FSR also incorporates contributions from Banking Departments I,
II & III, Capital Markets Intermediaries Departments I, II & II, Data Analytics Group,
Economic Policy Group, Insurance Department, Markets Policy & Infrastructure
Department, Monetary & Domestic Markets Management Department, Prudential
Policy Department and Technology Risk & Payments Department, and Baskar
Chinniah, Jonathan Ng, Jong Zhi Kai, Satish Nagdev and See Kwong Ee. The FSR reflects
the views of the staff of MSD and the contributing departments.

The FSR may be accessed in PDF format on the MAS website:
http://www.mas.gov.sg/en/Regulations-and-Financial-Stability/Financial Stability.aspx

Monetary Authority of Singapore Macroprudential Surveillance Department
Financial Stability Review, November 2018 ii

OVERVIEW

 Risks to global financial stability have The property market cooling measures in July
 increased, amid tighter financial conditions 2018 have moderated the pace of price
 and trade tensions increases and transaction activity. This will
 contribute to stronger household balance
Tightening global financial conditions have sheet positions over the medium term.
caused capital outflows from the region, and
could create further pressures on regional Looking ahead, Singapore corporates, banks
currencies and the debt servicing abilities of and households need to guard against rising
sovereigns, corporates and households. headwinds

 While trade tensions have had limited impact
Vulnerabilities in emerging market (EM)
 on Singapore thus far, the negative spillovers
economies have been exacerbated by global
 could weigh on future corporate profitability
trade tensions. A protracted trade conflict
 through lower earnings. Tightening financial
could have wider ramifications on global
 conditions could also strain the debt servicing
economic growth through dampened business
 ability of over-leveraged firms. Firms should
confidence, investment and productivity.
 exercise financial prudence and take steps to
Singapore’s banking system, corporate, and reduce balance sheet vulnerabilities.
 household fundamentals remain resilient
 An abrupt tightening of global financial
Singapore’s banking system remains resilient
 conditions could accentuate foreign currency
despite increased uncertainty. Loan growth
 liquidity risks in the Singapore banking system.
was healthy over the past year, while overall Banks need to actively monitor and manage
asset quality has improved. MAS assesses that their foreign currency liquidity risks as they
domestic credit growth remains in line with expand their cross-border lending activities.
economic conditions and does not observe any
broad-based domestic credit overheating at Households should continue to be cognisant of
this juncture. Hence, MAS will maintain the their ability to service their debt, given the
Countercyclical Capital Buffer (CCyB) at 0%.
 headwinds of rising interest rates. With rental
 yields expected to remain weak, households
Corporate balance sheets, including solvency should exercise prudence when taking up loans
and liquidity positions, have remained broadly to fund property purchases.
stable amid a supportive operating
environment. Firms in the trade-related MAS’ latest stress tests across the banking,
sectors benefitted from the uplift in the global corporate and household sectors indicate that
economy particularly in the earlier half of the the overall system is resilient. Nonetheless,
year, but those in domestic-oriented sectors continued vigilance is warranted as the
experienced a more uneven performance. likelihood of external shocks from tighter
 financial conditions and trade tensions
Household balance sheets have strengthened, materialising has increased, which in turn
alongside an improving employment outlook. raises the risks to financial stability.

Monetary Authority of Singapore Macroprudential Surveillance Department
Financial Stability Review, November 2018 1

1 Global Environment

Tighter global financial conditions have resulted in outflows from Asia, which create pressure on
regional currencies and could have negative implications for the debt servicing abilities of sovereigns,
corporates and households. Global trade tensions have exacerbated vulnerabilities in EM economies,
by posing downside risks to growth. In Europe, populist sentiment has resulted in heightened policy
uncertainty, adding to the ongoing uncertainty arising from the UK’s exit from the EU.

Existing and new technologies have spurred innovation that could transform the financial
intermediation landscape, but could also bring about new channels of risks. Policymakers must stay
vigilant and stand prepared to understand, pre-empt and mitigate risks associated with technology,
for instance from crypto-assets and cyber incidents.

Tightening Financial Conditions

 Tighter global financial conditions have Tighter global financial conditions sparked
 resulted in outflows from the region… renewed outflows from Asia since April 2018
 (Chart 1.1), after a period of strong inflows
Ongoing US monetary policy normalisation, particularly in equities.
buoyed by healthy US economic growth, has
cast a spotlight on vulnerabilities among some Thus far, there has been differentiated impact,
EMs. with EMs that are perceived to be more
 Chart 1.1 vulnerable bearing the brunt of the sell-off.
 Cumulative Net Flows: Asia-9
 Asia-9 Equities Asia-9 Bonds
 Among EM Asian economies, those with twin
 deficits coupled with short-term external
 100
 80
 funding needs (Chart 1.2) have been harder hit
 60 (Chart 1.3), even if their macroeconomic
 US$ Billion

 40 fundamentals are generally sound. These more
 20 vulnerable economies have had to take
 0
 measures to shore up their currencies,
 -20
 including by tightening domestic monetary
 -40
 Jan 08 Jan 11 Jan 14 Jan 17 Oct 18 policy or drawing down on reserves to support
 their currencies. These economies are also
Source: MAS estimates, Emerging Portfolio Fund
Research (EPFR) actively taking steps to narrow their current
Note: Asia-9 comprises Hong Kong, India, Indonesia, account deficits, for instance by raising import
Korea, Malaysia, the Philippines, Singapore, Taiwan and
Thailand.
 tariffs and re-evaluating import-intensive
 infrastructure projects.

Monetary Authority of Singapore Macroprudential Surveillance Department
Financial Stability Review, November 2018 2

 Chart 1.2 Further developments in the weaker Europe,
 Budget and Current Account Balance and Middle East and Africa (EMEA) and Latin
 Foreign Ownership in Local Currency
 America (LATAM) EMs could also lead to
 Government Debt Market
 (As of Q2 2018) broader EM aversion among investors.
 Budget Balance (% of GDP) Chart 1.4
 Current Account Balance (% of GDP)
 Selected EM Currencies Against the US Dollar
 Foreign Ownership in LCY Govt Debt Market (RHS)
 (% change from 8 to 13 August 20182)
 10 40
 TRYUSD ARSUSD INRUSD
 IDRUSD PHPUSD MYRUSD
Per Cent

 Per Cent
 5 20 0

 -5
 0 0

 % Change
 -10
 -5 -20
 India Indonesia Malaysia Thailand -15

Source: Haver Analytics, Institute of International -20
Finance (IIF)
 -25
 Source: MAS estimates, Bloomberg
 Chart 1.3
Selected Asian Currencies Against the US Dollar
 Indian Rupee Indonesian Rupiah
 Korean Won Malaysian Ringgit …creating further pressures on regional
 Philippines Peso Thai Baht currencies and debt servicing
 110
 Index (1 Jan 2018 = 100)

 105 Total borrowing by Asia-8 economies 3
 100 increased from 171% of gross domestic
 product (GDP) in 2007 to 255% of GDP in 2017,
 95
 with private sector USD-denominated debt
 90
 more than doubling.4
 85
 Jan 18 May 18 Sep 18 Nov 18
 A double whammy of currency depreciation
Source: MAS estimates, Bloomberg and rising interest rates brought about by the
 ongoing US monetary policy normalisation
 …amid signs of broader contagion within could weaken foreign currency debt servicing
 EMs… abilities of sovereigns, corporates and
 households, in particular those who have
EM Asian currencies experienced some
 upcoming maturities (Chart 1.5).
contagion from events in Turkey, at the peak of
the fall in value of the Turkish lira, though to a
smaller extent than other vulnerable EMs
(Chart 1.4).

2The Turkish lira experienced its largest fall in value from 3 China, Hong Kong, India, Indonesia, South Korea,
8 to 13 August 2018. Malaysia, Singapore and Thailand.
 4 The Institute of International Finance.

Monetary Authority of Singapore Macroprudential Surveillance Department
Financial Stability Review, November 2018 3

 Chart 1.5
Maturity Profile of USD-denominated Liabilities
 Global Trade Tensions
 of Selected Asia-10 Economies
 China Hong Kong India Rising trade tensions could pose downside
 Indonesia Malaysia Singapore
 200 risks to global growth
 South Korea Thailand

 150 EM vulnerabilities have also been exacerbated
US$ Billion

 by global trade tensions, which have risen in
 100
 intensity over the year.
 50
 Some impact can be seen in global equity
 0 markets (Chart 1.6), with larger sell-offs
 2018 2020 2022 2024
 observed following the announcement of the
Source: IIF tariffs on US$200 billion worth of China’s
Looking ahead, the impact of US tariff actions exports. Chinese and EM equities bore the
 brunt of the sell-offs and have continued to
could drive higher US inflation from costlier US
 underperform, despite the recent rebound.
imports, leading to faster-than-expected
monetary policy normalisation and a further Chart 1.6
tightening of financial conditions. This could Global Equity Indices
add to headwinds for EMs. MSCI China All Shares
 S&P 500
 MSCI EM
 EU STOXX
Against this backdrop of heightened volatility, $50bn Tariffs $200bn Tariffs
 120 Announced Announced
international organisations such as the
 Index (1 Jan 18 = 100)

 110
Financial Stability Board (FSB) and Bank for
 100
International Settlements (BIS) have expressed
 90
concerns that investment vehicles could
 80
potentially amplify market volatility during
 70
periods of market stress. Jan 18 Apr 18 Jul 18 Oct 18
 Source: MAS estimates, Thomson Reuters
Notwithstanding these potential market risks,
our comparative analysis of investment Chinese authorities have taken actions to
vehicles shows that exchange-traded fund promote economic stability amid growing
(ETF) flows display less indications of concerns over prolonged trade tensions, by
procyclicality compared to actively-managed easing their overall macro policy stance and
open-ended fund flows (See Box A “Do providing more liquidity in the banking system.
Exchange-traded Funds Pose Procyclicality
Risks? – A Comparison with Open-ended In the longer term, a protracted trade conflict
Funds”). would have wider ramifications on global
 economic activity through the confidence and
 investment channels.

 The global Purchasing Managers’ Index has
 already been easing (Chart 1.7), and growing

Monetary Authority of Singapore Macroprudential Surveillance Department
Financial Stability Review, November 2018 4

trade frictions could increasingly weigh on Chart 1.8
global growth. Market-implied Probabilities of Default for
 Selected European Economies
 Chart 1.7 Jan 2018 Oct 2018
 Global Purchasing Managers’ Index 35
 30
 25

 Per Cent
 20
 15
 10
 5
 0
 Greece Italy Portugal Spain Ireland

 Source: MAS estimates, Thomson Reuters
 Note: Based on market data on 5-year credit default
Source: Bloomberg swaps for sovereign bonds.

Political Uncertainty in Europe The UK’s path to leave the EU continues to be
 of concern. While progress has been made,
 uncertainty remains over the final terms of the
 Populist sentiment has resulted in
 UK’s exit. A disorderly Brexit could exacerbate
 heightened policy uncertainty in Europe
 the fragmentation of services provided by the
In Europe, geopolitical developments continue European financial system.
to bear watching. Concerns over rising
populism resurfaced in Italy’s 2018 general For instance, the UK is a major centre for
elections, where the anti-establishment Five investment banking in Europe. In the absence
Star Movement emerged with the highest of EU action, some EU clients will no longer be
number of votes. able to use the services of UK-based
 investment banks, and UK-based investment
Market uncertainty in Italy has remained banks may be unable to service existing cross-
elevated (Chart 1.8) amid ongoing discussions border contracts. The continuity of existing
between the European Commission (EC) and derivative contracts between UK and EU banks
Italy over Italy’s fiscal-loosening budget, with could also be disrupted.5
concerns that the populist platforms the ruling
coalition had campaigned on could drive larger Risks Associated with
fiscal deficits and contribute to an escalation of Technology
tensions with the EC.
 The increasing reliance on technology could
 bring about new channels of risks

 Existing and new technologies have spurred
 innovation that could transform the financial

5UK HM Treasury (August 2018), “Banking, Insurance and
Other Financial Services If There’s No Brexit Deal”.

Monetary Authority of Singapore Macroprudential Surveillance Department
Financial Stability Review, November 2018 5

intermediation landscape, but could also bring Rapid digitalisation and adoption of FinTech in
about new sources of risks. the financial sector also poses increasing cyber
 risk vulnerabilities. This has raised concerns
The rise in popularity of digital tokens could about the potential systemic implications of
create new pockets of vulnerabilities that cyber incidents on the financial system (See
warrant close monitoring, including the Box C “A Framework to Assess the Implications
potential wealth effects of a fall in digital token of Cyber Risk on Financial Stability”).
valuations (See Box B “Monitoring Digital
Token Markets: An Early Look at Frameworks Policymakers should stay vigilant and stand
and Techniques”). prepared to analyse, understand, pre-empt
 and mitigate these risks.

Monetary Authority of Singapore Macroprudential Surveillance Department
Financial Stability Review, November 2018 6

 Box A
 Do Exchange-traded Funds Pose Procyclicality Risks? – A Comparison with Open-ended Funds

 Assets invested in ETFs have quadrupled to over US$5 trillion in the past decade. Over the same period,
 ETFs’ share of total investment fund assets has grown from 2.5% to around 8.5%. 6 The growth of assets
 invested into ETFs, and the passive trading nature of the funds, have led to discussions internationally over
 potential procyclicality risks arising from ETF trading. In this box, we study the fund flow dynamics of ETFs
 against that of open-ended funds (OEFs).

 Empirical research into potential procyclicality risks posed by ETF trading has been fairly nascent
 Questions have been raised by international organisations such as the BIS, FSB and International Monetary
 Fund (IMF) over potential procyclicality risks associated with ETF trading. Such risks can be broadly
 characterised into two areas: (i) distortions to the underlying market, either through pricing inefficiency at
 the level of individual securities, or to aggregate price dynamics (for example, boosting market
 momentum), and (ii) amplification of market stress, if ETF market liquidity becomes impaired under certain
 circumstances. Market stress could be amplified should there be a liquidity mismatch between an ETF and
 the underlying securities which it references, or if authorised participants (APs) who are ETF liquidity
 providers step away from market-making during periods of market turbulence.7

 Research on these potential procyclicality risks posed by ETF trading has thus far been fairly nascent. Some
 studies have found indications of procyclicality risks where ETF ownership of securities has been associated
 with greater volatility in their underlying securities8, and where the growth of ETFs has been linked with
 EM capital flows becoming more sensitive to the global financial cycle.9 On the other hand, BIS found that
 although ETF flows in the secondary markets exhibited the largest inflows and outflows relative to their
 asset size – consistent with ETFs being associated with a wide array of trading and investment strategies –
 their flows offset each other over the weeks within an episode in some instances.10 In the primary markets,
 the French Autorité des marchés financiers (AMF) observed that ETF primary flows in the French and
 Eurozone equity markets appeared to be fairly countercyclical when compared against significant changes
 in index performance, and a Hong Kong Securities and Futures Commission (HK SFC) analysis suggested
 that there is no strong relationship between ETF primary flows and index returns in the Hong Kong equity
 market.11

6 ETFs passively track the index returns of specific benchmarks, and provide investors with low-cost access to a diversified
portfolio of securities. An increasing proportion of investors are using ETFs as mainstream financial products, and the trend
towards passive investing has drawn in not only individual investors but also institutional investors. Blackrock (2018), “Four
Big Trends to Drive ETF Growth”.
7 For instance, a liquidity wedge could emerge between ETF prices and those of the underlying securities during stressful

market conditions or large selling pressure from ETFs investors could overwhelm APs’ ability to support secondary market
liquidity, thus potentially amplifying shocks to primary asset markets.
8
 Ben-David, Franzoni, and Moussawi, NBER Working Paper No. 2007-1 (2014), “Do ETFs Increase Volatility?”.
9
 Converse, Levy-Yeyati and Williams, IIEP Working Paper 2018-1 (2018), “How ETFs Amplify The Global Financial Cycle in
Emerging Markets”.
10 BIS Quarterly Review (March 2018), “The Implications of Passive Investing for Securities Markets”.
11 France AMF (February 2017), “ETFs: Characteristics, Overview and Risk Analysis – The Case of the French Market”. HK SFC

(January 2018), “Research Paper on Hong Kong ETF Market and Topical Issues in the ETF Space”.

Monetary Authority of Singapore Macroprudential Surveillance Department
Financial Stability Review, November 2018 7

 Against this backdrop, we studied potential procyclicality risks posed by ETFs vis-à-vis that of OEFs
 We studied ETFs in relation to both actively-managed OEFs (active OEFs) and passively-managed OEFs
 (passive OEFs). Fund flow activities underlying ETFs and these two types of investment vehicles could have
 some similarities, driven by their respective investor base, in: (i) short-term fund flow dynamics between
 ETFs and active OEFs, given that investors previously invested in active OEFs are now increasingly switching
 at least part of their portfolio into ETFs; and (ii) long-term fund flow dynamics between ETFs and passive
 OEFs, given that such index-tracking products have increasingly drawn in a broader range of investor types
 such as institutional investors and financial advisers with longer-term investment horizons.12

 Using data from EPFR Global, we examined the fund flow activities of ETFs, passive OEFs and active OEFs
 in both global equity and global corporate bond markets spanning the US markets, developed markets ex-
 US (DM ex-US), and EM. In particular, we assessed whether flows into such investment vehicles tend to be
 returns-chasing, and whether large outflows typically occur during times of market turbulence. The panel
 regression from 2003 to 2018 takes the following form:

 = + − + + ,

 where Flowt denotes weekly ETF, passive OEF or active OEF fund flows as a percentage of total investment
 vehicles’ assets invested into each of these major regional equity and corporate bond markets. 13 The
 variable Returnt-1 denotes weekly returns of benchmark indices (region-specific MSCI equity indices for
 equities, and Bloomberg Barclays indices for corporate bonds) and is used to examine momentum-chasing
 behaviour. The variable Global Volatilityt is used to examine the impact stemming from external shocks
 (VIX for equities, and the Merrill Lynch Option Volatility Estimate index (MOVE) for corporate bonds).
 Finally, Controlk,t is a vector of macro variables to control for global macro-financial conditions.14

 In equity markets, the regression results suggest that ETF flows tend to be returns-chasing like active OEF
 flows, with the trend most pronounced in EMs
 In equity markets, a one percentage point increase in returns is associated with equity ETF flows increasing
 by 0.02 percent of total assets over a week (Chart A1).15 A similar relationship is found in the case of active
 OEF flows. This suggests that equity ETF flows tend to be returns-chasing – similar to active OEF flows –
 and equity ETF holders tend to increase purchases when markets rally. Such returns-chasing behaviour
 could potentially exacerbate aggregate market movements in a rising market. In terms of sensitivity to
 global financial shocks however, global risk aversion as proxied by the VIX was statistically insignificant in
 explaining equity ETF flows, unlike for active OEF flows. This suggests that ETF investors do not necessarily
 pull back from equity markets as much as active OEF investors do, in response to global financial shocks.

12 Greenwich Associates (Q3 2017), “Active Strategies, Indexing and the Rise of ETFs”.
13 To make a comparative assessment across the three investment vehicles, we separately considered ETF flows, passive OEF
flows as well as active OEF flows. On ETF flows, the analysis only considered passively-managed ETFs as actively-managed
ETFs (a) form a very small fraction of the total ETF assets (around 2%); and (b) are a fairly new development, with a
correspondingly shorter data set.
14 Global macro-financial conditions were proxied using the Goldman Sachs global economic surprise index, as well as the US

term premium. For corporate bonds, the study additionally controlled for region-specific macro-financial conditions, proxied
using Goldman Sachs Financial Conditions Index and bond yields in the respective regions.
15 In absolute terms, a one percentage point increase in returns is equivalent to ETF inflows of US$1065 million into the US

equity market (Chart A1). Given that the index returns of the US equity market over a typical week is 0.2%, the regression
results would suggest ETF inflows of US$213 million over a typical week.

Monetary Authority of Singapore Macroprudential Surveillance Department
Financial Stability Review, November 2018 8

 To examine the possibility that the degree of returns-chasing behaviour in equity ETF flows may vary
 between regions, the sample was split into three sub-samples: (i) US; (ii) DM ex-US; (iii) EM. The degree of
 returns-chasing behaviour appears to be most pronounced in the EM sub-sample (Chart A2). Specifically,
 a one percentage point increase in returns is associated with equity ETF flows increasing by 0.03 percent
 of total assets over a week in EM. Nevertheless, the extent of returns-chasing behaviour in the EM ETF
 flows remains lower than that of EM active OEF flows.

 Higher returns are associated with higher ETF …with returns-chasing behaviour in equity ETF
 flows to equities the following week… flows most pronounced in the EM sub-sample
 Chart A1 Chart A2
 Sensitivity of Equity Flows to a One Percentage Sensitivity of Equity Flows to a One Percentage
 Point Increase in Returns Point Increase in Returns By Region
 Net Flow Active OEF flows
 % of Total Assets (RHS) ETF flows (RHS)
 2000 0.03 % of Total Assets 0.06 0.06

 % of Total Assets
 % of Total Assets
 1500
 US$ Million

 0.02 0.04 0.04
 1000
 0.01 0.02 0.02
 500

 0 0.00 0.00 0.00
 ETF Active Passive US DM ex- EM
 OEF OEF US
 Source: MAS estimates, EPFR Source: MAS estimates, EPFR

 In corporate bond markets, ETF flows displayed signs of countercyclical behaviour, unlike active OEF
 flows
 The regression results for flows in the corporate bond markets show that a one percentage point increase
 in returns is associated with corporate bond ETF flows reducing by 0.03 percent of total assets over a week
 (Chart A3), which suggests some countercyclical behaviour. 16 In terms of sensitivity to global financial
 shocks, we find that corporate bond ETF flows tend to behave countercyclically. A one standard deviation
 increase in the MOVE is associated with corporate bond ETF flows increasing by 0.02 percent of total assets
 over a week (Chart A4). 17 In contrast, active OEF flows in corporate bond markets tend to be returns-
 chasing, suggesting that such flows tend to react procyclically in response to global financial shocks. A one
 percentage point increase in returns is associated with corporate bond active OEF flows increasing by 0.02
 percent of total assets over a week, and a one standard deviation increase in the MOVE is associated with
 a reduction in corporate bond active OEF flows by 0.05 percent of total assets over a week.

16 In absolute terms, a one percentage point increase in returns is equivalent to ETF outflows of US$761 million from the US
corporate bond market (Chart A3). Given that the index returns of the US corporate bond market over a typical week is 0.1%,
our regression results would suggest ETF outflows of US$76 million over a typical week.
17 In absolute terms, a one standard deviation increase in the MOVE is equivalent to ETF inflows of US$568 million in the US

corporate bond market (Chart A4).

Monetary Authority of Singapore Macroprudential Surveillance Department
Financial Stability Review, November 2018 9

 Higher returns are associated with lower ETF An increase in global stress is associated with
 flows to corporate bonds the following week higher ETF flows to corporate bonds
 Chart A3 Chart A4
 Sensitivity of Corporate Bond Flows to a One Sensitivity of Corporate Bond Flows to a One
 Percentage Point Increase in Returns Standard Deviation Increase in MOVE
 Net Flow Net Flow
 % of Total Assets (RHS) % of Total Assets (RHS)
 0.03 750 0.05
 500 0.02

 % of Total Assets

 % of Total Assets
 250
 0.01
 US$ Million

 US$ Million
 0.00
 0 0 -250
 -0.01 -750
 -0.05
 -500 -0.02
 -1250
 -0.03
 -1000 -0.04 -1750 -0.10
 ETF
 Active Passive ETF
 Active Passive
 OEF OEF^ OEF OEF^
 Source: MAS estimates, EPFR Source: MAS estimates, EPFR
 Note: ^ refers to non-significant variables. Note: ^ refers to non-significant variables.

 In conclusion, ETF flows display less indications of procyclicality compared to active OEF flows to date
 ETFs offer investors a low-cost option to a diversified portfolio with frequent onmarket trading. Such
 features have led to the rapid growth of ETF assets over the past few years, with the trend expected to
 continue. At present, while ETFs could potentially pose some market risks, our results illustrate that: (i)
 equity ETF flows tend to be returns-chasing but do not display signs of sensitivity to global shocks; and (ii)
 corporate bond ETF flows tend to behave countercyclically during normal and stressed market conditions.
 In contrast, active OEF flows in both equity and corporate bond markets tend to be more returns-chasing
 as well as “flighty” in times of global stress.

 Anecdotal evidence points to rising institutional participation in ETFs, particularly in Europe.18 Subject to
 data availability, one further area of study is whether the increasing participation of longer-term investors
 in ETFs could explain the less procyclical nature of ETFs vis-à-vis active OEFs.

 As the composition of trading and investment strategies using ETFs changes over time, the net resultant
 fund flow dynamics may also evolve. Continued study to better understand the interaction between ETFs
 and the markets in which they are invested would add to global policymakers’ understanding of any
 financial stability implications associated with ETFs.

18
 This trend of rising institutional participation in ETFs is particularly prevalent in Europe; the large ETF trade sizes observed
on Euronext has been attributed, in part, to institutional investors. In contrast, the bulk of active OEF users would likely be
retail investors. Central Bank of Ireland (2017), “Exchange Traded Funds Discussion Paper”. France AMF (February 2017),
“ETFs: Characteristics, Overview and Risk Analysis – The Case of the French Market”. ICI Viewpoint (June 2015), “The IMF on
Asset Management: Sorting the Retail and Institutional Investor Herds”.

Monetary Authority of Singapore Macroprudential Surveillance Department
Financial Stability Review, November 2018 10

 Box B
 Monitoring Digital Token Markets: An Early Look at Frameworks and Techniques

 Global interest in digital tokens, including from policymakers and international bodies such as the FSB19,
 has increased after digital token valuations grew substantially in 2017. This box presents a preliminary
 framework, techniques and data sources for monitoring digital token markets. The findings suggest that
 digital tokens do not currently pose a material risk to financial stability in Singapore but bear close
 monitoring.

 Rapid developments in digital token markets warrant close monitoring
 The total market capitalisation of digital tokens rose rapidly in 2017 to a peak of around US$800 billion in
 January 2018, but has since fallen to under US$300 billion (Chart B1), driven in part by security incidents at
 major trading platforms and increased regulatory scrutiny. 20 However, emerging signs of institutional
 interest in digital token markets 21 and the further evolution of blockchain technology to address the
 limitations of existing chains22, as well as development of products based on digital tokens e.g. digital token
 offerings, more commonly referred to as Initial Coin Offerings, could potentially drive renewed interest in
 digital tokens.

 Monitoring developments has proven to be a challenge as data on digital token markets is not readily
 available from conventional channels. Data from entities regulated by MAS show that the degree of
 interconnectedness between financial institutions (FIs) and digital token markets in Singapore is currently
 small. 23 However, the emergence of a digital token ecosystem (e.g. trading platforms, broker-dealers,
 wallet providers) that could fall outside regulators’ ambits calls for novel techniques and data sources to
 monitor digital tokens. Against this backdrop, MAS has undertaken work to strengthen our surveillance of
 digital token markets.

19 In July 2018, the FSB delivered a report to the G20 that (i) highlighted that digital tokens have raised issues around
consumer and investor protection, and in money laundering and terrorist financing, and (ii) outlined its work on a framework
for monitoring the financial stability risks arising from digital token markets. The report also summarised ongoing work by
the CPMI, IOSCO and BCBS. FSB (July 2018), “Crypto-Assets: Report to the G20 on the Work of the FSB and Standard-Setting
Bodies”.
20 Regulatory action differs among jurisdictions. Many jurisdictions have issued warnings aimed at educating investors on the

potential pitfalls of investing in digital tokens. Several have imposed requirements to prevent money laundering and
terrorism financing on trading platforms. Others have banned some or all digital token activities completely. Library of
Congress (June 2018), “Regulation of Cryptocurrency Around the World”.
21 Some banks are facilitating trades in Bitcoin derivatives and exploring custody solutions for digital tokens. Several

investment firms have also raised funds focused on digital token investments. Financial Times (August 2018), “Wall Street
Starts to Dip its Toes in Crypto”.
22 Existing chains struggle to cope with high transaction volumes, incur high environmental costs, and create uncertainty

around the finality of settlement. Ongoing experiments such as Bitcoin Lightning / Ethereum Plasma and Proof-of-Stake
consensus mechanisms are efforts to improve on these issues. BIS Annual Economic Report (June 2018), “Cryptocurrencies:
Looking Beyond the Hype”.
23 MAS’ scan of FIs shows that their direct (e.g. holdings of digital token assets and derivatives) and indirect exposures (e.g.

extension of loans to digital token businesses) to digital token markets are currently minimal.

Monetary Authority of Singapore Macroprudential Surveillance Department
Financial Stability Review, November 2018 11

 The digital token markets grew rapidly in 2017, Bitcoin remains substantially bigger than other
 but have since pulled back digital tokens
 Chart B1 Chart B2
 Market Capitalisation of Digital Tokens Percentage Share of Digital Tokens
 Bitcoin Ethereum Bitcoin Ethereum
 Bitcoin-Cash Ripple Bitcoin-Cash Ripple
 Eos Other Eos Other
 100
 800
 80
 600
 US$ Billion

 Per Cent
 60
 400
 40
 200 20

 0 0
 Jan 17 Jul 17 Jan 18 Jul 18 Oct 18 Jan 17 Jul 17 Jan 18 Jul 18 Oct 18

 Source: Coinmarketcap Source: Coinmarketcap

 Data from trading platforms provides a useful view of global trading activity…
 This study focuses on Bitcoin (BTC) as it accounts for 51% of total market capitalisation (Chart B2). Data
 from digital token trading platform Application Programming Interfaces (APIs) allows monitoring of global
 shifts in trading activity (Chart B3). Substantial declines in the share of trading activity of a particular
 jurisdiction can serve as an early warning signal that the trading activity may flow to other jurisdictions,
 which has both financial stability and regulatory implications.24

 Shifts in trading activity have implications on cross-border flows
 Chart B3
 Global Fiat-BTC Trading Volumes
 BTCCNY BTCUSD
 BTCJPY BTCEUR
 BTCKRW Other
 100

 80
 Per Cent

 60

 40

 20

 0
 2013 2014 2015 2016 2017 2018 Oct

 Source: MAS estimates, Cryptocompare

 …and facilitates deeper dives into the potential size of wealth effects in specific jurisdictions
 A potential channel through which digital tokens may affect financial stability is wealth effects, where
 declines in the value of households’ holdings of digital tokens could cause a drop in aggregate spending.
 MAS used the trading activity and inflows of SGD into BTC-SGD trades on major Singapore-based exchanges

24The pseudo-anonymity that blockchain technology provides may potentially increase money laundering risks. KPMG (June
2018), “Anti-Money Laundering in Times of Cryptocurrencies”.

Monetary Authority of Singapore Macroprudential Surveillance Department
Financial Stability Review, November 2018 12

 as proxies for the potential wealth effects and associated risks in Singapore. 25 Trading activity and
 directionality of flows can help to gauge confidence or sentiment effects and investor interest, while
 cumulative net inflows can aid in constructing bounds on the potential size of wealth effects.

 Analysis suggests that wealth effects in Singapore are currently small. The lower-bound on the total volume
 of BTC-SGD traded since 2013 is estimated to be around S$9 billion which implies monthly trading volumes
 of less than 1% of those on the Singapore Exchange (SGX). Investor interest has also dipped substantially
 since January 2018 (Chart B4). Turning to BTC-SGD volumes, which were calculated by trade-level
 information from the APIs provided by major Singapore-based trading platforms, cumulative net inflows
 on trading platforms that disclose the directionality of their trades is estimated at around S$400 million
 (Chart B5). This is relatively small compared to Singaporean household assets of S$2 trillion at end 2017.

 Trading activity in BTC-SGD remains low… …while net inflows appear to have slowed
 Chart B4 Chart B5
 BTC-SGD Trading Activity in Major Exchanges Net Inflow of SGD into BTC in Major Exchanges
 Buy Volume Sell Volume Cumulative Net Inflows
 BTCSGD Price (RHS) BTCSGD Price (RHS)
 100 25
 500 25
 20
 50 400 20
 S$ Thousand

 S$ Thousand

 S$ Thousand
 15
 S$ Million

 300 15
 0
 10 200 10
 -50
 5 100 5

 -100 0 0 0
 Jan 17 Jul 17 Jan 18 Jul 18 Oct 18 Jan 17 Jul 17 Jan 18 Jul 18 Oct 18
 Source: MAS estimates, Trading platforms’ APIs Source: MAS estimates, Trading platforms’ APIs
 Note: Cumulative inflows since 1 January 2017.

 This approach (i.e. using trading activity and net inflows in a particular fiat to digital token pair to proxy
 activity by a jurisdiction’s participants) provides a useful tool to monitor and analyse digital tokens on a
 timely basis, given that the trading platform APIs are updated near real-time. Nevertheless, further work
 would be needed if the approach were to be applied in the case of more international currencies such as
 the euro, as the international profile of investors using those fiat currencies makes it more difficult to
 isolate the domestic wealth effects.

 The blockchain also gives policymakers better visibility into entities in the digital token ecosystem which
 do not have an API
 While trading platform APIs prove to be a valuable source of information on digital token markets, several
 major trading platforms and broker-dealers do not provide APIs. MAS has thus conducted further research
 into analysing the Bitcoin distributed ledger to monitor entities’ activities being broadcasted publicly on
 the blockchain.

25 Those transacting in SGD are likely to be Singapore residents, and BTC is the largest digital token by market capitalisation.

Monetary Authority of Singapore Macroprudential Surveillance Department
Financial Stability Review, November 2018 13

 Clustering on the blockchain can help to track the activity of unregulated entities
 Figure B1
 Explanatory Illustration of Clustering on a Blockchain

 Source: MAS

 As a proof of concept, MAS ran a clustering algorithm26 (written using an open-source Bitcoin blockchain
 parser27) to find around 10,000 addresses that were controlled by a major wallet provider and broker-
 dealer in Singapore without an API (Figure B1). The additional visibility gained on its potential custodial
 holdings of BTC, peaking at US$20 million in January 2018 (Chart B6), supports the assessment that current
 exposures to digital tokens remain small.

 Blockchain technology can be harnessed to …as well as cross-border flows in digital token
 monitor wealth effects… markets
 Chart B6 Chart B7
 Blockchain Monitoring of Major Transfers of BTC from a Key Chinese Trading
 Singapore-based Wallet Provider Platform to a Singapore Trading Platform

 Balances Outflow (RHS) Inflow (RHS) Cumulative Transfers Weekly Transfers (RHS)

 25 5 6 1.5

 20 3
 US$ Million

 US$ Million

 4 1
 US$ Million

 US$ Million

 15 1

 10 -1
 2 0.5
 5 -3

 0 -5 0 0
 Jan 17 Jul 17 Jan 18 Jul 18 Oct 18 Apr 16 Oct 16 Apr 17 Oct 17 Apr 18 Oct 18

 Source: MAS estimates, Bitcoin blockchain Source: MAS estimates, Bitcoin blockchain
 Note: Cumulative balances since 1 January 2015. Note: The yellow lines demarcate key regulatory crypto
 announcements in China. These appear to have driven
 movement of BTC into a Singapore trading platform, but
 the estimated transfers remain small at less than S$10
 million. Cumulative transfers since 1 January 2015.

26 Clustering techniques have been adopted in other studies of digital token blockchains. Sarah Meiklejohn, Marjori Pomarole,
Grant Jordan, Kirill Levchenko, Damon McCoy, Geoffrey M. Voelker and Stefan Savage, Proceedings of the 2013 Conference
on Internet Measurement Conference (2013), “A Fistful of Bitcoins: Characterizing Payments Among Men with No Names”.
27 Harry Kalodner, Steven Goldfeder, Alishah Chator, Malte Möser and Arvind Narayanan (2017), “BlockSci: Design and

Applications of a Blockchain Analysis Platform”. https://github.com/citp/BlockSci.

Monetary Authority of Singapore Macroprudential Surveillance Department
Financial Stability Review, November 2018 14

 These blockchain-level clustering techniques can also be used to monitor the magnitude and potential
 drivers of cross-border flows by analysing transfers of BTC between entities in different jurisdictions. One
 area of study is whether tightening regulatory measures in one jurisdiction could drive an inflow of digital
 token activity to another jurisdiction. Early analysis on the flow of funds from a key trading platform in an
 overseas jurisdiction to a Singapore trading platform – following the jurisdiction’s regulatory actions in
 digital token markets – suggests that while regulatory actions may be drivers of cross-border capital flows
 in digital token markets, the magnitude of such flows remains small (Chart B7).

 Aggregating public data can give a preliminary sense of digital token offerings activity
 The prevalence of digital token offerings underscores the rapid changes taking place in digital token
 markets, and the growing need for better surveillance in this area. Yet, there are no authoritative or verified
 sources on identifying specific digital token offerings and their countries of operations.

 MAS has undertaken early work to aggregate information from online portals. One major caveat on this
 approach is that the data has been self-reported by token issuers to online portals, and not verified.
 Meanings of terms vary across portals and are ill-defined e.g. “country” could refer to (i) country of
 operations or (ii) domicile of offering vehicle, and the offering may or may not have been made in that
 country. Nevertheless, MAS’ early work allows regulators to gain a preliminary sense of digital token
 offerings activity globally. MAS’ data suggests that the cumulative self-reported amounts raised have
 grown in 2018 (Chart B8). From a financial stability perspective, the reported amounts raised through
 digital token offerings are much smaller than the total digital token market capitalisation (Chart B1) and do
 not currently present a material risk.

 Cumulative digital token offerings volume
 grew in 2018 but not material to stability
 Chart B8
 Self-reported Digital Token Offering
 Volumes by “Country”
 United States Singapore
 Switzerland United Kingdom
 Estonia Hong Kong
 Russia Canada
 Gibraltar
 6
 Index (1 Jan 18 =1)

 5
 4
 3
 2
 1
 Jan 18 Apr 18 Jul 18 Oct 18
 Source: MAS estimates, online digital token offering
 portals
 Note: Volume raised indexed to one as of 1 January
 2018, based on digital token offering's self-reported
 “country of operations”.

Monetary Authority of Singapore Macroprudential Surveillance Department
Financial Stability Review, November 2018 15

 Ongoing market developments continue to bear close monitoring, with such monitoring aided by new
 frameworks and data sources
 MAS continues to monitor and study digital tokens and their underlying blockchain technology closely.
 While the indicators above suggest that digital token markets have cooled significantly in 2018 and financial
 stability implications in Singapore are presently small, early signs of increased integration between FIs and
 digital token markets may facilitate increased institutional involvement in digital tokens.

 Various jurisdictions and authorities have been exploring different ways of strengthening surveillance of
 digital token markets.28 MAS’ early work suggests that while digital tokens create data gaps for authorities
 that traditional data sources may find challenging to fill, they also bring new, if unconventional, data
 sources that authorities can tap into. These data sources are rapidly changing, and MAS continues to refine
 and improve our surveillance framework as markets evolve and new sources of data become available.

28 FSB (July 2018), “Crypto-Assets: Report to the G20 on the Work of the FSB and Standard-setting Bodies”.

Monetary Authority of Singapore Macroprudential Surveillance Department
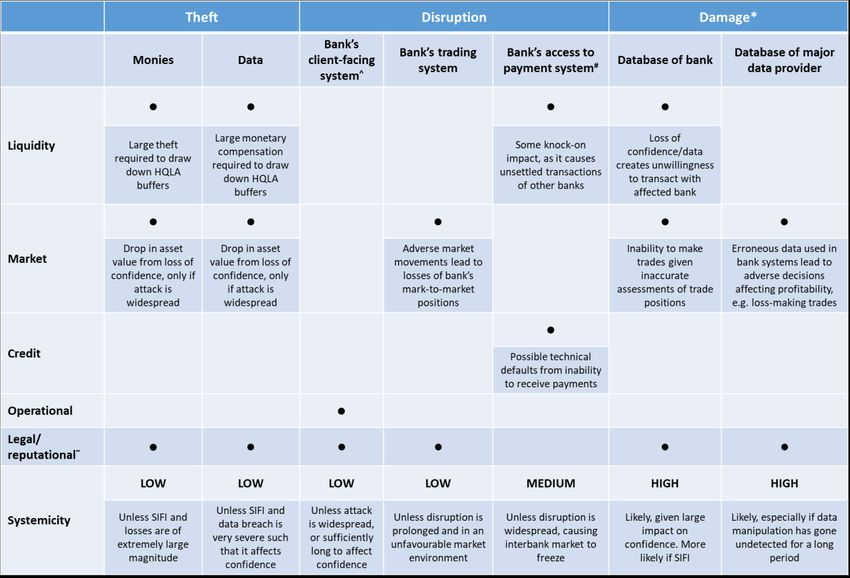
Financial Stability Review, November 2018 16 Box C A Framework to Assess the Implications of Cyber Risk on Financial Stability The financial sector’s move towards greater digitalisation and wider adoption of technological solutions has precipitated growing interest in the study of cyber risk.29 Given the interconnectedness of the financial system and its importance to economic growth, one important area of study is how a cyber attack on an FI could lead to a systemic outcome. 30 This box proposes a framework to assess the impact of a cyber incident on a bank, and assesses the likelihood that different types of cyber incidents could lead to a systemic outcome. Cyber attacks can be categorised into theft, disruption, or damage-related attacks Cyber attacks can be broadly categorised into three types, based on the harm that they inflict31: Theft – cyber attacks that extract items that are valuable to the perpetrator would be considered theft-related. Funds/monies, customer credentials and intellectual property or market-valuable information are likely targets of theft-related cyber attacks.32 Disruption – cyber attacks can temporarily disrupt business functionality, or degrade the availability of transactions or communications. Websites or servers, and internet-based businesses are examples of business functionalities that can be disrupted as part of a cyber attack.33 Damage – such cyber attacks affect data integrity, or damage system hardware or software or other equipment. Historically, a large majority of reported cyber attacks affecting the financial sector worldwide have been theft or disruption-related (Chart C1). 29 International Monetary Fund (June 2017), “FinTech and Financial Services: Initial Considerations”. 30 This refers to the outcome from a disruption to financial services that is caused by an impairment of all or parts of the financial system and has the potential to have serious negative consequences for the real economy. Bank for International Settlement (February 2010), “Systemic Risk: How to Deal With It?”. 31 Simon Ruffle, Andrew Coburn, Daniel Ralph, Gary Bowman, University of Cambridge Judge Business School, Centre for Risk Studies, (July 2013), “Cambridge Risk Framework, Profile of a Macro-catastrophe Threat Type – Cyber Catastrophe”. 32 Consumer businesses are relatively more likely targets, given the large amount of valuable customer information they possess. Fitch Ratings (April 2017), “Cybersecurity an Increasing Focus for Financial Institutions”. 33 Financial market infrastructures that provide services such as trading, payments, clearing and settlement are more likely targets of such attacks. Monetary Authority of Singapore Macroprudential Surveillance Department
You can also read