NSW Apple Industry Baseline Survey 2019 - www.dpi.nsw.gov.au
←
→
Page content transcription
If your browser does not render page correctly, please read the page content below
NSW Apple Industry
Baseline Survey 2019

Jessica Fearnley
Kevin Dodds
Amanda Warren-Smith
                             www.dpi.nsw.gov.au
                      NSW APPLE INDUSTRY BASELINE SUR VEY 2019 | 1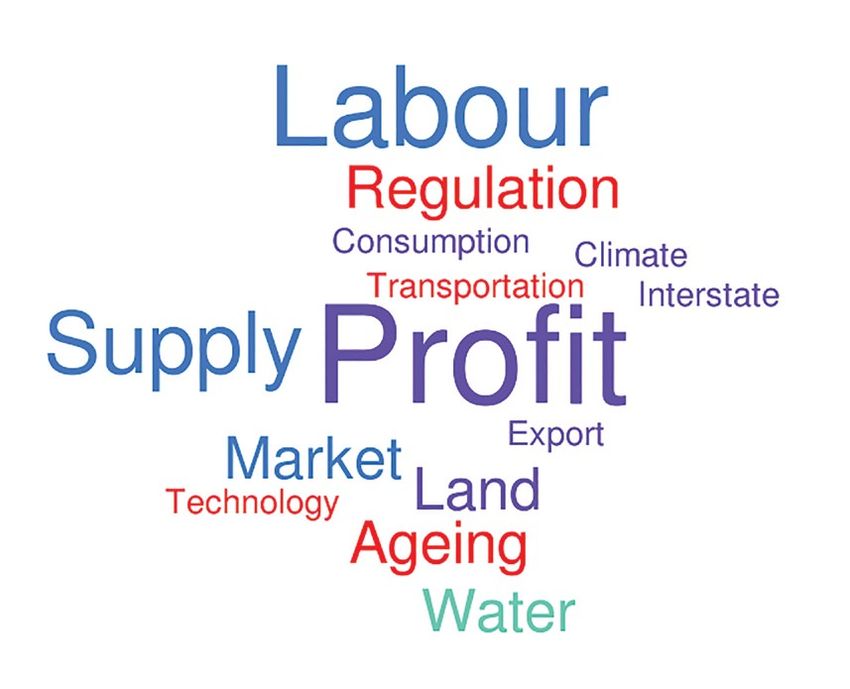
Published by the NSW Department of Primary Industries
NSW Apple Industry Baseline Survey
First published January 2020
DPI Report 26
PUB20/56

More information
Jessica Fearnley
Development Officer – Temperate Fruits
Orange Agricultural Institute
1447 Forest Road, ORANGE NSW 2800
jessica.fearnley@dpi.nsw.gov.au
0437 284 010

www.dpi.nsw.gov.au

Acknowledgements
The authors would like to acknowledge support from Jeremy Bright and Matt Weinert from NSW DPI
for their advice when collating the survey and analysing the results. A special thanks to Anne Harris
(NSW DPI) for advice regarding survey design.

Cover photo: Pink Lady Apples, NSW DPI.

© State of New South Wales through Department of Planning, Industry & Environment 2020. The
information contained in this publication is based on knowledge and understanding at the time
of writing (January 2020). However, because of advances in knowledge, users are reminded of the
need to ensure that the information upon which they rely is up to date and to check the currency
of the information with the appropriate officer of the Department of Planning, Industry and
Environment or the user’s independent adviser.

2 | Jessica Fearnley, Kevin Dodds and Amanda Warren-Smith
NSW Apple Industry
Baseline Survey 2019

Jessica Fearnley
Development Officer – Temperate Fruits
Orange Agricultural Institute
1447 Forest Road Orange NSW 2800
m: 0437 284 010
e: jessica.fearnley@dpi.nsw.gov.au

Kevin Dodds
Development Officer – Temperate Fruits
Tumut District Office
64 Fitzroy Street Tumut NSW 2720
p: 02 6941 1405 m: 0427 918 315
e: kevin.dodds@dpi.nsw.gov.au

Amanda Warren-Smith
Development Officer – Information Delivery
Orange Agricultural Institute
1447 Forest Road Orange NSW 2800
p: 02 6391 3953
e: amanda.warren-smith@dpi.nsw.gov.au

                                             NSW APPLE INDUSTRY BASELINE SUR VEY 2019 | 3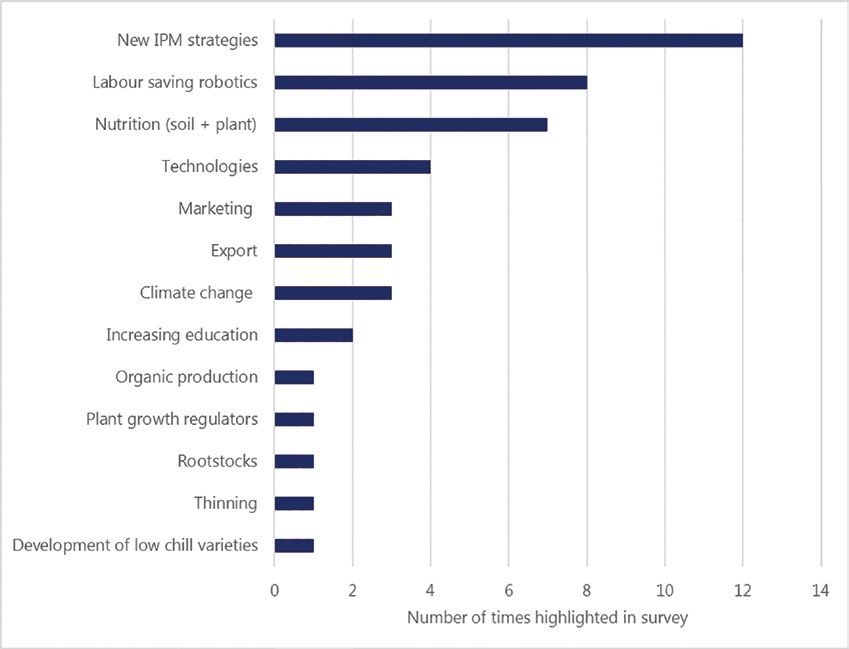
Contents
Abstract5

Methods6
    The survey                                              6
    Target population                                       6
    Data analysis                                           6
Results6
    Response rate                                   6
    Demographics6
       Industry age profile                         6
       Industry gender profile                      8
       Generation of growers                        8
    Orchard characteristics                         9
       Size of productive orchard                   9
    Orchard management practices                   11
       Current varieties planted in NSW            11
       Using protective netting                    12
       Irrigation methods                          12
       Labour-saving technologies                  13
       Employment statistics                       14
       Facilities on site                          14
       Processed products and value-adding         15
    Markets16
       Marketing17
    Challenges18
       Targeted areas for research and development 20
       Information sources                         22
Discussion23

Conclusions26

References27

Appendix 1                                                 28

4 | Jessica Fearnley, Kevin Dodds and Amanda Warren-Smith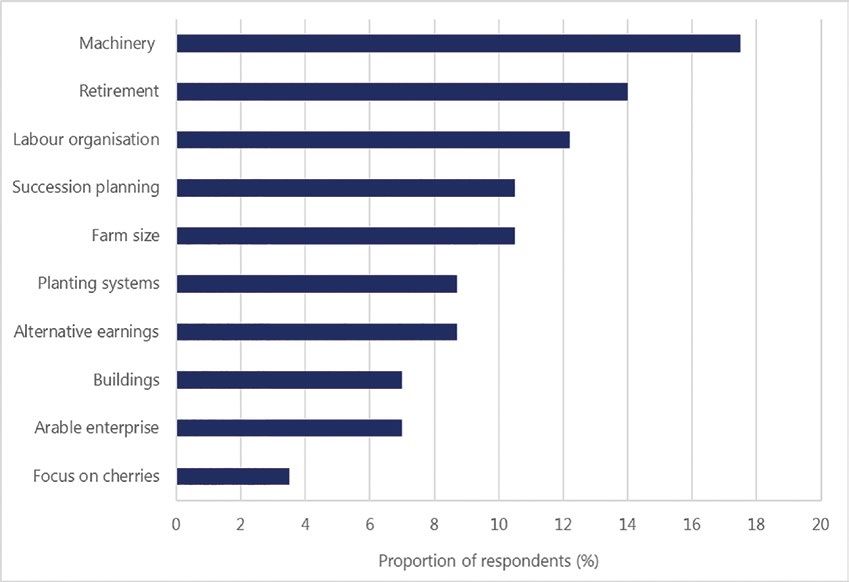
Abstract
The apple industry is the highest value fruit industry in Australia ($490 million)
(Apple and Pear Australia, 2019a), however, a national benchmarking project
identified some major challenges facing the industry. These challenges included
oversupply to markets, increasing input costs, variable yields, and a lack of export
competitiveness and reliable data on tree plantings to inform decision making
(Apple and Pear Australia, 2019a).
To determine if these challenges are reflected in the NSW apple industry and to
identify opportunities for research and development, a 35-question survey was
distributed to all apple growers on NSW Department of Primary Industries (NSW
DPI) mailing lists (n=56).
Twenty-five growers responded, giving an overall response rate of 45% with a
fairly even distribution between Batlow (32%), Orange (32%) and Bilpin (28%).
The majority (92%) of respondents were aged between 46 and 75 years; 8% were
female and 72% were first or second generation farmers. Most (64%) orchards
were between 1 and 30 hectares. Apples are the main (88%) commodity produced
by respondents with cherries, hazelnuts and stone fruit contributing 4% each.
The survey results showed that Pink Lady™ and Gala™ high colour strain varieties
were the most planted (86.6 and 75.6 hectares respectively) while Braeburn and
Sundowner were the least planted (3.2 and 3.6 hectares respectively).
The survey responses suggest that NSW apple yields (reported in t/ha) were
higher than the national average for Pink Lady™, Kanzi™ and Red Delicious
but lower for Jazz™, Granny Smith and Sundowner. Most (88%) respondents
were using protective netting and 63% use drip irrigation. Just over half of
respondents have cold storage and packing facilities onsite.
Unsurprisingly, casual employees were the predominant labour source and
the majority gain employment during picking. While 56% of orchardists were
using some form of labour-saving technology, the anticipated uptake of
further orchard technology is low (16%). Wholesale markets were used most by
orchardists (76.1%) and only 2% market their produce internationally.
Labour (cost and source), income, market and climate were identified as
the major challenges facing growers and the industry. New integrated pest
management (IPM) strategies were identified as the most important area
requiring research, development and extension (RD&E). Labour-saving robotics
and soil and plant nutrition were also high priorities. Identifying these key
challenges and priorities will help to inform future RD&E programs to best
support NSW apple producers.

                                              NSW APPLE INDUSTRY BASELINE SUR VEY 2019 | 5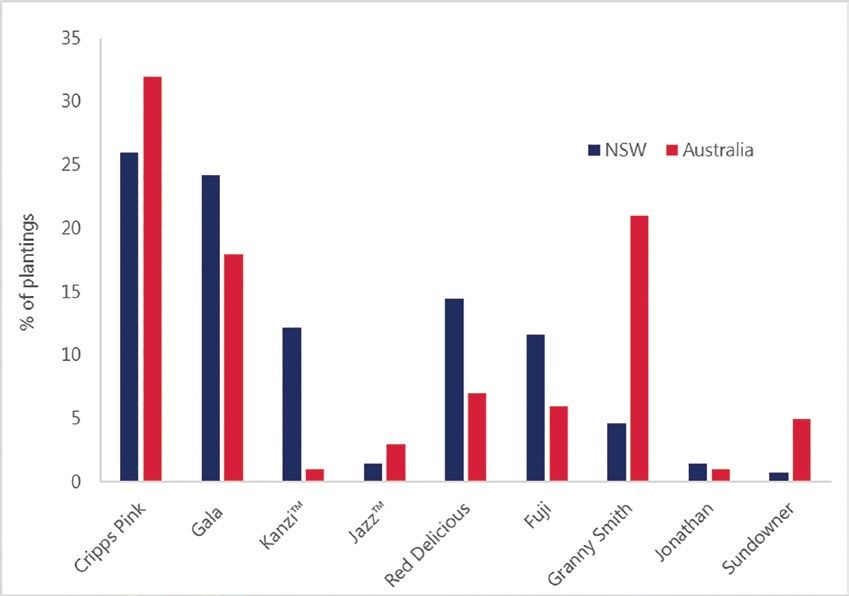
Methods
The survey
A six-page questionnaire containing 35 questions (Appendix 1) was designed to be
completed in an estimated 10 minutes. Respondent confidentiality was ensured
by using the anonymous survey platform ‘SurveyMonkey Design®’. Participation in
the survey was voluntary, however, as an incentive to complete the survey, a GDOT
soil moisture sensor valued at $290 was offered as a randomly drawn prize for one
respondent after the closing date. Twenty-five NSW apple growers responded
to the survey which was open from 15 July to 29 August 2019. The winner of this
sensor was drawn on 26 August 2019 at the Orange Agricultural Institute and
notified by email.
The survey questions were grouped into four categories. The first page of
questions (1 to 13) investigated the demographics and production statistics of the
orchards. Questions 14 to 21 focused on management practices that made up the
day-to-day running of the orchard. Questions 22 to 28 asked the respondent to
comment on their postharvest and marketing strategies, whilst Questions 29 to 35
looked at future areas of research.

Target population
The target population for this survey was all NSW apple growers that were on the
NSW Department of Primary Industries mailing list (n=56, July 2019). The survey
link was emailed to all growers and three reminder emails were sent before the
closing date.

Data analysis
The data were entered into an Excel spreadsheet for analysis. The response rate
was calculated as the total number of completed surveys returned relative to the
total number distributed. Percentages were calculated as a proportion of the total
number of respondents for each question and did not include non-respondents.
Average production yield was calculated by totalling the respondents’ answer to
average yield and dividing by the number of responses received for that question.

Results
Response rate
Of the 56 surveys distributed, 25 were returned completed giving a response rate
of 45%. The response rate from the Bilpin region (28%) was similar to the major
centres of Batlow (32%) and Orange (32%, Figure 1).

Demographics
Industry age profile
Ages were grouped into 10 year cohorts from 18 to >75 years. The grower’s age
profile showed a trend that is common across most rural industries; having a higher
proportion of growers over 50 years. Most respondents were in the 56-65 age
category, and there were few below 45 years (Figure 2).

6 | Jessica Fearnley, Kevin Dodds and Amanda Warren-Smith
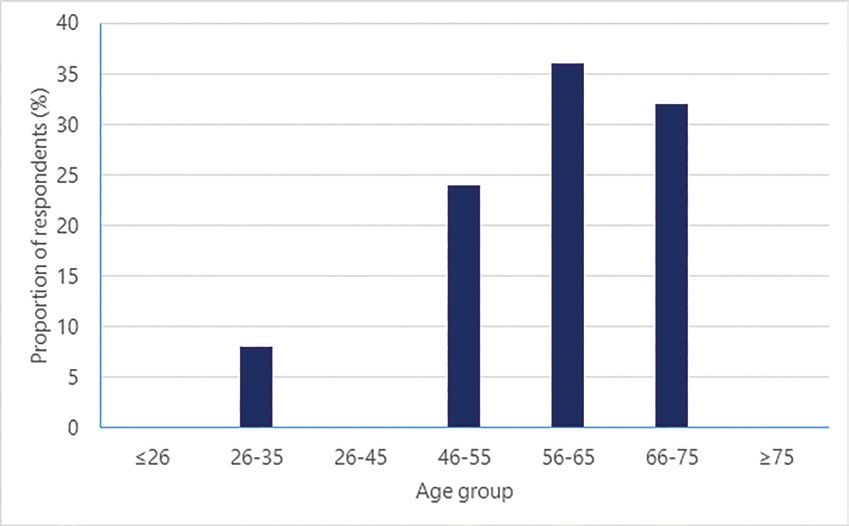
Figure 1. Location of NSW apple growers who responded to the survey.

Figure 2. Survey respondent age distribution.

                                                NSW APPLE INDUSTRY BASELINE SUR VEY 2019 | 7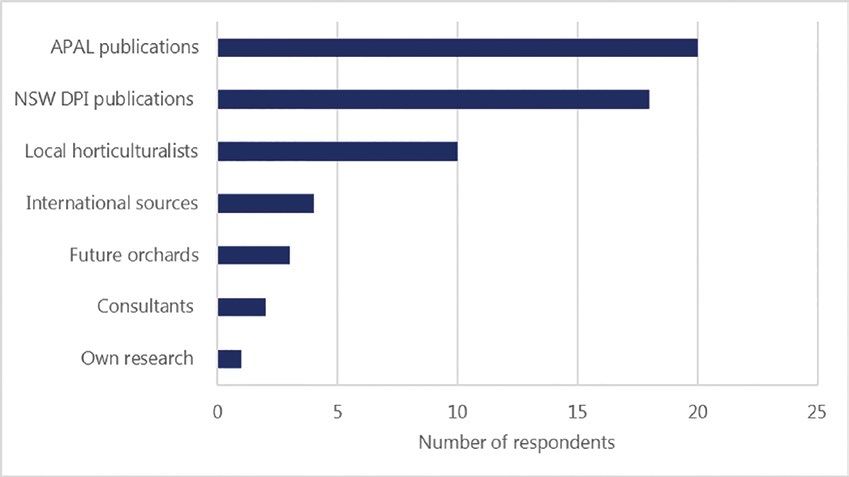
Industry gender profile
There was a significant gender disparity among the respondents; only 8% (n=2) of
the 25 respondents were female (Figure 3).

Figure 3. The proportion of male to female respondents.

Generation of growers
Interestingly, a majority of respondents were first or second generation orchardists
(Figure 4).

Figure 4. Generation of orchardist.

8 | Jessica Fearnley, Kevin Dodds and Amanda Warren-Smith
Orchard characteristics
Size of productive orchard
Most (64%) of the NSW apple orchard properties captured in this survey include
between 1 and 30 hectares of productive orchard (Figure 5). Only 20% are greater
than 40 hectares.

Figure 5. Size of productive apple orchards according to respondent.

Apples are the main (88%) commodity produced by respondents with cherries,
hazelnuts and stone fruit contributing 4% each (Figure 6).
To capture any possible future trend towards cherry production, respondents were
asked “If applicable, what best describes your future planted area for cherries?”
Results showed that more respondents (54%) were considering increasing their
cherry plantings than maintaining (38%) or decreasing (8%) their plantings
(Figure 7).

                                                  NSW APPLE INDUSTRY BASELINE SUR VEY 2019 | 9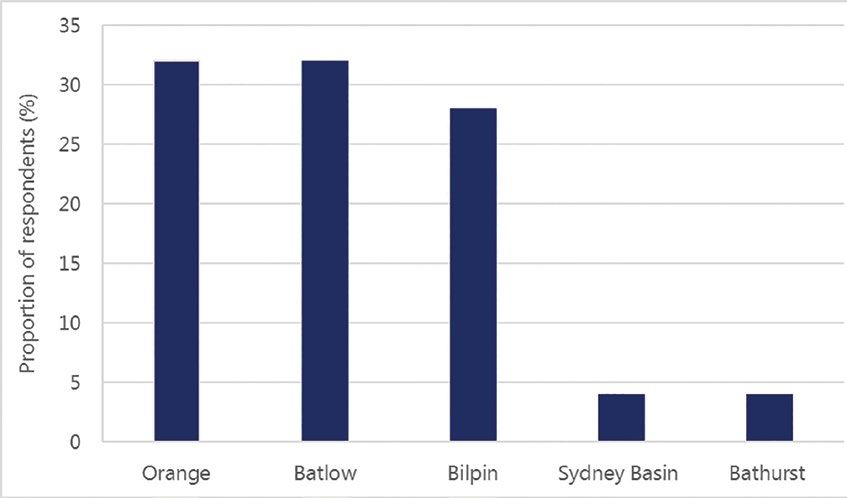
Figure 6. Main enterprise on survey respondent’s farms.

Figure 7. Future cherry planting intentions of survey respondents.

10 | Jessica Fearnley, Kevin Dodds and Amanda Warren-Smith
Orchard management practices
   Current varieties planted in NSW
   Respondents were asked which varieties they are growing and how many hectares
   they have of each variety. According to respondents, a total of 480 hectares in NSW
   are productive apple orchards. Pink Lady™ (Cripps Pink) high colour strain varieties,
   which include Rosy Glow, Lady in Red and Ruby Pink, are the most commonly
   varieties (86.6 ha) planted in NSW, while Braeburn and Sundowner are the least
   planted varieties (3.2 and 3.6 ha respectively; Table 1).
   Given the low number of varieties per respondent, average yields were used in
   the analysis. Kanzi™ (Nicoter) generated the highest average yield of 60-70 t/ha
   (Table 1).

Table 1. Area planted, yield and typical packout by key variety for survey respondents.

           Pink Pink     Gala   Gala   Kanzi™ Jazz™ Bravo™ Red       Fuji     Granny Jonathan Braeburn Sundowner
           Lady™ Lady™          HCS                        Delicious          Smith
                 HCS²
Total
area¹
(ha)
           38.2   86.6   40.4   75.6   59.0    7.0    10.6     69.4    56.6   23.2   7.0      3.2      3.6

Largest
planting
(ha)
           13     16+    11     12     16+     7      5        16+     16+    6      1
Using protective netting To determine the type of protective netting systems being used in NSW, the survey asked respondents if they used netting and to specify the type of netting used. Results showed an even split between structured and throwover netting, with some growers using a mixture of both types. Twelve per cent of growers surveyed are not using any type of protective netting in their orchard (Figure 8). Figure 8. Type of netting used in respondent’s apple orchards. Irrigation methods The most common type of irrigation in NSW is drip irrigation, used by 63% of growers (Figure 9). Of the growers surveyed, none reported using overhead sprinklers. Figure 9. Type of irrigation used in respondent’s apple orchards. 12 | Jessica Fearnley, Kevin Dodds and Amanda Warren-Smith
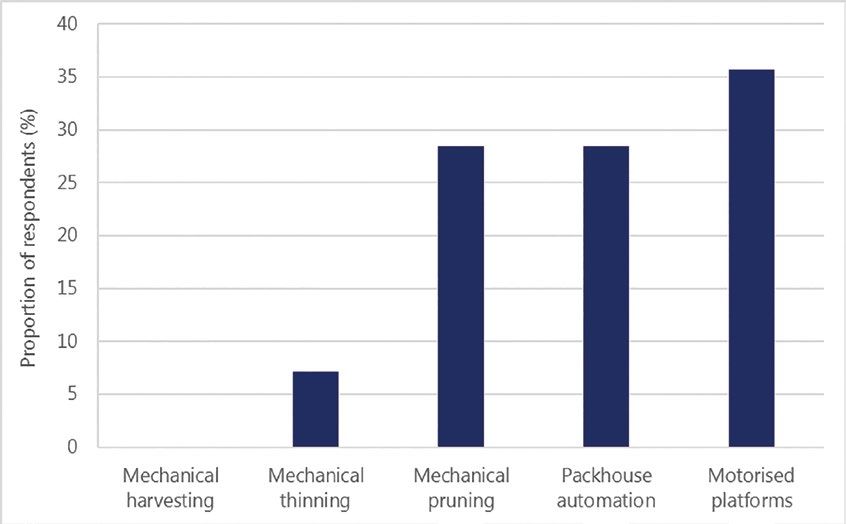
Labour-saving technologies
Mechanical thinning, mechanical pruning, packhouse automation and motorised
platforms are the most commonly used labour-saving technologies in orchards.
Motorised platforms were the most common type (35%) of technology used in
NSW apple orchards, followed by mechanical pruning (28.5%) and packhouse
automation (28.5%). None of the respondents reported using mechanical
harvesting (Figure 10).

Figure 10. Labour-saving technologies used in respondent’s apple orchards.

Respondents were asked to select the likeliness of adopting robotics to replace
labour. The most common response was ‘unlikely’, followed by ‘not sure’, ‘likely’,
and ‘extremely unlikely’ (Figure 11). No respondents indicated that they were
‘extremely likely’ to adopt robotics to replace labour.

Figure 11. Likelihood of growers adopting labour-saving technology.

                                                NSW APPLE INDUSTRY BASELINE SUR VEY 2019 | 13
Employment statistics Seventy-six full-time employees, 174 part-time employees (
Figure 13. Proportion of respondents with access to a packhouse facility on farm.

Processed products and value-adding
When asked what type of value-add products growers are producing, juice was the
most common (55%), followed by cider (28%), vinegar (9%), dried fruit (5%) and
apple pies (5%, Figure 14).

Figure 14. Value-add products produced by surveyed apple growers.

                                                 NSW APPLE INDUSTRY BASELINE SUR VEY 2019 | 15
Markets The majority of respondents sell their fruit through wholesale markets (76%). Only 2% send their produce to international markets (Table 4). Table 4. The proportion of respondents and the different markets they are using to sell their produce. Type of market Proportion of respondents (%) Direct 36.3 International 2.0 Processing 23.3 Roadside 48.8 Wholesale 76.1 To gauge the level of interest in exporting apples, we asked if the respondents would be interested in attending workshops about expanding the export market for apples; 34.5% indicated they would be interested (Figure 15). Figure 15. Proportion of respondents interested in exploring export opportunities. 16 | Jessica Fearnley, Kevin Dodds and Amanda Warren-Smith
Marketing
Seventy-four per cent of orchardists are marketing their own product (Figure 16)
and are using a range of options (Table 5).
Figure 16. Proportion of respondents who are marketing their own product.
Table 5. Types of marketing used by orchardists.
Type of market Proportion of respondents (%)
Farmers markets 27.7
Personal contacts 11.1
Pick your own 22.2
Roadside and shed stalls 22.2
Social media 16.6
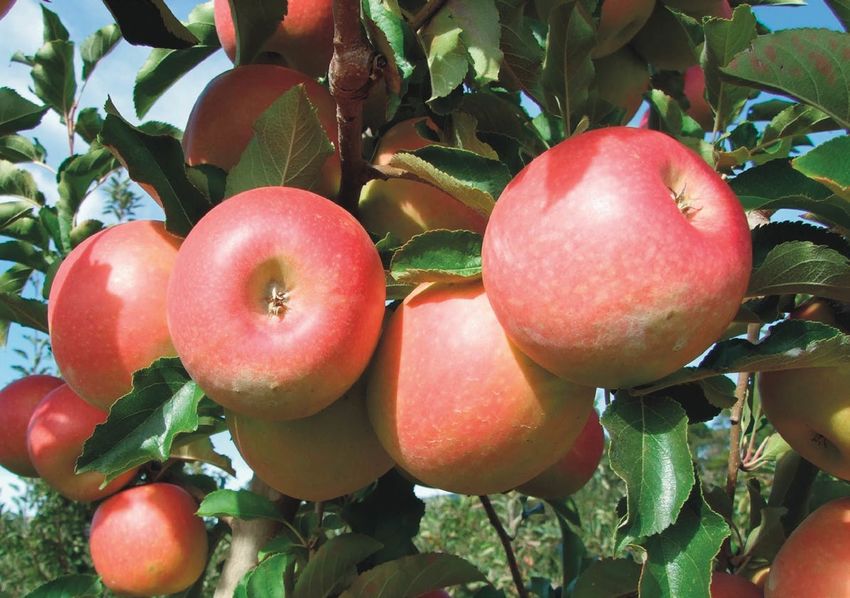
NSW APPLE INDUSTRY BASELINE SUR VEY 2019 | 17Challenges Survey respondents were asked to list the biggest challenges they see affecting the production and sustainability of the NSW apple industry. This list was then displayed in a word cloud, with constraints that are more common appearing bigger in the cloud (Figure 17). Figure 17. Challenges to the apple industry as indicated by survey respondents. 18 | Jessica Fearnley, Kevin Dodds and Amanda Warren-Smith
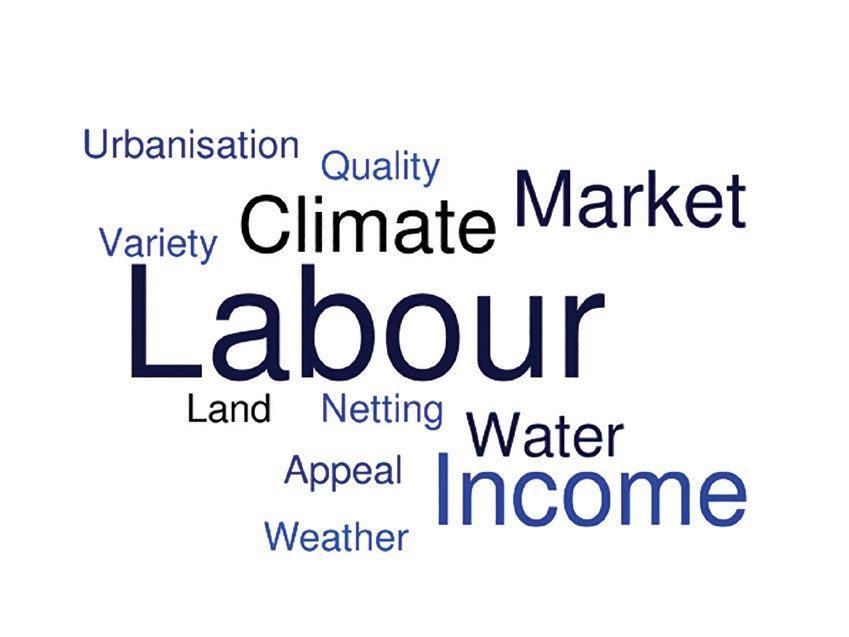
Labour (referring to the cost as well as source), profit and over-supply were
identified as the biggest constraints to the industry. Respondents were then
asked what they identified to be the biggest constraint to their personal orchard
(Figure 18). Again, labour and income appear to be the biggest constraints to
growers personally, with the changes in climate and weather patterns becoming
more prevalent.

Figure 18. Challenges to individual orchards as indicated by survey respondents.

                                                 NSW APPLE INDUSTRY BASELINE SUR VEY 2019 | 19
Targeted areas for research and development The NSW DPI Development Officers for Temperate Fruits are employed to assist and develop the NSW apple industry through research, development and extension. To help identify the areas in which the industry would like more investment, respondents were asked to highlight different categories. New IPM strategies were identified as the most important (25.5%), followed by labour- saving robotics (17%) along with soil and plant nutrition (15%). Interestingly, areas currently attracting research such as plant growth regulation, rootstocks, thinning techniques and development of low chill varieties were identified as the least important (Figure 19). Figure 19. Areas identified by respondents to receive further research. 20 | Jessica Fearnley, Kevin Dodds and Amanda Warren-Smith
When asked what the growers planned to change in the future, the most common
response was machinery (17%), followed by retirement (14%), labour organisation
(12.5%), succession planning and farm size (10.5%), planting systems and alternate
earnings (9%) (Figure 20). Interestingly, buildings and focusing on other crops such
as cherries were the lowest rated (3.5%) responses.

Figure 20. Respondents intended plans for changing.

Growers were asked if they intended to increase, maintain or decrease their
plantings in the future. The number of growers maintaining (54.4%) or increasing
(31.8%) their apple plantings outweighed the number of growers reducing (13.6%)
their plantings (Figure 21).

                                               NSW APPLE INDUSTRY BASELINE SUR VEY 2019 | 21
Figure 21. Respondent’s apple planting intentions. Information sources Respondents indicated that Apple and Pear Australia Limited (APAL) and NSW DPI publications were the most popular places growers’ sourced information for crop production (Figure 22). Their own research was the least common method used to get information. Figure 22. Most common sources of information for respondents. 22 | Jessica Fearnley, Kevin Dodds and Amanda Warren-Smith
Discussion
Having baseline data that reflects the current position of the NSW apple industry
will give a clearly defined starting point for future work. It will also provide a
reference point from which to measure and compare the outcomes of future
projects. This survey was designed to provide insight into the areas requiring more
research and development to enhance sustainable and profitable production. The
results give a snapshot of the NSW apple industry and can be used to tailor the
direction of the work of NSW DPI Development Officers.
Anecdotal evidence suggests there are 56 apple growers in NSW with the major
growing centres being in the Batlow and Orange regions. The response rate from
the Bilpin region was disproportionally high given the small number of growers
in this area compared to the major centres. However, this is consistent with the
recent high attendance rates by growers from the Bilpin and Sydney Basin areas
at industry events including the Future Orchards walks at Orange. This could
be a reflection of increasing grower engagement in industry level activities and
presents an opportunity for another area of focused research and development.
The relatively low response rate from the larger growing districts might indicate a
need for some focus to be placed on strategies that build grower engagement and
participation in these regions.
The disproportionately high response rate from the smaller and largely farm gate
focused Bilpin district could have influenced the distribution of orchard size data
in this survey. The high number of respondents having between 1 and 10 hectares
could reflect the resurgence of consumer interest in buying fruit and other value-
added products directly from the farmer. The smaller orchards are often grown
for ‘pick your own’ or roadside stalls. This seems to be underpinning a new period
of financial sustainability for small farm gate orchards, which are an increasingly
important part of the NSW apple industry.
The survey provided an indication of the current age profile of growers in the
apple industry. The small number of growers under the age of 45 years indicates
the need for more intervention to encourage young people into the NSW apple
industry. Groups such as the APAL Young Members’ Network will help build the
age profile of the industry whilst also investing in the leadership, networking and
career growth opportunities for the younger generations (Apple and Pear Australia
Limited, 2019b). It should be noted that the survey only asked for the age of the
respondent, not all employees of the business. Therefore, the age distribution data
might not be completely indicative of the entire NSW apple industry.
The data show a low number of women in the NSW apple industry, however, this
survey did not explore the husband and wife partnerships nor family partnerships,
therefore women might be under-represented. In many cases women manage
the bookwork and other administrative aspects of the business and may be more
involved in the business than suggested in these results. The low number of
women could also be an opportunity to encourage more women into the industry
or take on more of a role in the production side of the business.
Interestingly, a majority of respondents were first or second generation farmers,
challenging the perception that orchards have been handed down through multiple
generations. This could suggest that people are confident to enter the industry
without prior experience, which could increase the confidence of others wishing to

                                             NSW APPLE INDUSTRY BASELINE SUR VEY 2019 | 23
enter the industry. Conversely, succession planning ranked as one of the top four items for growers to change, potentially indicating that growers want to pass their orchards on after retirement. This could also see some young orchardists entering the industry, a positive change that is needed for the industry to remain viable. A concern for the apple industry is the intention of some NSW apple growers to increase the proportion of cherry plantings in their orchards until their apple plantings become minimal. The climatic and soil characteristics of the key NSW apple growing regions (Batlow and Orange) also favour the production of high quality cherries. When the apple industry is struggling, some growers may look to cherries as an alternative to apples. Whilst there has been some increase in cherry production in the Orange region in recent years, 88% of respondents indicated that apples are still the main enterprise. However, 54% of respondents indicated that they are intending to increase their cherry plantings, which could highlight a need for increased investment in cherry research, development and extension for these growers. Oversupply in the domestic apple market does not provide sufficient returns to keep growers in the industry. Coupled with consumption declining at 3% per annum due to competition from other snack foods, other markets must open (Apple and Pear Australia Limited, 2015). Our survey showed that only 2% of respondents are currently using international markets to sell their fruit, however 34.5% are interested in learning more about export markets. Expanding the markets to which apple growers send their fruit may reduce pressure on the domestic market, potentially returning better profit margins for the grower. Australia’s competitive edge largely remains with premium products and niche markets. Unfortunately our global competitiveness is challenged by our rank as the highest cost producer in the world, thus reducing production costs is crucial if the industry is to move to international markets. The data on apple variety plantings in NSW is a valuable dataset that was previously missing. However, it is important to note that the survey did not capture the actual area of production due to a low response rate, regardless, these results can be used as a guide. Recently across many Australian growing regions, traditional apple cultivars such as Sundowner, Golden Delicious and Red Delicious continue to be replaced by many new licensed cultivars such as Nicoter (marketed as Kanzi™), Jazz™, high-coloured strains of Cripps Pink (Pink Lady™) and Gala. In NSW, the most common types planted are Cripps Pink high colour strain varieties (86.6 ha) and this is consistent with the current national plantings (Hort Innovation 2017). While Granny Smith is the second largest planting nationally (Hort Innovation, 2017), our survey indicated that in NSW, Gala varieties are the second most popular (Figure 23). The low numbers of Jazz™ and Bravo™ could be due to the age of the trees in these varieties. Many of these varieties are not at full production yet, therefore the potential yield is not truly captured. In a recent benchmarking study undertaken by APAL on 26 businesses, an average yield was noted to be 47.9 t/ha. According to our survey data, Cripps Pink high colour strain, Nicoter and Red Delicious are all yielding higher than average while Jazz™, Granny Smith and Sundowner varieties are yielding below average. The Apple and Pear Strategic Investment Plan (Hort Innovation, 2017) outlines the key influences of yield are planting density, variety, soil health, netting, age of trees, 24 | Jessica Fearnley, Kevin Dodds and Amanda Warren-Smith
pest and disease interactions, water management and fertiliser management.
Evidently these areas could benefit from targeted research and development to
help growers improve the yields of under performing varieties and orchards.

Figure 23. Percentage of total area of varieties planted across apple orchards in NSW and
Australia (Hort Innovation, 2017).

One management strategy gaining popularity for optimising yield is netting.
Protected netting mitigates risk against hail damage, sunburn, flying fox and bird
damage (Mupambi et al., 2018). The high number of growers who responded with
‘Yes’ to using protective netting reflects the need for growers to protect crops and
their desire to enhance fruit quality. With climatic pressures and drier conditions
expected to continue, protective netting offers growers an additional way of
influencing their fruit quality. There are two main types of protective netting used
in orchards; structured netting and throwover netting. The type of netting used
will be influenced by the ease with which growers can still apply management
practices under or through the netting. In this survey, equal numbers of orchardists
are using both types of netting. However, it is speculated that growers would
prefer to have structured netting, but are limited due to financial constraints.
The dry conditions experienced in recent decades across southern Australia are
the most sustained large-scale changes in rainfall seen since 1999 (CSIRO, 2018).
Likewise, the south-east of Australia experienced an 11% decrease in rainfall from
April to October (CSIRO, 2018). If the dryer conditions continue, water management
is a key issue in NSW apple orchards and orchardists need to adopt efficient water
management strategies. Access to irrigation can offer growers the opportunity to
increase yields and productivity, especially during periods of low rainfall. Irrigation
can also enable better nutrient use efficiency through fertigation. Factors such

                                                 NSW APPLE INDUSTRY BASELINE SUR VEY 2019 | 25
as soil type, crop type, planting density, water quality, irrigation equipment and economic factors such as capital and operating costs, will influence the type of irrigation system a grower will invest in for their orchard (Jerie and Adem, 2010). The survey showed that the most common type of irrigation used in NSW is drip irrigation. This system is suited to the smaller root zones of the modern day dwarfing rootstocks. It delivers water precisely, ensuring that no resources are wasted (Netafim, 2018). Soil moisture monitoring is now more critical than ever. It indicates what is happening at specific locations so data can be combined with water budgets to accurately apply the correct amount of water the tree requires (Apple and Pear Australia Limited, 2015). This is useful when prolonged dry conditions reduce water availability. The Apple and Pear Strategic Investment Plan (Hort Innovation, 2017) outlined the key labour issues being the award rate, the backpacker tax, labour add-on costs, availability, penalty rates and skills levels. Implementing labour-saving technologies is one way orchardists can remain viable and competitive with other food producers. The most common technology used in orchards is motorised platforms, which help reduce the time employees spend climbing ladders. However, the high number of responses in the “extremely unlikely” and “unlikely” to adopt technology in the orchard categories may be a reflection of the lack of hard evidence of suitable machines available for the grower’s orchard. There could also be a cost concern associated with the implementation of labour-saving technologies in orchards. More research and development into reducing the cost of labour-saving technologies and making them more accessible to growers is crucial. Apples are available year round in Australia through the use of controlled atmosphere cold storage technology. Australian apple growers will store fruit to ensure it maintains maximum sweetness and crispness. With some apples, the flavour can improve after a few months’ storage because the natural acid composition changes, making them slightly sweeter (Apple Pear Australia Limited, 2019a). With the ability to store fruit for longer periods and the incidence of oversupply in the domestic market increasing, apple value-add products are now becoming more popular. These products can include juice, cider, sparkling juice, jams, dried products, vinegar, purees and baby foods. Juice and cider production were the most common (55% and 28% respectively) value-added products growers use to sell their fruit. Commonly, apples are juiced because they are not suitable for the fresh market due to not meeting market specification. Further research into juice and cider production may be beneficial to ensure premium returns to the grower. Conclusions The information in this report provides a snapshot of a portion of the NSW apple industry in 2019. To ensure the future prosperity of the NSW apple industry, research and development should focus on: • building grower engagement in the major apple growing regions • encouraging younger growers and female growers to enter the industry • reducing costs, particularly labour costs • improving yield, especially of varieties that perform under the national average • irrigation strategies, including technology to measure water use efficiency 26 | Jessica Fearnley, Kevin Dodds and Amanda Warren-Smith
• new marketing opportunities, including international markets and business skills
  for marketing.

References
Apple and Pear Australia Limited (2015). ‘Understanding irrigation requirements’, Apple
   and Pear Australia Ltd. https://apal.org.au/understanding-irrigation-requirements/
   viewed on 29 November 2019.
Apple and Pear Australia Limited (2019a). ‘Industry Statistics’, Apple and Pear Australia Ltd.
   https://apal.org.au/programs/industry-data/industry-stats/ viewed on 25 September
   2019.
Apple and Pear Australia Limited (2019b). ‘Young Members Network’, Apple and Pear
   Australia Ltd. https://apal.org.au/programs/more-industry-programs/young-members-
   network/ viewed on 25 November 2019.
Cherry Growers Australia (2018). ‘Export and trade’, Cherry Growers Australia. https://www.
   cherrygrowers.org.au/export/ viewed on 26 November 2019.
CSIRO (2018). ‘Australia’s changing climate’, Commonwealth Scientific and Industrial
   Research Organisation. https://www.csiro.au/en/Research/OandA/Areas/Assessing-
   our-climate/State-of-the-Climate-2018/Australias-changing-climate viewed on 29
   November 2019.
Hort Innovation (2017). ‘Apple and Pear Strategic Investment Plan 2017–2021’, Hort
   Innovation. https://www.horticulture.com.au/globalassets/hort-innovation/levy-
   fund-financial-and-management-documents/sip-pdfs-new/hortinnovation-sip-apple-
   pear-2017-2021.pdf viewed on 25 November 2019.
Jerie P and Adem H (2010). ‘Choosing an orchard irrigation system’ Agriculture Victoria.
    http://agriculture.vic.gov.au/agriculture/horticulture/fruit-and-nuts/orchard-
    management/choosing-an-orchard-irrigation-system viewed on 29 November 2019.
Mupambi G, Anthony B, Layne D, Musacchi S, Serra S, Schmidt T and Kalcsits L (2018).
  ‘The influence of protective netting on tree physiology and fruit quality of apple: A
  review’. Scientia Horticulturae, 236, 60-72. doi: http://treefruit.wsu.edu/publications/
  the-in%EF%AC%82uence-of-protective-netting-on-tree-physiology-and-fruit-quality-
  of-apple-a-review/.
Netafim (2019). ‘Control apple size and yield with precision irrigation’. Netafim. https://
   www.netafim.com.au/crop-solutions/apples/ viewed on 26 November 2019.

                                                   NSW APPLE INDUSTRY BASELINE SUR VEY 2019 | 27
Appendix 1
NSW apple industry baseline survey 2019
You and your orchard
This survey is part of a NSW Department of Primary Industries project designed to identify which
areas of the NSW Apple Industry require research and development. Data generated from this
survey will also help the NSW apple industry with development plans.
If you are a farmer currently growing apples in NSW we need your ideas and expertise. Please take
part in our survey so you can contribute to the future direction of research and development of
your industry!
If you have any questions about the survey please contact Jessica Fearnley on 0437 284 010 or
email at jessica.fearnley@dpi.nsw.gov.au (Orange) or Kevin Dodds on 0427 918 315 or email at
kevin.dodds@dpi.nsw.gov.au (Tumut).
Your responses will remain confidential and the more detail you can provide, the more useful the
results will be.
This survey will take approximately 10 minutes to complete.
Complete before midnight 25th August 2019 for a chance to win a GDot soil moisture sensor valued
at $290!
Terms and conditions
The chance draw is open to people aged 18 and over who provide their email address at the end of the survey. The closing
date of the chance draw is 23:59 on Sunday the 25th of August 2019. Entries received outside this time period will not be
included. One winner will be chosen from a random draw of entries received in accordance with the terms and conditions.
The draw will be performed by a random computer process. The draw will be conducted at 9 am Monday the 26th of August
2019. The winner will receive an MEA GDot Soil Moisture Tension Display, 1 Gypsum Block soil moisture sensor with 2
metres of cable, 2 'AA' batteries, pre-installed, screws and cable ties to mount the GDot and sand/bentonite mix for
installation. The winner will be notified by email on the 27th of August 2019 and must provide an email address to claim their
prize. If a winner does not respond within 14 days of being notified by the Department, then the winner's prize will be forfeited
and the Department shall be entitled to select another winner in accordance with the process described above (and that
winner will have to respond to notification of their win within 14 days or else they will also forfeit their prize). If a winner
rejects their prize or the entry is invalid or in breach of these terms and conditions, the winner's prize will be forfeited and the
Department shall be entitled to select another winner. The prize will be sent to the winner by the Department. The prize is
non-exchangeable, non-transferable, and is not redeemable for cash or other prizes. The winner’s name will be sent out to all
participants of the survey via email.
1
28 | Jessica Fearnley, Kevin Dodds and Amanda Warren-SmithPrivacy statement
This is a voluntary survey. The information will be used by the NSW Department of Primary Industries as part of its reporting
requirements and to inform future projects and support services. The data will be used solely for the purpose for which they
have been collected and we will ensure that the data is stored securely, with appropriate security safeguards.
* 1. Do you accept the terms and conditions?
Yes
2. What region is your orchard located in?
Orange
Batlow
Bilpin
Sydney Basin
Other (please specify)
3. What is your age?
Under 18
19-25
26-35
36-45
46-55
56-65
66-75
76-85
86+
2
NSW APPLE INDUSTRY BASELINE SUR VEY 2019 | 294. What is you gender?
Male
Female
Other
Rather not say
5. What generation farmer are you?
1st Generation
2nd Generation
3rd Generation
4th Generation
5th Generation
>6th Generation
6. Size of productive orchard (in hectares)
7. How many orchards have been amalgamated with the original orchard?
None
1
2
3
>4
Other (please specify)
8. Are apples the main agricultural practice in your business?
Yes
If no, what is?
9. What is the ratio of apples to your other enterprise?
3
30 | Jessica Fearnley, Kevin Dodds and Amanda Warren-Smith10. If applicable, what best describes your future planted area for cherries?
Increasing
Maintaining
Decreasing
Not applicable
11. What are the current varieties you are growing in your orchard and how many acresor hectares
do you grow of each variety (choose either acres or hectares)
Hectares Typical yield (t/ha) Typical first grade packout (%)
Pink Lady Ordinary Strain
Pink Lady High Colour
Strain
Gala Ordinary Strain
Gala High Colour Strain
Kanzi
Jazz
Bravo
Red Delicious
Fuji
Granny Smith
Jonathans
Braeburn
Sundowner
Other (please specify)
12. Do you use netting in your orchard?
No
If yes, is it structured or drape?
4
NSW APPLE INDUSTRY BASELINE SUR VEY 2019 | 3113. What percentage of your orchard is covered by net?
NSW apple industry baseline survey 2019
Management practices
14. What percentage of your orchard is free standing or trellised?
Free standing
Trellised
15. What is your current irrigation method? (Tick all that apply)
Drip
Overhead
Microsprinkler
Other (please specify)
16. Do you use nutrient budgeting?
Yes
No
5
32 | Jessica Fearnley, Kevin Dodds and Amanda Warren-Smith17. Do you use any of the following labour saving technology? (Tick all that apply)
No
Mechanical pruning
Mechanical thinning
Motorised platforms
Mechanical harvesting
Packhouse automation
Other (please specify)
18. How likely are you to use robotics to replace labour in the next 5 years?
Extremely unlikely
Unlikely
Not sure
Likely
Extremely likely
19. How many full time staff do you have? (Please include yourself and any family members that
may fall under this category)
20. How many part-time staff do you have? (Please include any family members that may fall under
this category)
21. How many casual staff do you employ over a year on the following tasks?
Pruning
Thinning
Picking
Packing
6
NSW APPLE INDUSTRY BASELINE SUR VEY 2019 | 33NSW apple industry baseline survey 2019
Postharvest and Marketing
22. Do you have your own cool storage facility?
No
If yes, what capacity (bins/tonnes)
23. Do you have your own packhouse?
No
If yes, do you pack fruit for yourself only or others?
24. Are you a member of any co-operatives? (Tick all that apply)
Farming co-operatives
Storage co-operatives
Packing co-operatives
Marketing co-operatives
No, I am not a member of any co-operatives
Other (please specify)
25. Are any of your apples processed?
No
If yes, what value added products do you produce?
7
34 | Jessica Fearnley, Kevin Dodds and Amanda Warren-Smith26. What percentage of your final yield goes to:
Roadside markets?
Direct markets?
Wholesale markets?
International markets?
Processing?
27. Are you currently marketing your own produce?
No
If yes, how?
28. Would you be interested in attending workshops about expanding the export market for apples?
These workshops may include delegate opportunities, preparing your orchard for export and
potential markets that may be right for your product
Yes
No
NSW apple industry baseline survey 2019
Research and development
29. What do you see to be the biggest constraint to the NSW apple industry in your region?
30. What do you see as your greatest challenge for your orchard to thrive?
8
NSW APPLE INDUSTRY BASELINE SUR VEY 2019 | 3531. In what areas would you like to see more research and development? (e.g. soil nutrition, post
harvest technologies)
1
2
3
4
5
NSW apple industry baseline survey 2019
Future intentions
32. Do you have any firm plans to change any of the following in 5 years? (Tick all that apply)
Farm size
Labour organisation
Arable enterprise
Buildings
Machinery
Retirement
Succession planning
Alternative earnings
Other (please specify)
33. What are your apple tree planting intentions for the future?
Increasing
Maintaining
Decreasing
9
36 | Jessica Fearnley, Kevin Dodds and Amanda Warren-SmithNSW apple industry baseline survey 2019
Information sources
34. Where do you source information on production methods? (Tick all that apply)
DPI
APAL publications
Local horticulturists
Other (please specify)
35. How do you prefer to be contacted by the DPI? (Tick all that apply)
Email
Phone call
SMS
Social media (ie. Facebook groups, Twitter)
Local merchants and co-operatives
Other (please specify)
36. If you would like a copy of the survey results please provide your email address. (You must
provide email address if you wish to enter the prize draw)
10
NSW APPLE INDUSTRY BASELINE SUR VEY 2019 | 37You can also read