SECTOR NUCLEAR - 2013 COMMUNITY REPORT - Durham Workforce ...
←
→
Page content transcription
If your browser does not render page correctly, please read the page content below
NUCLEAR
              SECTOR

2013 COMMUNITY REPORT
T a b le o f C ontents
                                                                                    2013
List of Figures and Tables ������������������������������������������������������������������������ 2
Executive Summary................................................................................... 3
Introduction............................................................................................... 4
Methodology............................................................................................. 5
National Nuclear Outlook ������������������������������������������������������������������������ 6
Provincial Nuclear Outlook ��������������������������������������������������������������������� 12
Durham Region Nuclear Outlook ����������������������������������������������������������� 14
Nuclear Refurbishment in Ontario ��������������������������������������������������������� 25
New Build at Darlington Nuclear ����������������������������������������������������������� 28
Durham Region Supply Chain ���������������������������������������������������������������� 31
Recommendations .................................................................................. 34
Bibliography............................................................................................ 35
Appendix I............................................................................................... 36
Appendix II ............................................................................................. 37
Appendix III ........................................................................................... 38

                                                                                          NUCLEAR SECTOR • 2013 COMMUNITY REPORT
2013 L ist o f Fi g ures an d T a b les Electricity Generation in Canada (January - November 2012).................................................................................................... 6 Nuclear Operations in Canada.................................................................................................................................................... 7 Nuclear Power Generating Units in Canada................................................................................................................................ 8 Nuclear Occupational Outlook for Canada................................................................................................................................. 9 Employment Impact of Production of Electricity in Canada, 2005 (Jobs)................................................................................. 10 GDP Impact of Production of 86,00 GWh of Electricity in Canada in 2005.............................................................................. 11 Electricity Generation in Ontario (January - November 2012).................................................................................................. 12 Durham Region Occupations by Industry ................................................................................................................................ 15 Occupational Comparison Durham Region and Bruce County ................................................................................................ 16 Educational Attainment within the Power Generating, Transmission and Distribution Industry...................................................................................................................................... 17 Area of Study within the Power Generating, Transmission and Distribution Industry............................................................... 18 Durham Region Commuting Patterns by Industry ................................................................................................................... 19 Durham Region Commuting Patterns Utilities Industry............................................................................................................. 19 Count of OPG Employees by Employee Type and Worksite (2003 Yearend)........................................................................... 20 Count of OPG Employees by Employee Type and Worksite (2007 Yearend)........................................................................... 20 Count of OPG Employees by Employee Type and Worksite (2011 Yearend)........................................................................... 20 Count of OPG Employees 2003, 2007, 2011............................................................................................................................ 21 Age Distribution, Durham Region, 2011................................................................................................................................... 22 Count of OPG Employees by Age Range (September 30, 2012)............................................................................................. 23 Forward Sortation Area of OPG Employees.............................................................................................................................. 24 GIS Mapping of OPG Employees.............................................................................................................................................. 24 Assumed Schedule for Refurbishment Program........................................................................................................................ 25 Cost Estimates for CANDU refurbishment................................................................................................................................ 26 Breakdown of Capital Cost of Refurbishment........................................................................................................................... 26 Labour Costs for Each Reactor Unit Refurbishment.................................................................................................................. 27 GDP Impact of Construction of Two CANDU 6 Reactors.......................................................................................................... 28 Employment Impact of Construction of Two CANDU 6 Reactors............................................................................................. 29 Direct and Secondary Impacts of Nuclear New Build............................................................................................................... 30 Products and Services Supplied by the Nuclear Supply Chain in Durham Region................................................................... 32 Products and Services Supplied by Indirect Nuclear Supply Chain in Durham Region............................................................ 33 2 NUCLEAR SECTOR • 2013 COMMUNITY REPORT
E x ecuti v e S ummary
                                                                              2013
The Durham Workforce Authority has initiated this sector study to examine the nuclear sector within the local context
of Durham Region. Durham Region is well situated to become a hub for the nuclear industry being home to Darlington
Nuclear and Pickering Nuclear as well as 40 supply chain companies, four post-secondary institutions and a skilled
workforce. In order for Durham Region to assert itself as a leader within the nuclear industry a strategic direction for actions
and partnerships needs to be developed to support the labour force demands, and position the sector to respond to
business opportunities as they arise. This sector study aims at providing the evidence to develop these comprehensive
strategies.

This report addresses aims to:
• Provide a labour market profile which informs supply and demand for Durham Region
• Inform workforce development planning to meeting occupational demands
• Develop targeted strategies with recommended actions to address labour shortages in the sector
• Assess the local supply chain and develop strategic approaches to assist in preparation for future nuclear projects

 The report is broken down into the following components:
• National Nuclear Outlook assesses the nuclear industry at a national level including an assessment of the nuclear sector
   and its workforce. This section aims at providing a broad overview of the sector, its size and workforce development from
   a Canadian perspective.
• Provincial Nuclear Outlook examines Ontario as the hub for the nuclear industry in Canada. Further, this section
   examines important legislation including the Long Term Energy Plan and its impact on the future of the nuclear industry.
• Durham Region Nuclear Outlook provides a situational analysis into the nuclear industry in Durham Region including
   information pertaining to occupations, educational attainment and commuting patterns. In addition, this section provides
   a detailed analysis of Ontario Power Generation's workforce in the Durham Region.
• Nuclear Refurbishment in Ontario provides an overview for refurbishment projects across Ontario. This section provides
   detailed information relating to the employment and economic impacts that refurbishment projects will have.
• New Build at Darlington Nuclear examines the potential for New Build projects at the Darlington nuclear site. Further,
   it looks at the potential economic impact as well as employment prospects relating to planning, project management,
   construction and operation.
• Durham Region Supply Chain assesses the suppliers currently operating in the Durham Region and examines the
   strengths of the suppliers in terms of their products and services.
• Recommendations provide action items that can be utilized to see Durham Region become a hub for the nuclear
   industry.

The following pages will offer both qualitative and quantitative data analysis leading to a customized local nuclear sector
strategy. In order for Durham Region to be well positioned as new nuclear projects are announced, there is a need to
successfully attract and retain the skilled workforce required by direct nuclear employers, as well as members of the supply
chain and indirect employers in a wide variety of industries.

                                                                                NUCLEAR SECTOR • 2013 COMMUNITY REPORT 3
2013
 I ntro d uction
 Ontario has made investments into the power generation in Ontario; however, there remains much to be done. As noted in
 Ontario’s Long Term Energy Plan, presently, Ontario has a sufficient electricity supply, but will require more clean power for
 the future. As Ontario’s energy infrastructure ages, Ontario will need to rebuild or create another 15,000 Megawatts (MW)
 of generating capacity over the next 20 years. (Government of Ontario, 2010)

 Ontario’s Long Term Energy Plan outlines the need for nuclear energy to provide and continue to provide reliable and clean
 baseload electricity for the province. Further, nuclear technology is a major and integral part of Canadian manufacturing
 and innovation, contributing over $5 billion to the Canadian economy through a variety of channels (Canadian Nuclear
 Association, 2013). Canada’s nuclear industry employs approximately 40,000 individuals directly and indirectly in many
 highly skilled, sustainable occupations. (Canadian Nuclear Association, 2013)

 Durham Region is home to two nuclear power generating stations, Pickering and Darlington Nuclear, and 40 members of
 the supply chain. All of these employers provide direct employment opportunities for area residents, as well as the creation
 of indirect jobs in other industries such as construction, retail and food and accommodation.

 The Durham Workforce Authority has initiated this sector study to examine the nuclear sector within the local context
 of Durham Region. In essence, this work will provide the necessary evidence to develop a strategic direction for actions
 and partnerships supporting labour force demand and position this sector, and all of its suppliers to respond to business
 opportunities as they arise, particularly in response to the Refurbishment and potentially, New Build projects. Durham
 Region is well situated to become a gateway for nuclear energy in the province with Pickering and Darlington Nuclear, three
 post-secondary institutions, a thriving supply chain, a skilled workforce and engaged governmental officials and community
 partners.

 This report consists of an overview into the nuclear industry in Ontario and Canada, as well as in-depth data analysis of the
 industry as it pertains to Durham Region. It will also examine the refurbishment and new build projects and their economic
 impacts as well as impacts on the local labour market. Finally this report provides 15 new occupational profiles to provide
 insight into some of the direct nuclear occupations prevalent within Durham Region.

4 NUCLEAR SECTOR • 2013 COMMUNITY REPORT

M et h o d olo g y
                                                                           2013
The Nuclear Energy Study draws on data from Statistics Canada and broad academic reports and literature related to
the nuclear energy on a regional, provincial and national level to present an empirical profile of Durham Region’s nuclear
industry.

A combination of methodologies inform this report including data analysis on occupations, industries, commuting patterns
and the Durham Region labour force, as well as collecting and analyzing information and data provided by stakeholders
(including municipal, provincial governments, academic institutions, sector councils, industry groups, and associations,
community agencies, and employers).

 In addition to the statistics available through Workforce Planning Ontario, and various other organizations, the labour
market information related to the nuclear industry comes from reports and publications. Finally, several key informant
consultations that are conducted throughout this process are an important source of information, as are the events and
conferences either organized or attended by the Durham Workforce Authority staff.

                                                                              NUCLEAR SECTOR • 2013 COMMUNITY REPORT 5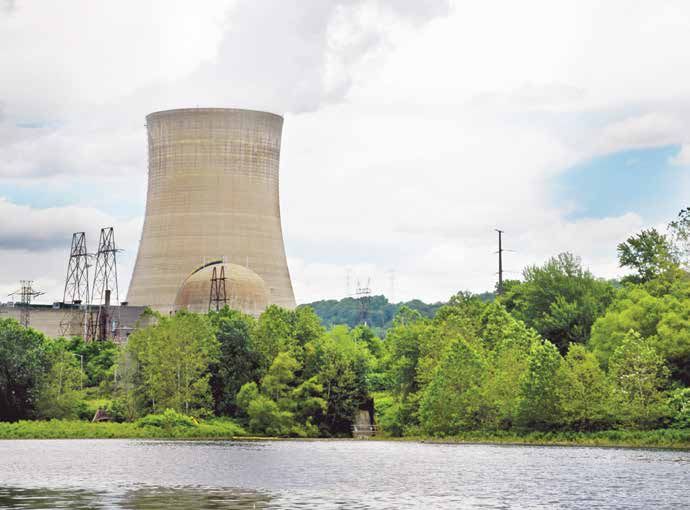
2013
 N ational N uclear O utloo k
 Since 1941 Canada has been a leader in nuclear research, medicine and electricity production. (Canadian Nuclear
 Association, 2011) Canada’s first electricity-producing reactor, the Rophton Nuclear Power Demonstration reactor came
 online in 1962 (Masri, et al., 2008). Nuclear energy is part of the Canadian national science and innovation system, which
 involved over 30 universities and six major research centres (Canadian Manufacturers and Exporters, 2012). Beyond being
 a source of innovation, as depicted by Figure 1, nuclear power generation now accounts for over 15 percent of all electric
 power generation in Canada1.

                Electricity Generation in Canada
                January -November 2012
                                    2%
                            0%           0%
                     0%
                                                                               • Hydro
                               5%                                              • Nuclear

                                                                               • Conventional Steam
                     15%                                                       • Internal Combustion

                                                                               • Combustion Turbines

                                                                               • Tidal
                     15%                    63%
                                                                               • Wind

                                                                               • Solar

                                                                              Figure 1: Electricity Generation in Canada
                                                                              (January - November 2012)

 Source: Statistics Canada. Table 127-0002 - Electric power generation, by class of electricity producer, monthly (megawatt
 hour), accessed February 11, 2013.

 In addition to being a critical source of base load electricity supply, nuclear energy is a major contributor to the Canadian
 economy with major impacts on Gross Domestic Product (GDP), employment and government revenue (Canadian Nuclear
 Association, 2009).

 Crucial to Canada’s success in the nuclear industry is the availability of uranium. Currently, Canada holds the large reserves
 of the world’s highest grade uranium. Mining is taking place at sites in Northern Saskatchewan. Canada uses about 10% of
 the uranium domestically while the rest is exported generating over $380 million in GDP and $100 million in Government
 revenue (Canadian Nuclear Association, 2009).

 The nuclear industry in Canada spans the entire country. Canada has 22 CANDU reactors, two of which are in a safe
 shutdown state. Twenty are in the province of Ontario, with one in New Brunswick and another in Quebec. Together,
 the annual electricity generation is over 80 terawatt-hours (TWh), which makes Canada the seventh largest generator of
 nuclear power in the world (Canadian Nuclear Association, 2013). Table 1 depicts the 22 CANDU reactors in Canada, their
 operating status and their net megawatt electrical capacity.

 1
     StatsCan data

6 NUCLEAR SECTOR • 2013 COMMUNITY REPORT
Table 1: Nuclear Operations in Canada (Masri, et al., 2008)

                      Unit                                    Operating Status
                                                                                   2013        Capacity MWe Net
                                                                Bruce A units

 Unit 1                                            Operating                            750

 Unit 2                                            Operating                            750
 Unit 3                                            Operating                            750
 Unit 4                                            Operating                            750

                                                                Bruce B units
 Unit 5                                            Operating                            817
 Unit 6                                            Operating                            817
 Unit 7                                            Operating                            817
 Unit 8                                            Operating                            817

                                                              Darlington Units
 Unit 1                                            Operating                            881
 Unit 2                                            Operating                            881
 Unit 3                                            Operating                            881
 Unit 4                                            Operating                            881

                                                              Point Lepreau Unit
 Unit 1                                            Operating                            635

                                                                Gentilly Unit
 Unit 1                                            Operating                            635

                                                              Pickering A units
 Unit 1                                            Operating                            515

 Unit 2                                            Defueled                             -

 Unit 3                                            Shutdown and defueling in progress   -
 Unit 4                                            Operating                            515

                                                              Pickering B units
 Unit 5                                            Operating                            516
 Unit 6                                            Operating                            516
 Unit 7                                            Operating                            516
 Unit 8                                            Operating                            516

                                                                                   NUCLEAR SECTOR • 2013 COMMUNITY REPORT 7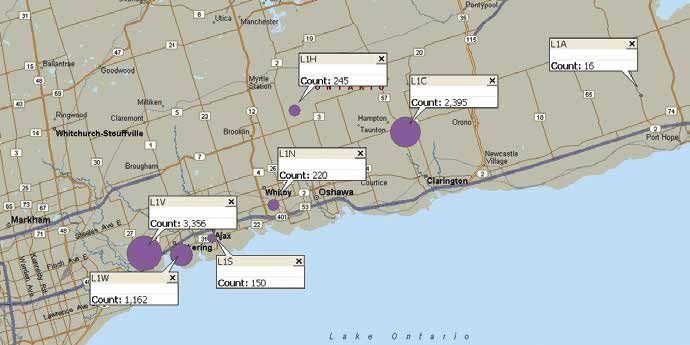
2013
 While nuclear power generation is limited to three provinces, operating uranium mines, proposed mines, former mines and
 uranium fuel cycles span the entire country as demonstrated by Figure 2 below.

                                                                           Figure 2: Nuclear Power Generating Units in Canada
                                                                           (Canadian Manufacturers and Exporters, 2012)

 The Canadian nuclear industry provides Canadians with long-term, sustainable employment opportunities. These
 occupations are generally long lasting with employment lasting five to 50 years, well paid and provide a need for
 continuous learning, training and development (Canadian Manufacturers and Exporters, 2012). The Canadian nuclear
 industry employs over 60,000 Canadians both directly and indirectly. The 30,000 direct nuclear industry jobs are primarily
 in uranium mining and power generation operations however, areas such as nuclear medicine and research also contribute
 to this total. The indirect opportunities supported by the nuclear industry can be defined as occupations in the community
 related to nuclear operations or in other industries that are generated due to the increase in labour force and/or population
 brought on by a particular project. This can include jobs in the manufacturing, hospitality, human resources or housing
 sectors, just to name a few (Canadian Nuclear Association, 2013).

 While regular power generation does not see a huge influx of indirect jobs, major projects such as refurbishment and new
 build see these jobs increase at an exponential rate. The proposed new build at the Darlington nuclear site, for example,
 would see a full sized, two-reactor plant built. The construction of the facility alone would require 400,000 cubic meters of
 concrete, 20,000 tonnes of steel, and 700 kilometers of wiring and 70 kilometers of piping (Canadian Manufacturers and
 Exporters, 2012).

 The nuclear industry is driven by projects this however, does not translate into short-term career opportunities. Jobs
 within the nuclear sector are long lasting and sustainable. The Canadian Manufacturers & Exporters completed a report
 in November 2012 which outlined the type of occupation, number of jobs and longevity of jobs within the nuclear sector.
 Table 2 depicts this information.

8 NUCLEAR SECTOR • 2013 COMMUNITY REPORT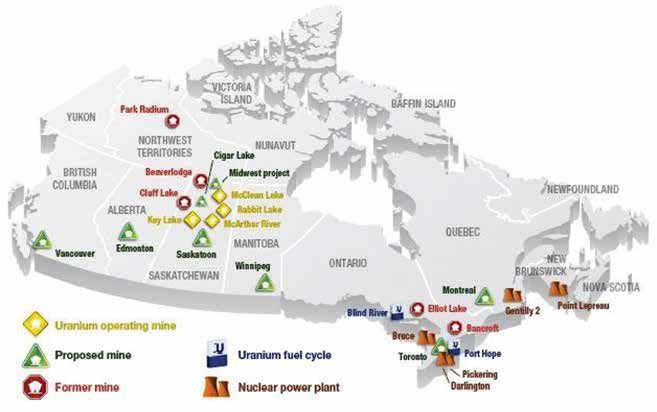
Number of Jobs              Projected Length
                                                                                      2013
Table 2: Nuclear Occupational Outlook for Canada (Canadian Manufacturers and Exporters, 2012)

  Type of Occupation                                                                                 Reasoning, Comments,
                                                                  of Employment                          Assumptions
 Mining                            10,000+                      Indefinitely                    Uranium is high quality resource with
                                                                                                large amounts present in Canada. It
                                   (Growth likely due to
                                                                                                is projected to remain a competitive
                                   demand)
                                                                                                resource for decades to come.
 Nuclear Power Generation          19,000                       Until 2050                      Assuming full refurbishment in Ontario
 (Operators)                                                                                    as well as new build at Darlington. Does
                                                                                                not account for other potential new
                                                                                                build nor foreign operation
 Nuclear Power Plant               10,000+                      11 years                        Assuming ten refurbishment as per the
 Refurbishment                                                                                  Ontario Long Term Energy Plan. Does
                                                                                                not include refurbishment of Gentilly 2.
 New Build                         21,000+                      5 years                         Assuming two full-sized reactors at
                                                                                                Darlington with majority Canadian
                                                                                                content (as is likely to be required by
                                                                                                the scope and procurement processes)

Further Notes: all assumptions are conservative, including 1:1 relationship of direct to indirect employment. Figures exclude nuclear-related
jobs outside mining and power sectors (i.e., medicine, universities, research laboratories, standards and auditing organizations). Figures
also exclude employment in the plan shutdown/decommissioning process. There has been no assumption about new build other than
Darlington, such as CANDU units outside of Canada, or small modular units which would materially increase employment

                                                                                         NUCLEAR SECTOR • 2013 COMMUNITY REPORT 9
2013
In June 2008, the Canadian Energy Research Institute (CERI) presented a report to the Canadian Nuclear Association
entitled “The Canadian Nuclear Industry: Contributions to the Canadian Economy.” Encompassed in the report was
the economic impact of the nuclear industry to Canada in terms of gross domestic product (GDP), employment and
government revenue. To determine figures related to GDP, employment and government revenue, CERI utilized the
input-output model (I-O model) which is a modelling approach that has been extensively used in the fields of energy
and environmental police and activity analysis, regional economic planning and development and resource planning and
management. The I-O model used in this study is based on the national I-O table produced by Statistics Canada in 2004,
for a detailed list of the sectors utilized, including example activities for each sector, see Appendix I. From this model, CERI
was able to determine that the operation of the existing 17 nuclear units provided 66,694 full-time jobs in Canada in 2005.
This figure includes both direct and indirect occupations Figure 3 illustrates the sectoral employment impact resulting from
the operation of nuclear power plants. As expected, the electricity sector (i.e., nuclear plants) represented 25% of the total
employment created in 2005. Other sectors, such as business services and retail also provided significant jobs 17% and
11% respectively (Timilsina, et al., 2008).
Figure 3: Employment Impact of Production of Electricity in Canada, 2005 (Jobs) (Timilsina, et al., 2008)
Employment impact of production of electricity from
17 nuclear power generation units in Canada, 2005 (Jobs)
Wholesale 1596
Transportation & Communication 2543
Other Services 7313
Retail 3124
Other Mining 1871
Natural Gas 100
Manufacturing 4816
S ector
Heath 5011
Gas Utility 60
Forestry 189
Food and Accommodation Service 3827
Finance, Insurance & Real Estate 3645
Electricity Utility 16137
Education 3895
Crude Oil 62
Construction 507
Coal 0
Business Sevices 11128
Agriculture 868
0 2000 4000 6000 8000 10000 12000 14000 16000 18000
N umber of J obs
10 NUCLEAR SECTOR • 2013 COMMUNITY REPORT2013
In the aforementioned report, CERI also assessed the economic impact of electricity generation from nuclear power plants.
At the end of 2005, there were 17 units in Canada with a total capacity of 12,767 MW. In 2005, these units generated
86,000 gigawatt-hours (GWh). The value of total electricity sold from these units was estimated to be $4.988 billion in
2005. The operation of these power plants would have created a total GDP of $6.303 billion that year. Figure 4 illustrates
the distribution of GDP impact to various sectors resulting from the operation of nuclear power plants. As expected, the
electricity sector saw the highest impact with nearly half of the total GDP impact. This was followed by finance, insurance
and real estate with 12%, manufacturing with 7% and other mining sectors, which includes uranium mining and refining with
6% of the total (Timilsina, et al., 2008).
Figure 4: GDP Impact of Production of 86,00 GWh of Electricity in Canada in 2005 (Timilsina, et al., 2008)
GDP Impact of Production of 86,00 GWh of Electricity
from 17 Nuclear Power Generation Units in Canada in 2005
Wholesale 152
Transportation & Communication 143
Other Services 216
Retail 513
Other Mining 398
Natural Gas 52
Manufacturing 407
S ector
Heath 7
Gas Utility 30
Forestry 13
Food and Accommodation Service 99
Finance, Insurance & Real Estate 786
Electricity Utility 3006
Education 8
Crude Oil 27
Construction 33
Coal 0
Business Sevices 313
Agriculture 31
0 500 1000 1500 2000 2500 3000 3500
M illions of dollars
While an infusion of $6.3 billion to the total GDP in Canada in 2005 is a considerable sum, this data does not encompass
refurbishment projects that are currently underway at nuclear power plants across Canada. The Canadian Manufacturers
and Exporters November 2012 report outlined the economic impact of mining as well as the combination of all 10
refurbishment programs across Canada as well as the operations of the power plants during the refurbishment program
period. This includes all aspects of operations including employment, labour income, fuel cost, equipment and materials.
The report concluded that current mining and plant operations, including refurbishment bring $7.9 billion into the Canadian
economy annually (Canadian Nuclear Association, 2013).
NUCLEAR SECTOR • 2013 COMMUNITY REPORT 112013
P ro v incial N uclear O utloo k
Ontario is the national leader in nuclear power generation. While nuclear power is a large contributor to electricity
generation in Canada, it’s impact in Ontario even more crucial. In Ontario, nuclear power is a critical source of base load
electricity supply. Figure 5 depicts the breakdown of electricity generation in Canada in 2012. From January to November
2012, nuclear power was responsible for 62% of the electricity generation.
The Ontario government views nuclear power as a reliable, safe supplier of the province’s baseload generation needs
given nuclear operates 24 hours a day, seven days a week. Further, since nuclear energy does not produce any primary air
pollution or release greenhouse gases into the atmosphere it is an able participant in Ontario’s desire to maintain a clean,
modern and reliable electricity system for all Ontarians (Government of Ontario, 2010). In the Long Term Energy Plan the
Ontario government outlined Ontario’s future needs from nuclear power generation, and the plan to ensure nuclear was
able to continue to supply reliable, safe electricity.
Electricity Generation in OntarioJanuary -November 2012
2%
0%
0% • Hydro
6% • Conventional Steam
• Nuclear
24%
• Internal Combustion
• Combustion Turbines
• Wind
6%
• Solar
62%
Source: Statistics Canada. Table 127-0002 - Electric power
generation, by class of electricity producer, monthly (megawatt
hour), accessed February 11, 2013.
Figure 5: Electricity Generation in Ontario (January - November 2012)
12 NUCLEAR SECTOR • 2013 COMMUNITY REPORT2013
In 2007, the Ontario government noted that units at Bruce B and Darlington were expected to reach the end of their service
lives over the next decade and as such, in order to extend their lives they would have to be shut down for approximately
three years while undergoing refurbishment. (Government of Ontario, 2010)In 2007 it was expected that there was a need
for planning for new nuclear build at Darlington to begin immediately, however, in the last six years demand has declined
and investment in renewable has increased thus, according to the Ontario government, reducing the immediate need for
new nuclear. The Long Term Energy Plan however, does outline the need for additional investment in nuclear generation
in order to preserve the long-term reliability of the system, particularly for baseload generation (Government of Ontario,
2010).
Within the next ten years of the Long Term Energy Plan, 10,000 MW of existing nuclear capacity will need to be refurbished.
The Ontario government has committed to continuing to use nuclear for approximately 50% of Ontario’s energy supply
which equates to a capacity of 12,000 MW. With the scheduled defueling and shutdown of Pickering in 2020, Darlington
and Bruce will need to be refurbished and modernized to reach their capacity of 10,000 MW. The remaining 2,000 MW
capacity that Ontario will need for its projected demand will be made up of new nuclear at Darlington. It must be noted
that the construction of new nuclear infrastructure requires a significant lead time of approximately eight to ten years to
commercial operation. Beginning in 2008 the government of Ontario launched a process to procure two new units at the
Darlington site however, due to a decrease in electricity demand, political uncertainties and the potential privatization
of Atomic Energy of Canada Limited (AECL) the process for suspended. In the meantime, Ontario Power Generation
(OPG) has continued two initiatives related to the new build procurement process: the environmental assessment and the
obtaining of a site preparation licence at Darlington (Government of Ontario, 2010). OPG saw many successes in 2012,
beginning on May 2, 2012 when the Federal government responded to the recommendations of the Joint Review Panel,
a panel of the Canadian Nuclear Safety Commission, and approved the Darlington New Nuclear Project Environmental
Assessment (Ontario Power Generation, 2012). Then, on June 22, 212 OPG signed agreements with Westinghouse and
SNC-Lavalin/Candu Energy Inc. to prepare detailed construction plans, schedules and cost estimates for two potential
nuclear reactors at Darlington. The reports will be designed to help inform the government’s decision on whether to move
forward with new nuclear at the Darlington site (Ontario Power Generation, 2012). Finally on August 17, 2012 the Joint
Review Panel announced its decision to issue the Licence to Prepare Site for the Darlington New Nuclear Project which is
the first of three licences required in the preparation, construction and operations of new nuclear reactors (Ontario Power
Generation, 2012).
NUCLEAR SECTOR • 2013 COMMUNITY REPORT 132013
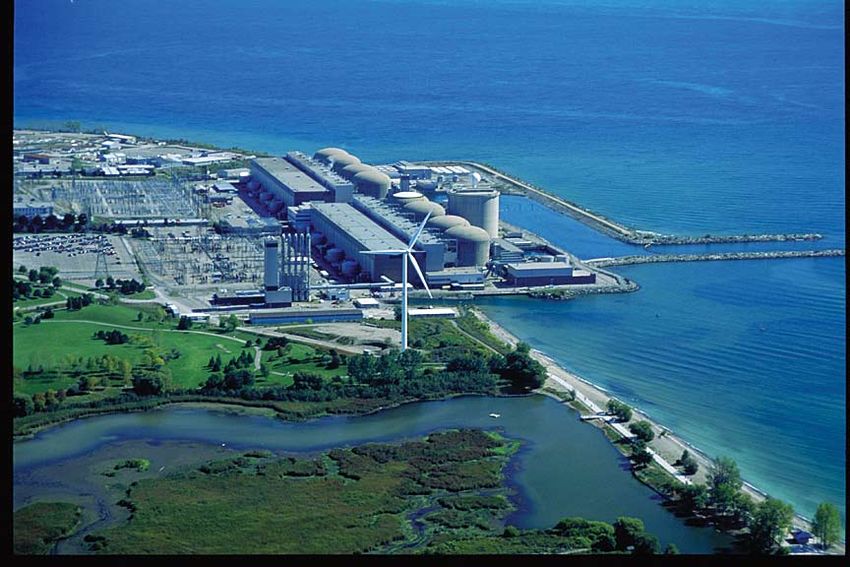
Dur h am R e g ion N uclear O utloo k
Since 1965, the nuclear industry in Durham Region has been growing. Ontario Power Generation (OPG) owns and operates
the Pickering and Darlington Nuclear Power Stations which have a combined generating capacity of approximately 6,600
megawatts (Ontario Power Generation, 2013). While the two OPG nuclear plants form the cornerstone of the nuclear
industry in Durham Region, major educational institutions such as the University of Ontario Institute of Technology and
Durham College play a fundamental role through providing employee and future-employee education, as well as research.
According the 2006 Census there were 190,105 jobs in Durham. Of those jobs, 8,515, or 4.5% were in NAICS 2211 -
Electric power generation2, transmission and distribution, which encompasses NAICS 22111 – Electric power generation
and NAICS 221113 – Nuclear electric power generation2. Despite the fact that this number is not reflective of occupations
solely related to nuclear, this figure is significant when there are only approximately 30,000 jobs on a national level that that
are direct nuclear occupations.
Table 3 depicts the occupations in Durham where over 50% of the jobs fall within NAICS 22113.
2
Unfortunately, Statistics Canada does not provide information more detailed than four-digit NAICS codes for the purposes of labour market information on
the Labour Force Survey or Census. As such, for the purposes of this report, the NAICS used to identify occupations related to direct nuclear occupations will
be NAICS 2211 – Electric power generation, transmission and distribution.
3
This table depicts the jobs of the employed labour force aged 15 and over by place of work. Therefore, this chart is representative of the jobs in Durham
regardless of where the individual resides.
14 NUCLEAR SECTOR • 2013 COMMUNITY REPORTTable 3: Durham Region Occupations by Industry
Occupation Number of Jobs –
2013
Number of Jobs Percentage of all jobs in
All Industries – 2211 Electric that occupation found
power generation, in 2211 Electric power
transmission and generation, transmission
distribution and distribution
All Occupations 190105 8515 4.5%
0912 Utilities managers 610 540 88.5%
2283 Systems testing 10 10 100%
technicians
7243 Power systems 345 345 100%
electricians
7244 Electrical power line 115 100 87%
and cable workers
7262 Boilermakers 25 20 80%
735 Stationary engineers 1445 1345 93.1%
and power station operators
7352 Power systems and 1315 1300 98.9%
power station operators
9212 Supervisors, 350 275 78.6%
petroleum, gas and
chemical processing
2111 Physicists and 30 20 66.7%
astronomers
2132 Mechanical engineers 1275 645 50.6%
2133 Electrical and 640 405 63.3%
electronics engineers
2142 Metallurgical and 15 10 66.7%
materials engineers
2232 Mechanical 335 170 50.8%
engineering technologists
and technicians
2241 Electrical and 450 230 51.1%
electronics engineering
technologists and
technicians
2243 Industrial instrument 275 165 60%
technicians and mechanics
7212 Contractors and 140 80 57.1%
supervisors, electrical trades
and telecommunications
occupations
7333 Electrical mechanics 100 50 50%
7383 Other trades and 20 10 50%
related occupations
7264 Ironworkers 65 30 46.2%
Source: Statistics Canada, Census, 2006
NUCLEAR SECTOR • 2013 COMMUNITY REPORT 152013
In an effort to get a more accurate representation as to which types of occupations are within the nuclear industry, a
comparison was made between Durham Region and Bruce County. Bruce County was selected for a comparison due to
the Bruce Power Plant and its similarities with OPG. In addition, given Bruce County is smaller than Durham Region with
less diverse industry, it is likely that most of the occupations in NAICS 2211 – Electric power generation, transmission and
distribution would be directly related to the nuclear power plant operations.
Table 4: Occupational Comparison Durham Region and Bruce County
Occupation Durham Bruce
Percentage of all jobs in that Percentage of all jobs in that
occupation found in 2211 occupation found in 2211
Electric power generation, Electric power generation,
transmission and distribution transmission and distribution
All Occupations 4.5% 12.8%
0912 Utilities managers 88.5% 88.6%
2283 Systems testing technicians 100% 0%
7243 Power systems electricians 100% 105%
7244 Electrical power line and 87% 90.5%
cable workers
7262 Boilermakers 80% 57.1%
735 Stationary engineers and 93.1% 96.6%
power station operators
7352 Power systems and power 98.9% 98.6%
station operators
9212 Supervisors, petroleum, gas 78.6% 95.1%
and chemical processing
2111 Physicists and astronomers 66.7% 0%
2132 Mechanical engineers 50.6% 78.3%
2133 Electrical and electronics 63.3% 56%
engineers
2142 Metallurgical and materials 66.7% 0%
engineers
2232 Mechanical engineering 50.8% 96%
technologists and technicians
2241 Electrical and electronics 51.1% 81%
engineering technologists and
technicians
2243 Industrial instrument 60% 74.1%
technicians and mechanics
7212 Contractors and 57.1% 100%
supervisors, electrical trades and
telecommunications occupations
7333 Electrical mechanics 50% 66.7%
7383 Other trades and related 50% 25%
occupations
7264 Ironworkers 46.2% 78.6%
Source: Statistics Canada, Census, 2006
16 NUCLEAR SECTOR • 2013 COMMUNITY REPORT2013
For the very high proportion occupations including utilities mangers, power systems electricians, electrical power line
and cable workers, power systems and power station operators and supervisors, petroleum, gas & chemical processing
utilities, the percentages for both Durham Region and Bruce County are similar. This would allow for the conclusion
that many of these occupations would be found in the nuclear industry. In most of the other occupations where a high
proportion of residents are employed in NAICS 2211, Bruce County experiences a higher concentration in that industry.
This would suggest that in Durham Region there are various ancillary industries that employ these occupations including
mechanical engineers, industrial and manufacturing engineers, chemical technologists and technicians, mechanical
engineering technologists and technicians, electrical and electronics engineering technologists and technicians, industrial
instrument technicians and mechanics and ironworkers. The ancillary industries that employ these occupations are primarily
Manufacturing, and to a lesser extent, Professional, Scientific and Technical Services (except in the case of Ironworkers, who
are primarily employed in Construction as well as Manufacturing).
In Durham Region there are approximately 6,300 residents in the labour force4 in the electric power generation,
transmission and distribution industry. Using 2006 Census data it is possible to create a detailed description of the
educational attainment, including fields of study for these residents. Creating an educational profile for the nuclear industry
is significant because of the emphasis placed on knowledge. The Canadian Manufacturers and Exported dubbed the
nuclear industry as a high-knowledge, high-innovation industry with a large number of highly qualified personnel (Canadian
Manufacturers and Exporters, 2012). Employees in the nuclear industry must be committed to lifelong learning and training
in order to maintain the high standards required by a nuclear power generating facility. Among the Durham Region labour
force, 98.1% of residents in the electric power generation, transmission industry (NAICS 2211) have a certificate, diploma
or degree. That is over 10% higher than the proportion of the Durham Region labour force for all industries. Further, the
labour force of Durham Region residents in NAICS 2211 also have a higher proportion of residents with college, CEGEP
or other non-university certificate or diploma, bachelor’s degree or master’s degree than that of the labour force for all
industries. Table 5 depicts the breakdown of educational attainment for the Durham Region labour force for all industries as
well as NAICS 2211, electric power generation, transmission and distribution.
Table 5: Educational Attainment within the Power Generating, Transmission and Distribution Industry
Educational Attainment All NAICS 2211 Electric power generation,
Industries transmission and distribution
Total labour force by highest certificate, diploma or 100% 100%
degree
No certificate, diploma or degree 13.6% 1.9%
Certificate diploma or degree 86.5% 98.1%
High school certificate or equivalent 30% 19.1%
Apprenticeship or trades certificate or diploma 9% 14%
College, CEGEP or other non-university certificate or 26% 41.4%
diploma
University certificate or diploma blow bachelor level 4.1% 2.9%
University certificate, diploma or degree at bachelor’s 17.4% 20.6%
level or above
Bachelor’s degree 11.9% 14.8%
University certificate or diploma above bachelor level 2.4% 2.1%
Degree in medicine, dentistry, veterinary medicine or 0.3% 0%
optometry
Master’s degree 2.4% 3.2%
Earned doctorate 0.3% 3.2%
Source: Statistics Canada, Census, 2006
4
Labour force refers to both employed and unemployed residents
NUCLEAR SECTOR • 2013 COMMUNITY REPORT 172013
Of the Durham Region residents in the labour force in the electric power generation, transmission and distribution industry
approximately 79% have a postsecondary certificate, diploma or degree. In comparison, for Durham Region residents in
the labour in all industries attainment of a postsecondary certificate, diploma or degree is approximately 56.5%. Using
2005 Census data, it is possible to determine the field of study for Durham Region residents in the labour force with a
postsecondary certificate, diploma or degree. For those residents in the labour force in the power generation, transmission
and distribution industry, over 50% studied architecture, engineering and related technologies, other fields of study of
mention include business, management and public administration, physical and life sciences and technologies and social
and behavioural sciences and law. Table 6 shows the detailed breakdown of the field of study for Durham Region residents
in the labour force for all industries as well as the electric power generation, transmission and distribution (NAICS 2211).
Table 6: Area of Study within the Power Generating, Transmission and Distribution Industry
Field of Study All NAICS 2211 Electric power generation,
Industries transmission and distribution
No postsecondary certificate, diploma or degree 43.5% 21%
Education 3.4% 0.7%
Visual and performing arts, and communications 2.2% 1.2%
technologies
Humanities 2.5% 0.6%
Social and behavioural sciences and law 6.4% 4.2%
Business, management and public administration 12.7% 9.5%
Physical and life sciences and technologies 1.6% 4.4%
Mathematics, computer and information sciences 3% 1.4%
Architecture, engineering and related technologies 13.1% 50.8%
Agriculture, natural resources and conservation 0.9% 1.4%
Health, parks, recreation and fitness 7.2% 1.8%
Personal, protective and transportation services 3.5% 3.2%
Other fields of study 0% 0%
Source: Statistics Canada, Census, 2006
The information pertaining to the Durham Region labour force from the 2006 Census provides details related to industries
for employment by place of resident only. By overlaying this information with commuting pattern data for Durham Region
residents however, it is possible to develop an increasingly detailed analysis of residents in the utilities industry (NAICS
2215). Durham Region is unique in that 42% of the labour force commutes outside of the Region to work every day. The
nuclear industry however, exemplifies one of the many sectors that have a large workforce that both lives and works
within the Region. In the Durham Region, there are 7,485 residents in the labour force in the utilities industry, of those,
approximately 82% commute within the Region to work on a regular basis. The only other locations that residents commute
to work of statistical significance are Toronto and York Region. Table 7 identifies the percentage of the entire labour force
that commute from Durham Region to various surrounding regions in comparison with the labour force in the utilities
industry.
5
Statistics Canada is only able to provide commuting pattern data to a three-digit NAICS code which means data pertains to power generation, transmission
and distribution (NAICS 2211), natural gas distribution (NAICS 2212) and water, sewage and other systems (NAICS 2213)
18 NUCLEAR SECTOR • 2013 COMMUNITY REPORTTable 7: Durham Region Commuting Patterns by Industry
Commuting from/ Percentage of Labour Force
2013 Percentage of Labour Force in
Commuting To NAICS 221 Utilities
Durham/Northumberland 0.3% 0.2%
Durham/Peterborough 0.3% 0.2%
Durham/Kawartha Lakes 0.3% 0%
Durham/Durham 58.2% 81.7%
Durham/York 8.4% 2.3%
Durham/Toronto 30.2% 15.1%
Durham/Peel 2.2% 0.6%
Durham/Simcoe 0.2% 0.%
Source: Statistics Canada, Census, 2006
From Table 7 it is possible to determine the number of individuals in the utilities industry who commute from Durham
Region within Durham Region, as well as to Toronto, and York. As demonstrated by Table 8 over 5,500 workers commute
within Durham Region, thus indicating that many of the employees in the utilities sector and consequently, the nuclear
industry, both live and work within the Region.
Table 8: Durham Region Commuting Patterns Utilities Industry
Commuting from/ Industry Total Labour Force
Commuting to
Durham/Durham 221 Utilities 5,535
Durham/Toronto 221 Utilities 1,020
Durham/York 221 Utilities 155
Source: Statistics Canada, Census, 2006
Using this data we were able to ascertain that over 75% of Durham residents were in Durham jobs in the utilities industry
(NAICS 221). This provides further evidence that Durham Region is well centred to become a hub for nuclear activity within
the Region given the availability of a skilled workforce engaged in continuous learning, upgrading and recertification.
In order to take a more detailed look at the nuclear industry in Durham Region, consultation and communication with
Ontario Power Generation (OPG) were essential. OPG was able to provide data which allowed for an in-depth analysis of
the direct nuclear occupations in Durham Region. Since 2003, the number of employees at both Darlington and Pickering
Nuclear has remained very constant at approximately 8,200. This specific data set is especially significant as it provides
additional validity for the data from the 2006 Census. As previously stated, the 2006 Census identified 8,515 jobs in
Durham Region in electric power generation, transmission and distribution that signifies that approximately 96% of those
jobs are in nuclear power generation at OPG. OPG was also able to provide a breakdown of employee type for its workers.
While many occupations today are provided on either short or long-term contract, OPG has actually seen a decrease it
contractual employees since 2003, with an increase in the number of regular employees. While special projects such as
refurbishment and new build will see an increase in contract employees due to the nature of the work, ongoing power plant
operations remain to be ran and overseen by regular employees. Table 9, 10 and 11 provide the count of OPG employees
by employee type at both Darlington and Pickering Nuclear for 2003, 2007 and 2011 year end.
NUCLEAR SECTOR • 2013 COMMUNITY REPORT 192013
Table 9: Count of OPG Employees by Employee Type and Worksite (2003 Yearend)
Employee Type
Worksite Regular Non-regular Casual Contract Grand Total
Construction
Darlington 2,178 84 140 40 2,442
Darlington Area 37 1 2 30 70
Darlington Total 2,215 85 142 70 2,512
Pickering 3,799 323 403 368 4,893
Pickering Area 656 18 2 122 798
Pickering Total 4,455 341 405 490 5,691
Grand Total 6,670 426 547 560 8,203
Table 10: Count of OPG Employees by Employee Type and Worksite (2007 Yearend)
Employee Type
Worksite Regular Non-regular Casual Contract Grand Total
Construction
Darlington 2,417 138 35 19 2,609
Pickering 5,201 326 84 181 5,792
Grand Total 7,618 464 119 200 8,401
Table 11: Count of OPG Employees by Employee Type and Worksite (2011 Yearend)
Employee Type
Worksite Regular Non-regular Casual Contract Grand Total
Construction
Darlington 2,431 111 47 9 2,598
Darlington Area 16 0 0 1 17
Darlington Total 2,447 111 47 10 2,615
Pickering 3, 351 128 41 17 3,537
Pickering Area 5,348 64 0 29 2,090
Pickering Total 5,348 192 41 46 5,627
Grand Total 7,795 303 88 56 8,242
Source: Ontario Power Generation
As noted by the previous tables, there were not any significant changes in the count of total OPG employees from 2003
to 2011. There does however, remain a significant difference in the number of employees per site. Even with two units
at Pickering Nuclear in the defueling stage, Pickering continues to have considerably more employees. Figure 6 below
displays the difference in the number of employees by site in Durham Region.
20 NUCLEAR SECTOR • 2013 COMMUNITY REPORTFigure 6: Count of OPG Employees 2003, 2007, 2011
2013
Count of Total OPG Employees 2003, 2007, 2011
7,000
Number of Empoyees
6,000
5,000
4,000
3,000 Darlington
2,000 Pickering
1,000
0
2003 2007 2011
Year
Source: Ontario Power Generation
There are a few important reasons and particulars related to the difference in number of employees between Pickering
and Darlington Nuclear. Firstly, Pickering does have more units than Darlington Nuclear. If new build was to happen at
Darlington, there would likely be an increase in the number of employees at the site. Similarly, the decommissioning of
Pickering Nuclear slated for the next decade will mean a decrease in the number of employees at that site. Pickering
Nuclear also has more employees since OPG’s main training facilities are located there. The OPG training facility in
Pickering is extensive, and employs a significant number of employees. Most Darlington employees receive training and
upgrading at the Pickering site under the current circumstances. The Darlington Energy Complex is currently being built
near Darlington Nuclear; this will house the mock-up reactor which will be used for refurbishment training. This complex will
likely house the OPG training facility as the decommissioning of Pickering takes place. It is likely that in the coming years,
Darlington will see an increase in employees while Pickering sees a decrease given the current nuclear life-cycle stages each
plant is in.
In Rick Miner’ 2010 report “People without Jobs, Jobs without People” he noted Ontario’s aging population. More
specifically, that as the baby boomer generation advances into the age of normal retirement, there will be a significant
decline the proportion of Ontario’s population in the prime working years (15 to 64). Moreover, Ontario Ministry of Finance
data shows that the projected shortfall in the availability of workers is set to rise to at least 200,000 and to as high as 1.8
million by 2031, depending on Ontario’s level of population growth (Miner, 2010). Durham Region is no different; Figure 7
depicts the age distribution of the Durham Region population.
NUCLEAR SECTOR • 2013 COMMUNITY REPORT 212013
Figure 7: Age Distribution, Durham Region, 2011
85 years and over
80 to 84 years
70 to 74 years
75 to 79 years
65 to 69 years
60 to 64 years
55 to 59 years
50 to 54 years
45 to 49 years
40 to 44 years
35 to 39 years
30 to 34 years
25 to 29 years
20 to 24 years
15 to 19 years
10 to 14 years
5 to 9 years
0 to 4 years
Male Female
Source: Statistics Canada, Census, 2011; each interval represents 10,000 individuals
The age distribution of the resident population in Durham Region has two significant bulges, the main one at the 45 to 54
years age group and a second at the 10-24 years age category. The first bulge represents the tail end of the baby boom
generation. The second bulge reflects the baby boom echo (the children of the baby boom generation) as well as the larger
number of youth living in growing communities (families moving into the area). The dip in population in between 25 and 39
year olds, in particular among 25 to 34 year olds, reflects the fall off in births following the baby boom (the baby bust).
When the Durham Region population distribution is compared with that of workers at OPG the breakdown is similar. Figure
8 depicts the count of OPG employees by age range as of September 30, 2012.
22 NUCLEAR SECTOR • 2013 COMMUNITY REPORTFigure 8: Count of OPG Employees by Age Range (September 30, 2012)
2013
Count of OPG Employees by Age Range for
all Worksites as of September 30, 2012
E mployees
1600
1400
1000
1200
800
of
600
400
N umber
200
0
0-19 20-24 25-29 30-34 35-39 40-44 45-49 50-54 55-59 Over 60
A ge R ange
Source: Ontario Power Generation
Just over 70% of OPGs employees are over age 40, nearly 60% are over the age of 45 and 40% are over age 50. Moreover,
approximately 10% of OPG employees are under the age of 30. This data indicates that OPG has a large baby boomer
population which will be nearing retirement age, and their lack of young adults in their workforce demonstrates a large
potential gap in their workforce as more employees reach the age of retirement. Further, this data provides additional
validity for Rick Minor’s report and the projected shortfall of workers regardless of industry6. Through acknowledgement
of the impending shortfall of workers there is adequate time to prepare retraining programs which would allow displaced
workers from other industries to undertake upgrading, training and certification to prepare for work in the nuclear industry.
This is especially critical in the Durham Region with regards to the manufacturing industry and the precariously employed
workers who will be looking for career options in the coming years directly coinciding with the presumed retirement of a
substantial proportion of the OPG workforce.
The nuclear industry is a knowledge industry with above-average salaries for its employees and long-term sustainable
employment options. As was noted earlier, many Durham Region residents employed in utilities live and work in the
Region nevertheless, due to the lack of data available from Statistics Canada that information was unable to be further
decomposed to provide more detailed data relating to direct nuclear operations. OPG however, was able to provide
forward sortation areas (FSA) for its employees. This provides information on where OPG employees commute from to get
to work. Table 12 provides the FSA for OPG employees by worksite.
6
For a complete breakdown of OPG employees by age see Appendix II
NUCLEAR SECTOR • 2013 COMMUNITY REPORT 232013
Table 12: Forward Sortation Area of OPG Employees
Count of Employees Forward Sortation Area
Worksite L1A L1C L1H L1N L1S L1V L1W Grand Total
Darlington - 2,395 - - - - - 2,395
Darlington Area 16 - - - - - - 16
Pickering - - - - - 3,225 - 3,225
Pickering Area - - 245 220 150 131 1,162 1,908
Grand Total
16 2,395 245 220 150 3,356 7,544
Source: Ontario Power Generation
This data allows for GIS-mapping to accurately display the areas in which OPG employees live.
Figure 9: GIS Mapping of OPG Employees
Source: Ontario power Generation
As depicted by this geographical representation, many of OPG employees live within the Durham Region which provides
validity to the commuting patterns data provided for the industry as a whole. Durham Region continues to strive to be a
place where its residents are able to live, play and work, and OPG provides one example of an employer in the Region
which provides its workforce with the opportunity to work close to home in a rewarding career with a sustainable future.
24 NUCLEAR SECTOR • 2013 COMMUNITY REPORTN uclear R e f ur b is h ment in O ntario
2013
Nuclear energy is an integral part of Ontario’s Long Term Energy Plan, as such, there is a need to refurbish Ontario’s nuclear
fleet to ensure it continues to be a safe and reliable supplier of baseload electricity. Refurbishing a CANDU reactor extends
the reactor’s operating lifespan by approximately 25-30 years. Given the magnitude of the projects however, there is a
great need to demonstrate the positive economic impact refurbishment will have for both the province and communities
supporting nuclear power plants.
Table 13 depicts the assumed schedule for refurbishment program in Ontario in accordance with the Ontario Long Term
Energy Plan. In total, there are ten units in Ontario scheduled to undergo refurbishment in the next decade.
Table 13: Assumed Schedule for Refurbishment Program (Canadian Manufactuers and Exporters, 2010)
2014 2015 2016 2017 2018 2019 2020 2021 2022 2023 2024
Bruce Unit 3
Bruce Unit 4
Darlington Unit
Darlington Unit
Darlington Unit
Darlington Unit
Bruce B Unit
Bruce B Unit
Bruce B Unit
Bruce B Unit
As mentioned previously, there are great costs associated with refurbishment. Table 14 depicts the cost estimates for
refurbishment on CANDU reactors as collected by the Canadian Manufacturers & Exporters (CME) for their July 2010
report.
NUCLEAR SECTOR • 2013 COMMUNITY REPORT 252013
Table 14: Cost Estimates for CANDU refurbishment (Canadian Manufactuers and Exporters, 2010)
Rector Capacity Cost Estimate
Point Lepreau 680 MW $1.21 billion
Gentilly-2 675 MW $1.9 billion
Bruce A Units 1&2 2 at 750 MW ~ $4 billion
Darlington Units 1-4 4 at 881 MW ~ $6-10 billion
The above costs are subject to some uncertainty and include some first-of-a-kind costs. Point Lepreau, for example, is the
first refurbishment on a CANDU 6 reactor, similarly, the Bruce A refurbishment is the first for a multi-unit station. Base on
this data however, the Canadian Manufacturers & Exporters determined an average capital cost of $2 billion for of the
Bruce and Darlington reactors (Canadian Manufactuers and Exporters, 2010).
When examining a capital cost investment of $2 billion, it is imperative to determine what the costs are attributed to. More
importantly, there is a need for the capital cost to result in increased employment, and the ability to ultimately increase
household income, and GDP. Table 15 depicts a breakdown of the capital cost of refurbishment for a single reactor.
Table 15: Breakdown of Capital Cost of Refurbishment (Canadian Manufactuers and Exporters, 2010)
Project Component Proportion Cost
Engineering 15% $300 million
Project Management 10% $200 million
Equipment and materials 35% $700 million
Construction labour 40% $800 million
Total 100% $2 billion
Based on the assumed capital cost of $2 billion, CME broke down the cost to determine the estimated percentage and
amount estimated for engineering, project management, equipment and materials and construction labour. To determine
these numbers CME used information from various new build nuclear projects, as well as key informant interviews with
those who have extensive experience in nuclear power plant projects. This demonstrates that 65% of the capital costs of
refurbishment are the direct labour costs of engineering, project management and construction labour. CME assumed
that the cost of engineering and management components are 75% salary, and the labour wages make up 80% of the
construction labour component. The remainder of the costs are assumed to comprise overhead, allowances and supplies
(Canadian Manufactuers and Exporters, 2010
26 NUCLEAR SECTOR • 2013 COMMUNITY REPORTYou can also read