Nutritional Quality of Food Prepared at Home and Away From Home, 1977-2008 - Biing-Hwan Lin Joanne Guthrie
←
→
Page content transcription
If your browser does not render page correctly, please read the page content below

United States
Department of
Agriculture

                Nutritional Quality of Food Prepared
Economic
                at Home and Away From Home,
Research
Service
                1977-2008
Economic
Information     Biing-Hwan Lin
Bulletin
Number 105      Joanne Guthrie
December 2012
.usda.gov
     s
wwwer
   .
       Visit Our Website To Learn More!
                           Find additional information at
           http://www.ers.usda.gov/topics/food-choices-
                  health/diet-quality-nutrition.aspx

        Recommended citation format for this publication:
        Lin, Biing-Hwan, and Joanne Guthrie. Nutritional Quality of Food Prepared at
        Home and Away From Home, 1977-2008, EIB-105, U.S. Department of
        Agriculture, Economic Research Service, December 2012.

        Use of commercial and trade names does not imply approval or
        constitute endorsement by USDA.

        Cover photo credit: Shutterstock.

        The U.S. Department of Agriculture (USDA) prohibits discrimination in all its
        programs and activities on the basis of race, color, national origin, age,
        disability, and, where applicable, sex, marital status, familial status, parental
        status, religion, sexual orientation, genetic information, political beliefs, reprisal,
        or because all or a part of an individual’s income is derived from any public
        assistance program. (Not all prohibited bases apply to all programs.) Persons
        with disabilities who require alternative means for communication of program
        information (Braille, large print, audiotape, etc.) should contact USDA’s
        TARGET Center at (202) 720-2600 (voice and TDD).

        To file a complaint of discrimination write to USDA, Director, Office of Civil
        Rights, 1400 Independence Avenue, S.W., Washington, D.C. 20250-9410 or
        call (800) 795-3272 (voice) or (202) 720-6382 (TDD). USDA is an equal
        opportunity provider and employer.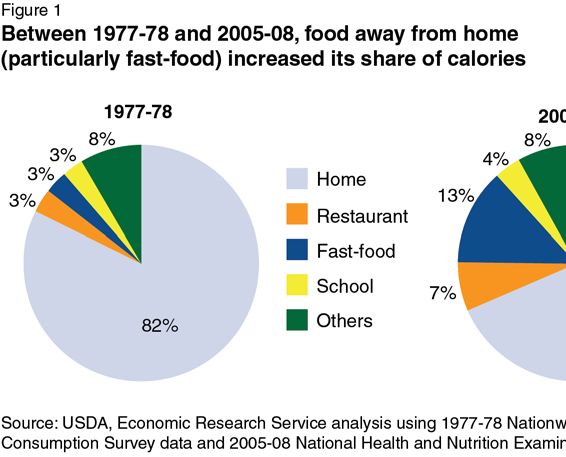
A Report from the Economic Research Service
United States
Department                                                                www.ers.usda.gov
of Agriculture

Economic         Nutritional Quality of Food
Information
Bulletin         Prepared at Home and Away
Number 105

December 2012
                 From Home, 1977-2008

                 Biing-Hwan Lin
                 Joanne Guthrie

                 Abstract
                 Food prepared away from home (FAFH)—whether eaten in restaurants, fast-food and
                 other locations, or as take-out or delivery to be eaten at home—is now a routine part of the
                 diets of most Americans, accounting for 41 percent of food expenditures and 32 percent of
                 caloric intake. This report analyzes data on individuals 2 years of age and older from two
                 national food consumption surveys (one conducted in 1977-78 and another in 2005-08) to
                 assess changes in the consumption and nutritional quality of FAFH versus food prepared
                 at home (FAH). In the past three decades, FAH has changed more in response to dietary
                 guidance, becoming significantly lower in fat content and richer in calcium, whereas
                 FAFH did not. In 2005-08, FAFH was also higher in saturated fat, sodium, and choles-
                 terol and lower in dietary fiber than FAH. The increased popularity and lower nutritional
                 quality of FAFH is prompting new health promotion strategies, such as menu labeling.

                 Keywords: food away from home, food at home, food consumption, diet quality,
                 Nationwide Food Consumption Survey, NFCS, National Health and Nutrition
                 Examination Survey, NHANES

                 Acknowledgments
                 The authors thank Nicole Larson, University of Minnesota, School of Public Health;
                 Margaret A. McDowell, U.S. Department of Health and Human Services, National
                 Institutes of Health; and Samantha Snyder, USDA, Economic Research Service (ERS),
                 for their comments and suggestions. The authors also thank Ephraim Leibtag for coor-
                 dination of the report, Angela Anderson for editorial support, and Cynthia A. Ray for
                 design support, ERS.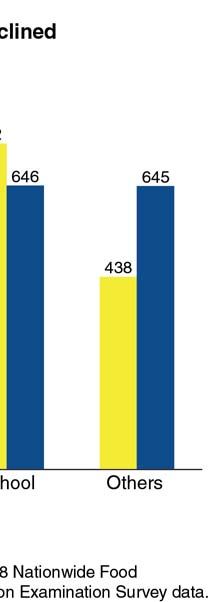
Contents
Summary. . . . . . . . . . . . . . . . . . . . . . . . . . . . . . . . . . . . . . . . . . . . . . . . . . . iii

Introduction . . . . . . . . . . . . . . . . . . . . . . . . . . . . . . . . . . . . . . . . . . . . . . . . . 1

Data and Methods . . . . . . . . . . . . . . . . . . . . . . . . . . . . . . . . . . . . . . . . . . . . 3

    The Data: 1977-78 and 2005-08 . . . . . . . . . . . . . . . . . . . . . . . . . . . . . . . . 3

    Methods. . . . . . . . . . . . . . . . . . . . . . . . . . . . . . . . . . . . . . . . . . . . . . . . . . . 4

Changes in the Nutritional Quality of Food Prepared at Home and
Away From Home: 1977-2008 . . . . . . . . . . . . . . . . . . . . . . . . . . . . . . . . . . 5

    Food Prepared Away From Home Grabs a Larger Share
    of Caloric Intake . . . . . . . . . . . . . . . . . . . . . . . . . . . . . . . . . . . . . . . . . . . . 5

    Intake of Total Fat Fell Substantially . . . . . . . . . . . . . . . . . . . . . . . . . . . . 7

    Calcium Density Fell for School Foods . . . . . . . . . . . . . . . . . . . . . . . . . . 8

Nutritional Quality of Foods, by Food Source: 2005-08. . . . . . . . . . . . . 10

    Away-From-Home Food Sources Are High in Overconsumed
    Food Components . . . . . . . . . . . . . . . . . . . . . . . . . . . . . . . . . . . . . . . . . . 10

    Away-From-Home Foods Are Low in Calcium and
    Dietary Fiber . . . . . . . . . . . . . . . . . . . . . . . . . . . . . . . . . . . . . . . . . . . . . . 12

Discussion . . . . . . . . . . . . . . . . . . . . . . . . . . . . . . . . . . . . . . . . . . . . . . . . . . 13

References. . . . . . . . . . . . . . . . . . . . . . . . . . . . . . . . . . . . . . . . . . . . . . . . . . 16

                                                                                      ii
                                 Nutritional Quality of Food Prepared at Home and Away From Home, 1977-2008 / EIB-105
                                                               Economic Research Service/USDA
Summary
What Is the Issue?
Food prepared away from home (FAFH)—whether from table-service
restaurants, fast-food establishments and other locations, or from a take-out
or delivery meal eaten at home—is now a routine part of the diets of most
Americans. Previous Economic Research Service (ERS) research found that
FAFH tends to be lower in nutritional quality than food prepared at home
(FAH), increases caloric intake, and reduces diet quality among adults and
children. This study updates previous research by examining dietary guid-
ance and the nutritional quality of FAH versus FAFH in 2005-08, compared
with 1977-78. Poor diets contribute to obesity, heart disease, stroke, cancer,
diabetes, osteoarthritis, and other health conditions that impose a substantial
economic burden on individuals and society. The increased popularity of
FAFH is prompting new health promotion strategies, such as menu labeling,
to address this challenge.
What Did the Study Find?
As the share of food expenditures spent on FAFH has risen over the past 30
years, so has the share of calories and nutrients consumed from such food.
Previous ERS research found that FAFH in the 1990s contained less of the
food components Americans underconsume, such as calcium and dietary
fiber, and more of those overconsumed, such as fat, compared with FAH.
Examining the changes in intake from FAFH and FAH, as reported in
national Federal surveys for 1977-78 and 2005-08, we found that:
• Americans increased their away-from-home share of caloric intake from
17.7 percent in 1977-78 to 31.6 percent in 2005-08, mainly from table-
service and fast-food restaurants.
• Mean daily consumption of total fat declined significantly over the period
studied in both absolute terms (grams) and as a share of calories. On
average, Americans consumed 85.6 grams of total fat per day in 1977-78,
compared with 75.2 grams in 2005-08. The percent of calories from total
fat also declined substantially from 39.7 percent to 33.4 percent between
1977 and 2008. Comparing estimates for total fat content between FAFH
and FAH shows that the gap has widened over time. Total fat in 1977-78
accounted for 39.6 and 39.9 percent of calories from FAH and FAFH,
respectively, compared with 30.5 and 37.2 percent in 2005-08.
• Mean daily calcium intake rose from 743 milligrams (mg) in 1977-78
to 919 mg in 2005-08. For every 1,000 calories from FAH, Americans
increased their calcium intake from 425 mg to 559 mg in that time
period, whereas the calcium density in FAFH remained relatively
constant at 452-460 mg per 1,000 calories.
• Foods obtained at schools had the highest calcium content among all
food sources in both periods, but the amount of calcium per 1,000 calo-
ries from school foods declined from 742 mg in 1977-78 to 646 mg
in 2005-08. The amount of calcium per 1,000 calories in fast-foods
increased from 344 mg in 1977-78 to 372 mg in 2005-08.
iii
Nutritional Quality of Food Prepared at Home and Away From Home, 1977-2008 / EIB-105
Economic Research Service/USDAData from 2005-08 also included information on saturated fat, cholesterol,
sodium, and dietary fiber intake that was unavailable in 1977-78, allowing
further analysis of the nutritional differences between FAH and FAFH in the
more recent period. We found that in 2005-08:
• FAFH was higher in saturated fat than FAH. The higher percent of calo-
ries from saturated fat in fast-foods was especially noteworthy at 13.5
percent, compared with 11.9 percent in restaurant foods, 12.3 percent in
school foods, and 10.7 percent in FAH.
• FAFH contained 1,820 mg of sodium per 1,000 calories, considerably
higher than FAH at 1,369 mg of sodium. Foods from restaurants and
fast-food establishments were particularly sodium-dense at 2,151 mg and
1,864 mg of sodium per 1,000 calories, respectively.
• Similarly, FAFH was more cholesterol-dense than FAH at 144 mg and
126 mg of cholesterol per 1,000 calories, respectively. Within FAFH
sources, restaurant foods were most cholesterol-dense at 206 mg per
1,000 calories.
• Even though school foods had the highest calcium content among all
food sources, low calcium content in foods consumed at restaurants and
fast-food places resulted in lower calcium content overall for FAFH at
460 mg per 1,000 calories, compared with 559 mg for FAH.
• FAFH, especially fast-foods, were lower in dietary fiber (an undercon-
sumed food component) than FAH, 6.8 grams versus 7.7 grams per
1,000 calories.
How Was the Study Conducted?
Our analysis used national food consumption survey data from the 1977-78
Nationwide Food Consumption Survey (NFCS), conducted by the U.S.
Department of Agriculture (USDA), as well as data from the 2005-06 and
2007-08 National Health and Nutrition Examination Survey (NHANES),
conducted jointly by USDA and the U.S. Department of Health and Human
Services, to examine how the nutritional quality of FAH and FAFH has
changed. NHANES has been conducted continuously since 1999, however,
2009-10 NHANES data were not released until after this research was
completed. Away-from-home sources include restaurants with wait staff,
fast-food establishments, schools and day care (for children), and other away-
from-home places (other). Analyses focused on the nutrient intake empha-
sized in Federal dietary guidelines for Americans 2 years of age and older.
Changes in the consumption of calories, total fat, and calcium from FAH and
FAFH sources over the past 30 years were examined statistically. In addition,
intake of saturated fat, cholesterol, sodium, and dietary fiber during 2005-08
were analyzed to examine the differences in the nutritional quality of FAH
and FAFH. Our analyses incorporated complex survey design effects and
sample weights to estimate population means and test differences in means
over time and by food source.
iv
Nutritional Quality of Food Prepared at Home and Away From Home, 1977-2008 / EIB-105
Economic Research Service/USDAIntroduction
Poor diets contribute to obesity, heart disease, stroke, cancer, diabetes, osteo-
arthritis, and other health conditions that impose substantial economic burden
on Americans (USDA/USDHHS, 2011; USDHHS, 2010). The medical costs
associated with overweight and obesity have been estimated as high as $147
billion, or 10 percent of all medical costs in 2008 (Finkelstein et al., 2009;
O’Grady and Capretta, 2012; Tsai et al., 2011). These enormous costs are
one reason that USDA and other public and private entities place a high
priority on improving Americans’ diets.
Food prepared away from home (FAFH)—whether eaten in restaurants, fast-
food and other locations, or a take-out or delivery meal eaten at home—is
now an important part of Americans’ diets. The share of total food expen-
ditures spent on FAFH rose steadily from 25.9 percent in 1970 to a peak of
41.9 percent in 2006-07 and then declined to 41.3 percent in 2010 (USDA/
ERS, 2012). Previous ERS research found that, in the 1990s, the nutritional
quality of FAFH was inferior to food prepared at home (FAH) (Guthrie et
al., 2002). More recent ERS studies found that FAFH increased daily caloric
intake and reduced diet quality in both adults and children after controlling
for observed and unobserved personal characteristics that could be associated
with differences (Todd et al., 2010; Mancino et al., 2010), contributing to
poor diet and obesity risk.
Over time, however, differences between FAFH and FAH may change
as consumers buy more pre-prepared items in grocery stores, possibly
decreasing the differences between the two food sources (Smith, 2010);
therefore, re-examination of differences between the two food categories is
merited. In this study, we analyzed food consumption survey data collected
by the U.S. Department of Agriculture (USDA) during 1977-78 and USDA
and the U.S. Department of Health and Human Services (USDHHS) in
2005-08 to examine how the nutritional quality of FAH and FAFH has
changed over the past 30 years. Data on three dietary components that have
received considerable attention as a part of public health efforts—food energy
(calories), total fat, and calcium—are available for both 1977-78 and 2005-
08, allowing trend analysis. Reducing intake of calories and total fat was a
major focus of dietary advice during much of the time period between the
two surveys, as was the need to increase calcium intake. Trends in average
intake, shares of intake by food source, and nutrient density by food source
were compared statistically. Information on intake of four additional nutri-
ents targeted as public health concerns—cholesterol, saturated fat, sodium,
and dietary fiber—are available from the 2005-08 dataset. Differences in the
FAFH and FAH content of these nutrients in 2005-08 are examined statisti-
cally. Comparing dietary quality by food preparation source provides insight
into how the impact of dietary advice may be moderated by environmental
factors, such as increased availability and consumption of FAFH.
1
Nutritional Quality of Food Prepared at Home and Away From Home, 1977-2008 / EIB-105
Economic Research Service/USDAFood preparation sources are categorized into two broad categories: FAH
and FAFH. FAFH is disaggregated further into four sources—restaurant
with waiter service (restaurant), fast-food establishment (fast-food), school
1School (day care center) applies to
cafeteria and school (day care center),1 and other away-from-home places
children only.
(other). We analyzed two sets of nationally representative survey data to
report mean nutrient intake by food source for adults and children 2 years of
age and older. Differences in intake over time and by food source were tested
for statistical significance using SUDAAN software (RTI, 2005) to incorpo-
rate survey design and sample weights in the analysis.
2
Nutritional Quality of Food Prepared at Home and Away From Home, 1977-2008 / EIB-105
Economic Research Service/USDAData and Methods
The Data: 1977-78 and 2005-08
Between 1935 and 1998, USDA conducted food consumption surveys
to assess the nutritional well-being of the U.S. population. Since 2002,
USDA has worked with USDHHS to collect and release “What We Eat in
America,” a component of the National Health and Nutrition Examination
Survey (NHANES), which reports food consumption and nutrient intake data
from a nationally representative sample of Americans (USDHHS, 2005-06
and 2007-08). In this study, we analyzed consumption data from USDA’s
1977-78 Nationwide Food Consumption Survey (NFCS) as well as from the
two most recent cycles of NHANES—2005-06 and 2007-08—available at
the time of our analysis.
The 1977-78 NFCS collected food intake data for 3 consecutive days, and
the 2005-08 NHANES recorded 2 nonconsecutive days of food intake
data. In both surveys, respondents were interviewed in person to collect
intake data for the first day, whereas intake information on subsequent days
was collected using different methodologies (a self-reported food diary in
1977-78 versus a telephone interview in 2005-08). We analyzed only first-
day data to minimize potential bias that may have occurred due to differ-
ences in timing (consecutive versus nonconsecutive days) and data collection
methods (Cavadini et al., 2000). Because the Federal Dietary Guidelines
for Americans (USDHHS/USDA, 2011) do not apply to individuals under 2
years of age, infants and toddlers were excluded from the analysis, resulting
in 18,285 respondents from the 2005-08 NHANES and 29,402 respondents
from the 1977-78 NFCS.
The surveys collected data on the types and amounts of foods individuals
ate and where the food was obtained; using this information, calorie and
nutrient intake data were calculated by USDA. The distinction between food
at home (FAH) and food away from home (FAFH) in the study was based
on where the food was obtained, not where it was eaten. FAH is purchased
at retailers, such as a grocery store, a convenience store, or a supermarket; it
may be eaten at home or away, as in a brown-bag lunch. FAFH is purchased
mainly from foodservice establishments and is further disaggregated into
four sources—restaurant, fast-food, school, and other. It may be eaten at one
of those establishments or eaten at home, as with a delivery or take-out meal.
Food consumption survey methodology has improved over the past three
decades. Some methodological changes may have contributed to the differ-
ences reported here:
• A five-step Automated Multiple-Pass Method (AMPM) improves the
completeness of data collection and has been employed in NHANES but
not in NFCS (Raper et al., 2004). Adopting AMPM may reduce under-
reporting, resulting in an increase in reported food intake, but the extent
of its contribution is unknown.
• Food sources have been expanded, and Hispanic names of eating occa-
sions have been added in NHANES. Because eating occasions are not
defined for the respondents, interpretations of eating-occasion names may
3
Nutritional Quality of Food Prepared at Home and Away From Home, 1977-2008 / EIB-105
Economic Research Service/USDA2In addition to eating-out frequency,
play a role in the observed differences in meal eating patterns.
Consequently, we chose not to report meal eating patterns and nutritional caloric intake from FAFH and its share
of total calories are influenced by por-
quality by meal occasion in this report.2 tion size and the difference in caloric
content of the same food prepared at
Methods home and away from home. Changes
in portion sizes over time have been
Both NFCS and NHANES employed complex survey designs and provided studied by Nielsen and Popkin (2003).
There are more than 7,000 food items
sample weights to generate nationally representative projections. We used reported in NHANES, and there are
SUDAAN statistical software (RTI, 2005) to incorporate survey design additional data challenges in comparing
effects and sample weights to generate estimates of means and standard the nutritional quality of the same food
errors. NFCS and NHANES were treated as independent samples to test the prepared at home and away from home.
differences in means for the two periods or by food sources. Further research on the factors affecting
caloric intake by food source is needed
to explain differences.
There are two approaches to estimating population means and proportions
(Freedman et al., 2008). We used the mean approach, in which, for a given
nutrient value (e.g., FAFH’s share of calories), we calculated the share for
each respondent and then calculated the weighted average using sample
weights. Alternatively, the weighted sum of a variable (e.g., calories from
FAFH) can be calculated and then totaled in a first step, and then the analyst
can take the ratio—the ratio approach. These two approaches often yield
similar results, although they may produce different but equally valid results
(Krebs-Smith et al., 1989).
Observed changes in dietary patterns over time may come from a variety of
sources, including an aging U.S. population, the changing racial and ethnic
makeup of the U.S. population, and other socioeconomic factors that may
influence food consumption decisions. In this study, we compared mean
dietary patterns for the two periods without adjusting for changing age,
racial, and ethnic composition over time. Further research would be needed
to identify the role of such factors.
4
Nutritional Quality of Food Prepared at Home and Away From Home, 1977-2008 / EIB-105
Economic Research Service/USDAChanges in the Nutritional Quality of Food
Prepared at Home and Away From Home: 1977-2008
Seven dietary components were examined in the study, including calories,
total fat, saturated fat, cholesterol, sodium, dietary fiber, and calcium. In
1980, the Federal Government began publishing the Dietary Guidelines
for Americans, a set of recommendations to the U.S. population for healthy
eating that is updated every 5 years. Over most of the period studied, these
guidelines encouraged Americans to control their caloric intake to maintain
or achieve healthy weight, moderate total fat, reduce saturated fat, choles-
terol, and sodium, and increase calcium and fiber intake (Davis and Saltos,
1999; USDA/USDHHS, 2005). Of these targeted nutrients, only calories,
total fat, and calcium were reported in the 1977-78 NFCS. Our discussion
focuses first on the intake trends for calories, total fat, and calcium between
1977 and 2008, followed by a discussion of intake during 2005-08 of all the
food components examined in this study.
Food Prepared Away From Home Grabs
a Larger Share of Caloric Intake
Estimated caloric intake rose significantly from 1,875 calories a day during
1977-78 to 2,002 calories in 2005-08 (table 1). It should be noted, however,
that improved survey methodology could contribute to the increase in
reported caloric intake. Americans increased their shares of caloric intake
from FAFH, from 17.7 percent in 1977-78 to 31.6 percent in 2005-08 (table
2, fig. 1). During 1977-2008, the share of calories from restaurants doubled
(from 3.3 to 6.7 percent) and fast-food places registered a four-fold increase
(from 3.1 to 13.2 percent). School’s share of total caloric intake rose to 3.7
percent in 2005-08 from 3.0 percent in 1977-78.
Table 1
U.S. mean daily caloric and nutrient intakes of individuals 2 years
of age and older, 1977-78 and 2005-08
Nutrient Period Mean SE
1977-78 1,875.12 12.84
Calories (kcal)
2005-08 2,002.46 12.29
1977-78 85.63 0.85
Total fat (grams)
2005-08 75.19 0.66
1977-78 743.45 11.58
Calcium (milligrams)
2005-08 918.61 8.47
Saturated fat (grams) 2005-08 25.45 0.23
Cholesterol (milligrams) 2005-08 259.26 2.37
Sodium (milligrams) 2005-08 3,085.15 21.42
Dietary fiber (grams) 2005-08 13.91 0.14
SE = Standard error of the mean.
kcal = Kilocalories.
Note: The sample size for 1977-78 was 29,402 and for 2005-08 was 18,285.
Source: First-day intake from the USDA 1977-78 Nationwide Food Consumption Survey and
the USDA/USDHHS 2005-08 National Health and Nutrition Examination Survey.
5
Nutritional Quality of Food Prepared at Home and Away From Home, 1977-2008 / EIB-105
Economic Research Service/USDATable 2
Average shares of U.S. caloric and nutrient intakes, by food source, for individuals 2 years of age and
older, 1977-78 and 2005-08
Calories Total fat Calcium Saturated fat Cholesterol Sodium Fiber
Mean Mean Mean Mean Mean Mean Mean
Source % SE % SE % SE % SE % SE % SE % SE
Home
1977-78 82.28 0.40 81.94 0.40 83.14 0.35 na na na na
2005-08 68.45 0.44 65.10 0.49 70.26 0.42 65.68 0.48 63.91 0.54 64.14 0.48 68.61 0.45
Away from home:
1977-78 17.72 0.40 18.06 0.40 16.86 0.35 na na na na
2005-08 31.55 0.44 34.90 0.49 29.74 0.42 34.32 0.48 36.09 0.54 35.86 0.48 31.39 0.45
Restaurant
1977-78 3.27 0.22 3.52 0.23 2.86 0.20 na na na na
2005-08 6.72 0.19 7.47 0.22 5.36 0.16 7.09 0.20 8.76 0.25 8.16 0.25 6.90 0.19
Fast-food
1977-78 3.11 0.11 3.21 0.12 2.74 0.10 na na na na
2005-08 13.17 0.27 15.78 0.32 11.66 0.25 15.50 0.32 16.13 0.35 15.59 0.31 13.20 0.28
School
1977-78 2.95 0.14 3.08 0.14 3.68 0.15 na na na na
2005-08 3.65 0.21 3.78 0.23 4.45 0.25 3.95 0.23 3.89 0.23 3.88 0.24 3.89 0.24
Others
1977-78 8.40 0.26 8.24 0.25 7.59 0.24 na na na na
2005-08 8.00 0.22 7.86 0.23 8.28 0.18 7.78 0.23 7.32 0.25 8.24 0.23 7.39 0.21
na = Not available. SE = Standard error of the mean.
Note: The sample size for 1977-78 was 29,402 and for 2005-08 was 18,285.
Source: First-day intake from the USDA 1977-78 Nationwide Food Consumption Survey and the USDA/USDHHS 2005-08 National Health and
Nutrition Examination Survey.
6
Nutritional Quality of Food Prepared at Home and Away From Home, 1977-2008 / EIB-105
Economic Research Service/USDAIntake of Total Fat Fell Substantially
U.S. daily intake of total fat for individuals 2 years of age and older declined
significantly from 85.6 grams in 1977-78 to 75.2 grams in 2005-08 (see
table 1). FAFH’s share of total fat intake rose proportionally more than the
increase in its share of caloric intake during 1977-2008. The largest change
was seen in fast-food, which accounted for 3.2 percent of the total fat intake
in 1977-78, whereas the share rose to 15.8 percent in 2005-08 (see table 2).
The gap in total fat content between FAH and FAFH was almost nonexistent
in 1977-78 but has since widened. In 1977-78, total fat accounted for 39.6
and 39.9 percent of caloric intake from FAH and FAFH foods, respectively
(table 3). In 2005-08, total fat accounted for 30.5 and 37.2 percent of total
Table 3
Average nutrient density, by food source, for U.S. individuals 2 years of age and older,
1977-78 and 2005-08
Total fat Calcium Saturated fat Cholesterol Sodium Fiber
Source Mean SE Mean SE Mean SE Mean SE Mean SE Mean SE
Percent kcal mg/1,000 kcal Percent kcal mg/1,000 kcal mg/1,000 kcal g/1,000 kcal
Total
1977-78 39.72 0.17 405.80 3.97 na na na na
2005-08 33.39 0.14 488.41 3.38 11.37 0.06 130.30 1.23 1,535.80 5.69 7.24 0.06
Home
1977-78 39.61 0.17 425.38 3.85 na na na na
2005-08 30.45 0.17 558.91 10.38 10.68 0.07 126.21 1.68 1,368.87 6.86 7.71 0.07
Away from home:
1977-78 39.93 0.19 451.71 9.20 na na na na
2005-08 37.23 0.17 459.86 23.29 12.36 0.06 143.97 1.56 1,820.17 12.59 6.78 0.06
Restaurant
1977-78 44.78 0.37 325.06 4.55 na na na na
2005-08 38.34 0.40 332.14 6.69 11.85 0.16 205.89 3.98 2,151.42 24.72 7.47 0.11
Fast-food
1977-78 40.25 0.25 343.60 9.65 na na na na
2005-08 41.05 0.17 372.43 5.76 13.47 0.07 143.11 1.61 1,864.29 16.65 5.94 0.06
School
1977-78 39.90 0.22 741.74 20.76 na na na na
2005-08 33.62 0.35 645.66 16.55 12.28 0.13 111.96 3.42 1,609.49 22.12 7.67 0.20
Others
1977-78 38.13 0.28 438.05 9.44 na na na na
2005-08 31.46 0.32 645.11 65.29 11.33 0.14 127.91 3.64 1,591.37 56.63 7.69 0.13
na = Not available. SE = Standard error of the mean. kcal = Kilocalories. mg = Milligrams. g = Grams.
Note: The sample size for 1977-78 was 29,402 and for 2005-08 was 18,285.
Source: First-day intake from the USDA 1977-78 Nationwide Food Consumption Survey and the USDA/USDHHS 2005-08 National Health and
Nutrition Examination Survey.
7
Nutritional Quality of Food Prepared at Home and Away From Home, 1977-2008 / EIB-105
Economic Research Service/USDAcalories from FAH and FAFH, respectively. Food consumed at restaurants
had the highest total fat content (44.8 percent of calories from total fat) in
1977-78, but their fat content declined over time and was surpassed by fast-
foods in 2005-08. Fast-food places are the only food source from which
foods have become more fat dense over time, rising from 40.3 percent of
calories from fat in 1977-78 to 41.1 percent in 2005-08. In contrast, the fat
content of foods consumed at schools declined over time, from 39.9 percent
of calories from total fat in 1977-78 to 33.6 percent in 2005-08. During the
period studied, school foods may have changed in response to the Healthy
Meals for Healthy Americans Act of 1994 (Public Law 103-448), which
required the National School Lunch and School Breakfast Programs to meet
standards based on the 1990 edition of the Dietary Guidelines for Americans,
including the requirement that no more than 30 percent of the calories in a
meal come from total fat (Ralston et al., 2008).
Calcium Density Fell for School Foods
Mean calcium intake rose significantly from 743 mg a day in 1977-78 to 919
mg in 2005-08 (see table 1). Mirroring the increasing popularity of eating
out, the FAFH share of calcium intake rose significantly from 16.9 percent
in 1977-78 to 29.7 percent in 2005-08 (see table 2). The calcium density of
FAH rose significantly from 425 mg per 1,000 calories in 1977-78 to 559 mg
in 2005-08 (see table 3, fig. 2). The calcium density of FAFH, however, has
remained essentially constant over time; the increase from 452 mg to 460 mg
per 1,000 calories between 1977 and 2008 was not statistically significant.
Examining different sources of FAFH reveals disparate trends. The calcium
density of restaurant foods has remained constant; whereas foods consumed
at fast-food places have become more calcium dense, rising significantly
8
Nutritional Quality of Food Prepared at Home and Away From Home, 1977-2008 / EIB-105
Economic Research Service/USDAfrom 344 mg to 372 mg per 1,000 calories between 1977 and 2008 (see table
3). This increase was offset by a decline in calcium density of foods obtained
at school.
Because milk is a required food component in the USDA National School
Lunch Program, previous research has shown that foods consumed at school
cafeterias have the highest calcium density among all food sources (Lin
et al., 1999). The calcium density of school foods dropped significantly,
however, from 742 mg to 646 mg per 1,000 calories between 1977 and 2008
(see table 3). This is consistent with declining average milk consumption
among children and the proportion of children consuming milk over time
(Lin and Ralston, 2003). These changes may be attributable to the increased
availability of non-USDA foods and beverages for sale in schools (so called
“competitive foods”) over this period (Poppendieck, 2010). Substitution of
these competitive foods and beverages (e.g., sugar-sweetened beverages in
place of milk) may have led to the lower calcium density of foods obtained
at school. Schools are the only food source for which calcium density has
declined, and the drop is noteworthy at 13 percent.
9
Nutritional Quality of Food Prepared at Home and Away From Home, 1977-2008 / EIB-105
Economic Research Service/USDANutritional Quality of Foods, by Food Source:
2005-08
In addition to calorie, fat, and calcium data, the 2005-08 NHANES included
information on intake of saturated fat, cholesterol, sodium, and dietary fiber
that was not available in the 1977-78 NFCS. This allowed us to conduct more
extensive comparisons of food quality by food preparation source in the more
recent period.
Away-From-Home Food Sources Are High in
Overconsumed Food Components
During 2005-08, FAFH foods accounted for 31.6 percent of caloric intake and
34.9 percent of total fat intake (see table 2), indicating that FAFH foods are
higher in fat than FAH. In fact, the shares of total fat intake from restaurant,
fast-food, and school sources were all higher than their shares of caloric intake.
There are 11 pair-wise differences in total fat content by various food sources;
each pair-wise difference was statistically significant at the 1-percent or better
probability level (table 4). Fast-food had the highest total fat content at 41.1
percent, followed by restaurant and school foods at 38.3 and 33.6 percent,
respectively, as compared with 30.5 percent for home foods. Similarly, FAFH
foods were higher in saturated fat content than home foods (12.4 versus 10.7
percent of caloric intake), and fast-food had the highest saturated fat content
(13.5 percent) among all food sources, followed by schools and restaurants
(12.3 and 11.9 percent, respectively). As in the case of total fat, each pair-wise
difference in saturated fat content by food source was statistically significant at
the 1-percent probability level, except for the differences between restaurants
and schools and between restaurants and other FAFH sources, which were
significant at the 5-percent level (table 4).
Americans 2 years of age and older consumed an average of 259 mg of
cholesterol per day during 2005-08 (see table 1), below the 300-mg-per-day
limit recommended by Federal dietary guidance (USDA/USDHHS, 2010).
Each of the 11 pair-wise differences in cholesterol density by food source
was statistically significant at the 1-percent level, except for home foods
and other FAFH foods (table 4). For every 1,000 calories of intake, restau-
rant foods contained 206 mg of cholesterol, fast-foods contained 143 mg,
and other FAFH contained 128 mg. School foods had the lowest cholesterol
density (112 mg per 1,000 calories) followed by home foods (126 mg per
1,000 calories).
Individuals 2 years of age and older consumed an average of 3,085 mg of
sodium per day during 2005-08 (see table 1), compared with the current
Federal dietary recommendation of less than 2,300 mg per day (USDA/
USDHHS, 2011). As with total fat, saturated fat, and cholesterol, FAFH
foods are more sodium dense than FAH. With the exception of the differ-
ence between foods consumed at school and other FAFH sources, each pair-
wise difference by food source was statistically significant at the 1-percent
level. For each 1,000 calories of intake, foods consumed in restaurants and
fast-food places contained 2,151 mg and 1,864 mg of sodium, respectively,
compared with 1,369 mg in home foods (see table 3, fig. 3).
10
Nutritional Quality of Food Prepared at Home and Away From Home, 1977-2008 / EIB-105
Economic Research Service/USDATable 4
Statistical significance of differences in nutrient density, by food source, 2005-08
Home Restaurant Fast-food School
Other Other Other Other
Nutrient All away Restaurant Fast-food School FAFH Fast-food School FAFH School FAFH FAFH
Total fat
T-statistic -28.74 -18.11 -44.47 -8.11 -2.80 -6.19 8.82 13.40 18.96 26.50 4.54
Significant level 0.00 0.00 0.00 0.00 0.01 0.00 0.00 0.00 0.00 0.00 0.00
Calcium
T-statistic 3.88 18.37 15.71 -4.44 -1.30 -4.56 -17.57 -4.77 -15.60 -4.16 0.01
Significant level 0.00 0.00 0.00 0.00 0.19 0.00 0.00 0.00 0.00 0.00 0.99
Saturated fat
T-statistic -17.67 -6.67 -27.64 -10.53 -4.18 -9.32 -2.07 2.43 7.89 13.73 4.91
Significant level 0.00 0.00 0.00 0.00 0.00 0.00 0.04 0.02 0.00 0.00 0.00
Cholesterol
T-statistic -7.75 -18.46 -7.27 3.75 -0.42 14.63 17.91 14.46 8.25 3.82 -3.19
Significant level 0.00 0.00 0.00 0.00 0.67 0.00 0.00 0.00 0.00 0.00 0.00
Sodium
T-statistic -31.47 -30.50 -27.50 -10.39 -3.90 9.63 16.34 9.06 9.20 4.62 0.30
Significant level 0.00 0.00 0.00 0.00 0.00 0.00 0.00 0.00 0.00 0.00 0.77
Dietary fiber
T-statistic 10.27 1.84 19.03 0.17 0.12 11.96 -0.92 -1.32 -8.48 -12.32 -0.07
Significant level 0.00 0.07 0.00 0.87 0.90 0.00 0.35 0.19 0.00 0.00 0.94
FAFH = Food prepared away from home.
Note: The tests are based on the means, standard errors of the mean, and the sample size (18,285).
Source: First-day intake from the USDA/USDHHS 2005-08 National Health and Nutrition Examination Survey.
11
Nutritional Quality of Food Prepared at Home and Away From Home, 1977-2008 / EIB-105
Economic Research Service/USDAAway-From-Home Foods Are Low in Calcium
and Dietary Fiber
For every 1,000 calories consumed during 2005-08, FAH contained 559 mg
of calcium, which was 22 percent higher than the 460 mg per 1,000 calo-
ries in FAFH foods as a whole (see table 3). School foods had the highest
calcium density (646 mg per 1,000 calories), compared with fast-food estab-
lishments and restaurants (372 mg and 332 mg, respectively). FAH was also
higher in dietary fiber density than FAFH (7.7 compared with 6.8 grams per
1,000 calories), mainly because of the low fiber density of fast-food (5.9
grams). There was no significant difference in the fiber density of FAH and
that of food consumed at schools and other FAFH places. The fiber density
of restaurant foods was slightly lower than the fiber density of foods made at
home; the difference was significant at the 10-percent level.
12
Nutritional Quality of Food Prepared at Home and Away From Home, 1977-2008 / EIB-105
Economic Research Service/USDADiscussion
Over the past 30 years, food prepared away from home (FAFH) has become
a regular part of most Americans’ diets, and those who monitor food trends
expect this to continue (Balzer, 2012). FAFH accounted for 41 percent of
food spending in 2008 (USDA/ERS, 2012) and contributed 32 percent of
caloric intake, based on our analysis. Unfortunately, consumption of FAFH
has been found to increase caloric intake and reduce diet quality in both
adults and children (Todd et al., 2010; Mancino et al., 2010).
Poor diets contribute to obesity, heart disease, stroke, cancer, diabetes,
osteoarthritis, and other health conditions that impose substantial economic
burdens on individuals and society (USDA/USDHHS, 2011; USDHHS,
2010). With estimates of the medical costs associated with overweight and
obesity in 2008 ranging as high as $147 billion, or 10 percent of all medical
costs (Finkelstein et al., 2009), it is not surprising that USDA, USDHHS,
and other public and private entities place a high priority on improving
Americans’ diets.
National food consumption survey data collected in 1977-78 and 2005-08
were used to compare the nutritional profiles of FAFH and FAFH over the
past 30 years. In 2005-08, Americans consumed more calories, less fat, and
more calcium compared with 1977-78. In general, FAH was more dense in
two underconsumed dietary components—calcium and dietary fiber—and less
dense in total fat, saturated fat, cholesterol, and sodium compared with FAFH.
Given the current epidemic of obesity among Americans, the higher caloric
intake associated with FAFH has drawn particular policy attention. Anderson
and Matsa (2011) have argued that this level of concern is exaggerated, as
individuals may compensate for higher caloric intake from FAFH meals by
eating fewer calories at a later meal. Levitsky (2005), however, in a review of
several experimental tests of energy compensation, concluded that compen-
sation for overconsumption appears to be imprecise and suggested that this
may explain changes in body mass index (BMI) associated with long-term
exposure to environmental factors that encourage higher caloric intake.
Because NHANES collects intake data for 2 nonconsecutive days, the data
are not suitable for examining the extent of compensation. More research on
the effects of regular, long-term consumption of FAFH on caloric intake, diet
quality, and weight status is needed, but our results suggest that its associa-
tion with higher caloric intake and lower diet quality deserves public health
attention.
Both FAH and FAFH changed in many ways between the two periods.
Over time, FAH has come to include more pre-prepared items, which might
make FAH more nutritionally similar to FAFH (Smith, 2010). Despite this
continuing trend, the nutritional quality of FAH changed much more than
that of FAFH, perhaps in response to dietary recommendations, such as those
to reduce fat and saturate fat intake; it also became more calcium dense.
Given these differences, many experts encourage Americans to eat more
home-prepared meals as a means of improving diets. Time constraints associ-
ated with changes in household structure and women’s workforce involve-
ment, however, may discourage cooking (Mancino and Newman, 2007).
Innovations that simplify and speed food preparation, such as pre-washed,
13
Nutritional Quality of Food Prepared at Home and Away From Home, 1977-2008 / EIB-105
Economic Research Service/USDApeeled, and/or chopped vegetables (Lucier et al., 2006) and quick, healthy,
simple recipes (USDA/NAL, 2012), have become popular and may help
address such barriers.
To improve FAFH nutritional quality, not only must healthy food options
be available but consumers must respond by making those choices. There
are several reasons why consumers might behave differently when choosing
and consuming food prepared away from home compared with home-
prepared food (Lin et al., 1999). They might have different attitudes about
FAFH, considering it a special treat, compared with FAH. Even if they are
concerned about FAFH’s nutrient content, they might lack the information to
make good choices or have fewer healthy options available.
School food is a special case in that schools are more regulated environ-
ments. Changes in USDA school meal regulations that occurred in the 1990s
appear to have had an effect on the quality of school food, reducing its total
fat content. Fat content declined most in elementary schools, where school
food services faced less competition from non-USDA “competitive” foods
(Newman et al., 2009). More recent legislation, the Healthy Hunger-Free
Kids Act of 2010, requires further improvement in USDA school meals
and limits the availability of less-healthful competitive foods and beverages
(USDA/FNS, 2010). This has the potential to further improve the nutritional
profile of foods obtained at school.
Outside of the school environment, other solutions may be considered. One
policy change now underway hinges on improving nutrition information.
Since the 1990s, most packaged food sold in retail outlets has been required
to carry nutrition labeling. This may have encouraged consumers to make
healthier purchases. In contrast, consumers may have less knowledge of the
nutritional content of food prepared in restaurants and other outlets. In 2010,
the Patient Protection and Affordable Care Act mandated that calorie infor-
mation be made available on menu boards in chain restaurants with more
than 20 outlets nationally to provide consumers with nutritional information
that may help them make better choices.
Will menu labeling improve food choices? A limited amount of research has
been conducted based on implementation of local menu labeling laws. The
findings from these studies were not completely consistent, but generally
suggested that menu labeling had a relatively limited impact on consumer
behavior (Larson and Story, 2009; Lowenstein, 2011). Information may not
be the only factor driving differences in consumer choices when purchasing
FAFH. As mentioned previously, consumers may have different attitudes
about FAFH; they may still consider it an occasional treat for which less
nutritional concern is warranted. This attitude may have fit with the eating
patterns of 1977-78 but does not match eating patterns today. Nutrition
education efforts and point-of-purchase messages raising awareness of
the importance of FAFH as a part of the everyday diet may be helpful and
increase consumer response to menu labeling information. Menu labeling
may also prompt restaurants to offer more healthy options and to reformulate
current offerings. A California study found that restaurants were particu-
larly likely to reformulate items high in calories, fat, or sodium in response
to the establishment of a State menu labeling law (Robert Wood Johnson
14
Nutritional Quality of Food Prepared at Home and Away From Home, 1977-2008 / EIB-105
Economic Research Service/USDAFoundation, 2011). Such supply-oriented effects may increase the effective-
ness of menu labeling.
Another potential explanation for differences in FAH and FAFH can be
proposed based on behavioral economic theory. Behavioral economics posits
that visceral factors, such as hunger and sensory stimuli, may overwhelm
self-control, resulting in more impulsive decisions that deliver short-term
rewards (Mancino and Kinsey, 2008). For example, when hungry, the sight
and smell of a high-calorie treat may be particularly irresistible. FAFH deci-
sions are more likely to be made just prior to eating, and thus fall prey to
this problem. Current behavioral economic research explores strategies for
avoiding these problems, such as pre-commitment. For example, ordering a
healthy meal online and picking it up on the way home may help consumers
avoid the temptation to choose a less healthy option when standing in line at
a take-out restaurant. Behavioral economics also has demonstrated the power
of defaults in guiding choice. In response, public health advocates have urged
restaurants and fast-food places to make the healthier options for beverages
and side dishes the default choice in children’s meals, with positive results
among operators who have made the switch (CSPI, 2011). Several other
strategies based on behavioral economics may encourage healthful choices
(Wansink, 2006) and merit further study.
Implementing menu labeling regulations will provide an opportunity to
test the value of nutrition information in helping consumers make better
choices when eating out. Consumer education, increased numbers of healthy
FAFH offerings, and behavioral economic strategies may also help, rein-
forcing information approaches. Given the importance of FAFH in overall
diet quality, the success of such efforts will have important implications for
improving Americans’ diets and health.
15
Nutritional Quality of Food Prepared at Home and Away From Home, 1977-2008 / EIB-105
Economic Research Service/USDAReferences
Anderson, M., and D. Matsa. “Are Restaurants Really Supersizing
America?” American Economic Journal: Applied Economics 3(1): pp.
152–88, 2011.
Balzer, H. “Is Cooking a Lost Art?”EatingWell.com, 2012,
http://www.eatingwell.com/food_news_origins/food_news/
is_cooking_a_lost_art_a_conversation_with_harry_balzer_c.
Cavadini C., A. Siega-Riz, and B. Popkin. “U.S. Adolescent Food Intake
Trends from 1965 to 1996,” Archives of Disease in Childhood 87(1): pp.
18-24, 2000.
Center for Science in the Public Interest (CSPI). Literature Review: Defaults
and Choice, 2011, http://cspinet.org/new/pdf/defaultlitreview.pdf.
Davis, C., and E. Saltos. “Dietary Recommendations and How They
Have Changed Over Time,” America’s Eating Habit: Changes &
Consequences, AIB-750, chapter 2, E. Frazão (Ed.), U.S. Department of
Agriculture, Economic Research Service, 1999, http://www.ers.usda.gov/
publications/aib750/.
Finkelstein, E., J. Trogdon, J. Cohen, and W. Dietz. “Annual Medical
Spending Attributable To Obesity: Payer-And Service-Specific
Estimates,” Health Affairs 28(5): w822-w831, 2009.
Freedman L., P. Guenther, S. Krebs-Smith, and P. Kott. “A Population’s
Mean Healthy Eating Index-2005 Scores Are Best Estimated by the Score
of the Population Ratio when One 24-Hour Recall is Available,” The
Journal of Nutrition 138(9): pp. 1725-29, 2008.
Guthrie, J., B. Lin, and E. Frazão. “Role of Food Prepared Away From
Home in the American Diet, 1977-78 versus 1994-96: Changes and
Consequences,” Journal of Nutrition Education and Behavior 34(3): pp.
140-50, 2002.
Krebs-Smith S.M., P.S. Kott, and P.M. Guenther. “Mean Proportion and
Population Proportion: Two Answers to the Same Question?” Journal of
the American Dietetic Association 89(5): pp. 671–76, 1989.
Larson, N., and M. Story. Menu Labeling: Does Providing Nutrition
Information at the Point of Purchase Affect Consumer Behavior? Robert
Wood Johnson Foundation, Healthy Eating Research, 2009.
Levitsky, D. “The Non-Regulation of Food Intake in Humans: Hope for
Reversing the Epidemic of Obesity,” Physiology & Behavior 86(5): pp.
623-32, 2005.
Lin, B., J. Guthrie, and E. Frazão. Away-From-Home Foods Increasingly
Important to Quality of American Diet, AIB-749, U.S. Department of
Agriculture, Economic Research Service, 1999, http://www.ers.usda.gov/
publications/aib749/.
16
Nutritional Quality of Food Prepared at Home and Away From Home, 1977-2008 / EIB-105
Economic Research Service/USDALin B., and K. Ralston. Competitive Foods: Soft Drinks vs. Milk, FANRR-
34-7, U.S. Department of Agriculture, Economic Research Service, 2003,
http://www.ers.usda.gov/publications/fanrr34/fanrr34-7/.
Lowenstein, G. “Confronting Reality: Pitfalls of Calorie Posting,” American
Journal of Clinical Nutrition 93(4): pp. 679–80, 2011.
Lucier, G., S. Pollack, M. Ali, and A. Perez. Fruit and Vegetable
Backgrounder, VGS-313-01, U.S. Department of Agriculture, Economic
Research Service, 2006, http://www.ers.usda.gov/publications/vgs/apr06/
vgs31301/.
Mancino, L., and J. Kinsey. Is Dietary Knowledge Enough? Hunger, Stress,
and Other Roadblocks to Healthy Eating, ERR-62, U.S. Department of
Agriculture, Economic Research Service, 2008, http://www.ers.usda.gov/
publications/err62/.
Mancino, L., and C. Newman. Who Has Time To Cook? How Family
Resources Influence Food Preparation, ERR-40, U.S. Department of
Agriculture, Economic Research Service, 2007.
Mancino, L., J. Todd, J. Guthrie, and B. Lin. How Food Away From
Home Affects Children’s Diet Quality, ERR-104, U.S. Department of
Agriculture, Economic Research Service, 2010, http://www.ers.usda.gov/
publications/err40/.
Newman, C., J. Guthrie, L. Mancino, K. Ralston, and M. Musiker. Meeting
Total Fat Requirements for School Lunches: Influence of School Policies
and Characteristics, ERR-87, U.S. Department of Agriculture, Economic
Research Service, 2009, http://www.ers.usda.gov/publications/err87/.
Nielsen, S., and B. Popkin. “Patterns and Trends in Food Portion Sizes,
1977-1998,” The Journal of American Medical Association 289(4): pp.
450-53, 2003.
O’Grady, M., and J. Capretta. Assessing the Economics of Obesity and
Obesity Interventions, Robert Wood Johnson Foundation, 2012, http://
www.rwjf.org/files/research/74094.5743.assessingobesityinterven-
tions.0312.pdf.
Poppendieck, J. Free for All: Fixing School Lunch in America, University of
California Press, 2010.
Ralston, K., C. Newman, A. Clauson, J. Guthrie, and J. Buzby. The National
School Lunch Program Background, Trends, and Issues, ERR-61, U.S.
Department of Agriculture, Economic Research Service, 2008, http://
www.ers.usda.gov/publications/err61/.
Raper, N., B. Perloff, L. Ingwersen, L. Steinfeldt, and J. Anand. “An
Overview of USDA’s Dietary Intake Data System,” Journal of Food
Composition and Analysis 17(3-4): pp. 545-55, 2004.
Research Triangle Institute (RTI) International. SUDAAN statistical soft-
ware, 2005, http://www.rti.org/sudaan/.
17
Nutritional Quality of Food Prepared at Home and Away From Home, 1977-2008 / EIB-105
Economic Research Service/USDARobert Wood Johnson Foundation. Menu Labeling: What Are Restaurants
Doing? 2011, http://blog.rwjf.org/publichealth/2011/11/03/
menu-labeling-what-are-restaurants-doing/.
Smith, D. “The Ultimate Food Fight,” QSR Magazine, 2010, http://www.
qsrmagazine.com/competition/ultimate-food-fight.
Todd, J., L. Mancino, and B. Lin. The Impact of Food Away From Home on
Adult Diet Quality, ERR-90, U.S. Department of Agriculture, Economic
Research Service, 2010, http://www.ers.usda.gov/publications/err90/.
Tsai, A., D. Williamson, and H. Glick. “Direct Medical Cost of Overweight
and Obesity in the USA: A Quantative Systematic Review,” Obesity
Review 12(1):pp. 50-61, 2011.
U.S. Department of Agriculture, Agricultural Research Service (USDA/
ARS). Nationwide Food Consumption Survey, 1977-78, http://www.ars.
usda.gov/main/site_main.htm?modecode=12-35-50-00.
U.S. Department of Agriculture, Economic Research Service (USDA/ERS).
Food CPI and Expenditure: Food Expenditure Tables, Table 10—Food
away from home as a share of food expenditure, 2012, http://www.ers.
usda.gov/data-products/food-expenditures.aspx.
U.S. Department of Agriculture, Food and Nutrition Service (USDA/FNS).
Healthy Hunger-Free Kids Act of 2010, 2010, http://www.fns.usda.gov/
cnd/Governance/Legislation/CNR_2010.htm.
U.S. Department of Agriculture, National Agricultural Library (USDA/
NAL). SNAP-Ed Connection Recipe Finder, 2012, http://recipefinder.nal.
usda.gov/.
U.S. Department of Agriculture and U.S. Department of Health and Human
Services (USDA/USDHHS). Dietary Guidelines for Americans, 2005, 6th
Edition, 2005, http://www.cnpp.usda.gov/DGAs2005Guidelines.htm.
U.S. Department of Agriculture and U.S. Department of Health and Human
Services (USDA/USDHHS). Dietary Guidelines for Americans, 2010, 7th
Edition, 2011, http://www.dietaryguidelines.gov.
U.S. Department of Health and Human Services (USDHHS). “Nutrition
and Weight Status,” Healthy People 2020: Topics and Objectives, 2010,
http://www.healthypeople.gov/2020/topicsobjectives2020/overview.
aspx?topicid=29.
U.S. Department of Health and Human Services, Centers for Disease Control
and Prevention, National Centers for Health Statistics. National Health
and Nutrition Examination Survey (NHANES), 2005-06 and 2007-08,
http://www.cdc.gov/nchs/nhanes.htm.
Wansink, B. Mindless Eating: Why We Eat More Than We Think, Bantam-
Dell: NY, 2006.
18
Nutritional Quality of Food Prepared at Home and Away From Home, 1977-2008 / EIB-105
Economic Research Service/USDAYou can also read