Objectifying processes: The use of geometric morphometrics and multivariate analyses on Acheulean tools
←
→
Page content transcription
If your browser does not render page correctly, please read the page content below
Objectifying processes: The use of geometric
   morphometrics and multivariate analyses on Acheulean
                          tools
         Paula García-Medrano 1, Elías Maldonado-Garrido 1, Nick Ashton 1,
                                  Andreu Ollé 2,3
1. Dept. Britain, Europe and Prehistory, British Museum, Frank House, 56 Orsman Road N1 5QJ, London, U.K.
 Email: Garcia-Medrano: pgarciamedrano@gmail.com; Maldonado-Garrido: emaldonadogarrido@gmail.com;
                                       Ashton: nashton@britishmuseum.org
2. Institut Català de Paleoecologia Humana i Evolució Social (IPHES), Zona educacional 4, Campus, Sescelades
                       URV (Edifici W3), 43007 Tarragona, Spain. Email: aolle@iphes.cat
  3. Àrea de Prehistòria, Universitat Rovira i Virgili (URV), Fac. Lletres, Av. Catalunya, 35, 43002 Tarragona,
                                                        Spain.

Abstract:
      Nowadays, the fruitful discussion regarding the morphological variability of handaxes
during the Middle Pleistocene has reached a decisive moment with the use of more accurate
statistical methods, such as geometric morphometrics (GM) and multivariate analyses (MA).
This paper presents a preliminary methodological approach for checking the utility of these
new approaches on the analysis of the tools‟ shape. It goes beyond the simple description of
morphology and isolates the variables which define the final morphology of a tool. We
compared two Middle Pleistocene sites, Boxgrove and Swanscombe, which are
morphologically very different. Then, we applied the GM analysis on 1) 2D images, with two
semi-landmark distributions: 28 semi-landmarks, specially concentrated on the tip and butt,
and 60 equally spaced points; and 2) on 3D models using a new software (AGMT3-D
Software) including 5000 semi-landmarks. The more points used to define the tool‟s outline,
the more accurate will be the interpretation of the variables affecting shape. On the other
hand, if the semi-landmarks are localized on specific sectors of the tool, a bias is created, by
concentrating on those sectors, rather than the general tool shape. The 3D models offer a new
dimension on the shape analysis, as their results mean the combination of plan-shape, profile-
shape and the tool‟s topography.

Keywords: Middle Pleistocene; Acheulean; handaxes; geometric morphometrics; multivariate
    analyses; Boxgrove; Swanscombe

Journal of Lithic Studies (2020) vol. 7, nr. 1, p. xx-xx                  DOI: https://doi.org/10.2218/jls.4327

Published by the School of History, Classics and Archaeology, University of Edinburgh
ISSN: 2055-0472. URL: http://journals.ed.ac.uk/lithicstudies/

Except where otherwise noted, this work is licensed under a CC BY 4.0 licence.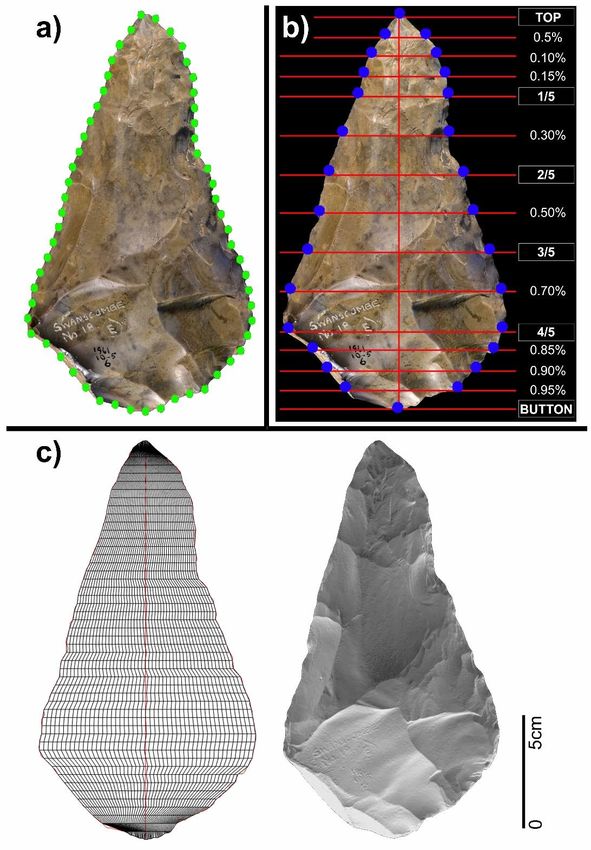
2                                                                                 García-Medrano et al.

1. Introduction
     Since the early stages of prehistoric research, there have been persistent attempts to
develop a common set of technological features and measures in which the morphology of
different lithic assemblages could be classified and compared. These classical methods for the
study of stone artefacts have led us to distinguish between different technological modes, or
cultural technological groups (Clark 1996). The differences are mainly based on the
combination of presence or absence of some technological markers (cores and flake systems,
Large Cutting Tools or the Levallois technique) with the chronological boundaries of each
site. For a long time, the aim of the study of these technological groups was the
characterization of the operative chains and the determination of the final tools‟ typology
(Boëda et al. 1990; Bordes 1961; Carbonell et al. 1992; Newcomer 1971; Wenban-Smith
1989). Nowadays, there is a focus on the morphological variability of tools and their possible
origin. Traditionally, this analysis has been made using metrical approaches, quantifying the
morphology by a set of discrete metric measures, and characterizing an assemblage by the
distribution of these measures (Bordes 1961; Roe 1968). Nevertheless, the morphology of
tools is a much more complex issue than the superficial description of measures and indices,
and it should refer to the entire shape, or to global properties of the artefact, more than to local
measures (Grosman et al. 2008).
     GM analysis is a powerful tool for the quantitative description of shape variability within
and between groups. Nevertheless, it has had two significant handicaps: the limited
computing power and 3D scanning possibilities (Lycett et al. 2006; Lycett 2009; Rovner
1995); and the problems and difficulties entailed in the application of landmark or semi-
landmark-based methods to material cultural objects (Archer & Braun 2010; Bretzke &
Conard 2012; Costa 2010; Eren & Lycett 2012; Herzlinger & Grosman 2018; Lycett &
Chauhan 2010; Lycett & von Cramon-Taubadel 2013; McNabb 2007). The main problem,
among others, has been the lack of readily identifiable, homologous landmarks on artefacts,
(Lycett & Chauhan 2010). The lack of protocols requires a comparison of methods to test
which is the most appropriate to analyse the morphology of tools. Here, we have compared
the results between the use of 2D images or 3D models. In addition, it is also necessary to
define how many semi-landmarks are required to define accurately the tool‟s outline.
     In the context of the Western European Acheulean Project (WEAP, Marie Skłodowska
Curie IF-EF-ST Fellowship, Project ID: 748316), we have defined a common method of
analysis for the study of handaxes and cleavers from several sites in the UK, France and
Spain, based on a selection of technological attributes from the main traditions of lithic
analysis (typological, technological, morphometrical and sequential) that are considered to be
particularly significant (Garcia-Medrano in prep.). Besides, combined with this technological
characterization, WEAP has used GM on 2D images and 3D models to analyse both plan and
profile shapes of handaxes and cleavers.
     The aim of this work is to make a preliminary methodological approach comparing the
use of 28 (concentrated on tip and butt) and 60 (equally distributed) semi-landmarks, both on
2D images; and 5000 points, on 3D models. The results have been interpreted using MA. This
is increasingly used to discern patterns of variability in lithic assemblages and help with their
interpretation. One of the most frequently used is Principal Component Analysis (PCA). IN
this case, we have applied this analysis on two of the main Middle Pleistocene sites in Britain:
Swanscombe and Boxgrove.

2. Archaeological context
    WEAP includes the analysis of handaxes and cleavers from several sites in the UK,
France and Spain (La Noira, Brandon Fields, Cagny La Garenne, Elveden, Swanscombe,

Journal of Lithic Studies (2020) vol. 7, nr. 1, p. xx-xx           DOI: https://doi.org/10.2218/jls.4327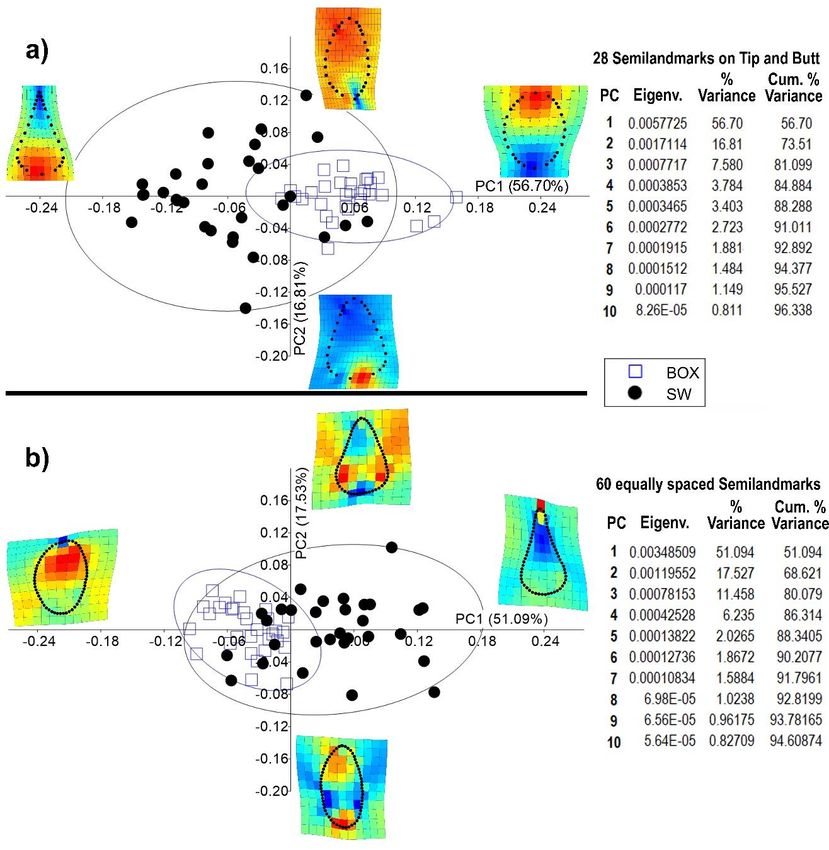
Garcia-Medrano et al.                                                                             3

Saint Pierre-lès-Elbeuf, Menez-Dregan and Galería and TD10.1 sublevel of Gran Dolina,
Atapuerca). For this paper, we have chosen two of the key British Middle Pleistocene sites:
Boxgrove and Swanscombe (Figure 1). The clear association between fauna and very rich
lithic assemblages, together with hominin remains attributed to Homo heidelbergensis and
early Neanderthals makes them two of the key sites for interpreting the Acheulean and
occupation of Britain (Conway et al. 1996; Hillson et al. 2010; Overy 1964; Roberts & Parfitt
1999a; Schreve 2004; Stringer et al. 1998). In the last few years, the differences between
them from both an occupational and technological point of view have been highlighted
(McNabb et al. 2018; Moncel et al. 2015; Smith 2013). In this case, we have focused on the
morphological differences between the handaxes and the methods of analysis.

Figure 1. Location of the Boxgrove and Swanscombe sites

      Boxgrove (West Sussex) is situated 7 km east of Chichester, at the junction between the
South Downs and the present Sussex Coastal Plain. This region has been shaped by a series of
marine transgressions and regressions (Roberts & Parfitt 1999a; 1999b). The Boxgrove
stratigraphic sequence was deposited on a chalk wave-cut platform that during the Middle
Pleistocene was below a 75-100m cliff (Lewis & Roberts 1999; Roberts et al. 1997). Mapping
of these deposits, in relation to the solid chalk geology, indicates deposition within a semi-
enclosed marine bay formed by the extant Portsdown and Littlehampton Anticlines (Barnes
1980). The Middle Pleistocene sediments show marine regression towards the end of an
interglacial (MIS 13; Slindon Formation) and the onset of fully terrestrial conditions prior to
and into the ensuing glacial (MIS 12; Eartham Formation). Using key biostratigraphic marker
species the marine, intertidal and lower terrestrial units have been dated to the late
„Cromerian‟ MIS 13, 524-478ka (Roberts & Pope 2018).
      The importance of the site rests on the preservation of some of the clearest evidence for
hominin presence and behaviour in Britain during the Middle Pleistocene (Parfitt et al. 2005;
2010; Pope 2002; Pope & Roberts 2005; Roberts & Parfitt 1999a). The Boxgrove lithic

Journal of Lithic Studies (2020) vol. 7, nr. 1, p. xx-xx       DOI: https://doi.org/10.2218/jls.4327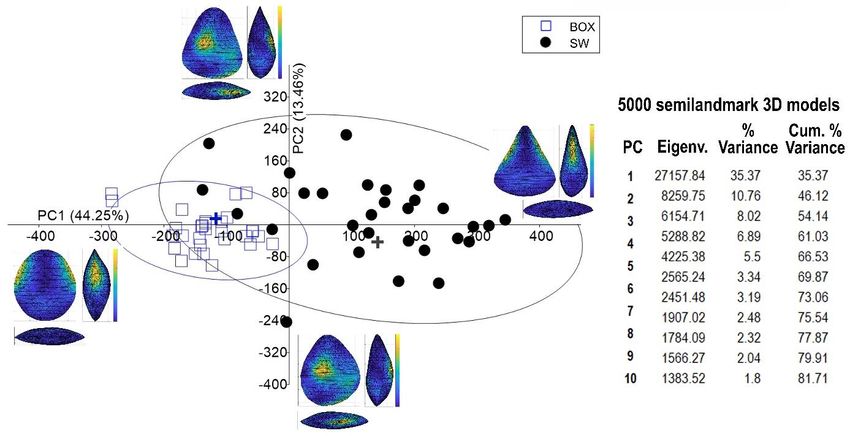
4                                                                              García-Medrano et al.

collection is exceptional in terms of its preservation, due to the nature of its burial and its
subsequent taphonomic history, and because of the great quantity of large tools recovered,
mainly handaxes (García-Medrano et al. 2019). Fauna from Boxgrove is diverse (Parfitt
1999a; 1999b) indicating a mosaic environment of open grassland alongside areas of
deciduous and mixed woodland. A tibia and two incisors, assigned to Homo cf.
heidelbergensis, physically illustrate the presence of hominins within the site‟s mammalian
palaeo-community (Stringer et al. 1998; Stringer & Trinkaus 1999; Trinkaus et al. 1999).

      Barnfield Pit, Swanscombe (Kent), a former chalk quarry, is situated on the southern
flank of the Lower Thames basin, 5 km east of Dartford. Deposits of gravels, sands and loams
have been recorded from the site along with flint tools and Pleistocene fauna (Conway et al.
1996; Gibbard 1985). Mammalian biostratigraphy and lithostratigraphy attribute the site to the
Hoxnian interglacial (MIS 11; c. 423-380 kyr BP) (Bridgland 1994; Schreve 1996; 2004). The
MIS 12 glaciation diverted the course of the River Thames southwards to its present course
(Bridgland 1994; Preece 1995). At Swanscombe the new course is represented by terrace
deposits of sands, gravels and floodplain loams, which accumulated during MIS 11, including
the Upper Middle Gravels (UMG), which are the focus of this paper (Conway et al. 1996).
      The fauna from the UMG highlights a mosaic environment with open-grasslands and
deciduous woodland along and around the channel margins (Schreve 1996; 2004). Three
refitting skull fragments show the presence of early Neanderthals at Swanscombe (Overy
1964; Stringer, 2012; Stringer & Gamble 1993). Alongside fossil evidence, lithic artefacts
including handaxes and flake tools have also been recovered (Ashton & McNabb 1996;
Ashton et al. 1998; McNabb 2007). The association of lithics and fauna at Swanscombe has
been variously interpreted as either evidence of a hominin hunting camp alongside a river
channel (Waechter 1968; 1969; 1976) or scavenging of carnivore kills and natural deaths by
hominins (Binford 1985). Neither interpretation has adequately assessed the taphonomy of the
faunal assemblage and the role that non-human agents played in site formation and
modification. Swanscombe, therefore, provides an ideal case to analyse the hominin
behaviour at this location but also to produce a detailed understanding of faunal taphonomy
and overall site formation processes (Smith 2013).

3. Methodology
     While there are several morphometric approaches, landmarks-based GM is a powerful
tool for the quantitative description of shape variability within and between groups (Lycett &
Chauhan 2010). It is a variant of the methods used for the quantitative study of shape and
shape differences between physical objects (Herzlinger & Grosman 2018). This approach has
been used by archaeologists and is drawn from various fields in biology. It is based on a finite
number of points - landmarks - that are placed on the surface of the studied items and
expressed by two or three Cartesian coordinates. These landmarks should have respective
points across all specimens in the sample (homology).
     While in biology homology can be based on phylogenetic, developmental or functional
considerations, objects of material culture lack such readily identifiable homologous
landmarks (Lycett & Chauhan 2010; Okumura & Araujo 2018). For that, the study of
archaeological artefacts uses semi-landmarks, which are localised according a consistent
geometric positioning of the tools (Bookstein 1997; Dryden & Mardia 1998). Nevertheless,
there is a lack of a single protocol to define the outlines and how many points are necessary to
analyse accurately the morphology of handaxes and cleavers. Some researchers use different
quantities of semi-landmarks (equally spaced or concentrated in specific tool‟s sectors) or

Journal of Lithic Studies (2020) vol. 7, nr. 1, p. xx-xx        DOI: https://doi.org/10.2218/jls.4327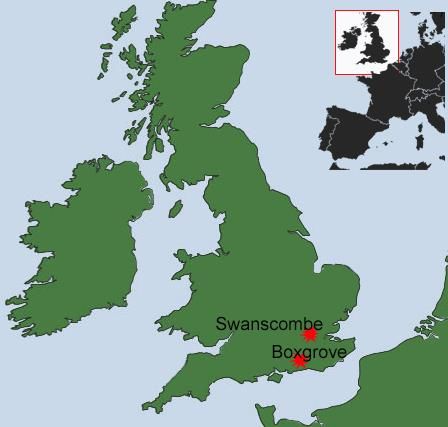
Garcia-Medrano et al. 5
landmarks at specific points (Costa 2010; Lycett & von Cramon-Taubadel 2013; McNabb et
al. 2018).
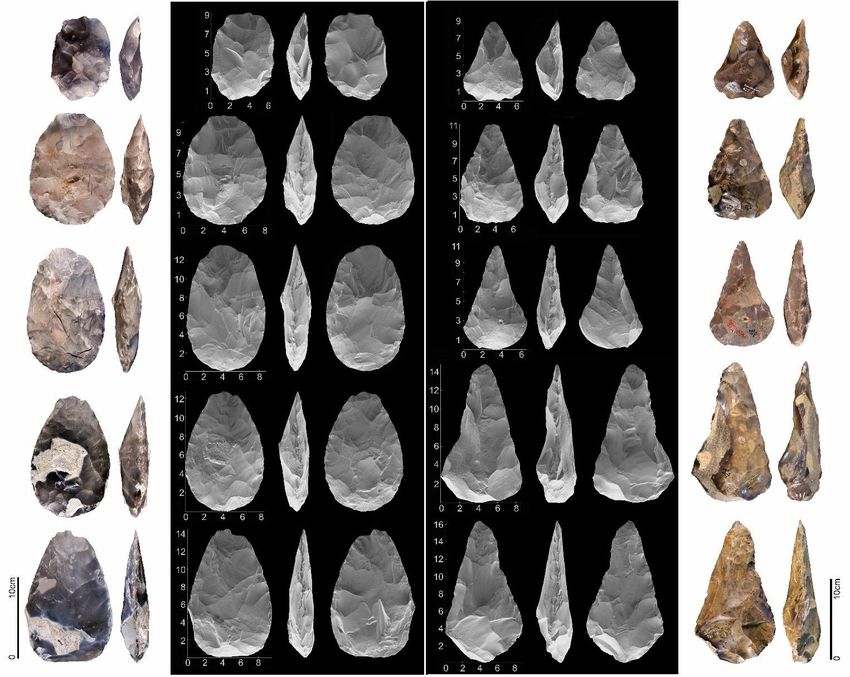
We have chosen thirty handaxes per site, with different sizes and shapes (Figure 2). All
the materials have been photographed using a Nikon D3200, and keeping a 90° angle between
the camera and the instrument. The tools have been oriented firstly, according to their
maximum length; and secondly with the upper face as the dorsal face (in the case of flakes) or
the face with major convexity. All the photographs have been saved in .NEF and .jpg formats,
with an image size of 6016x4000 pixels. The 3D scans have been made using a Structured
Laser Scan (HDI Advance Scan) and the Flexscan software. The 3D models have been saved
as .ply format and extracted using the Artifact 3D Software (Grosman et al. 2008).
So, in this paper, we have explored two different approaches for analysing morphology
with 2D images: 1) 60 equally spaced points along the whole outline of the tool (Figure 3a)
and 2) 28 points with special concentrations on tip and butt (Figure 3b). The 60 equally
spaced points have been generated automatically with the tpsDig2 software (Rohlf 2009).
On the other hand, the extraction of the 28 points has been created with a standard web of
points and then superimposed onto the images, according to the length of each tool. This has
been made using Autocad Software. The points have then been extracted using also tpsDig2.
Once the extraction of coordinate data has been made, the pieces have been oriented
according to their maximum length, beginning from the tip. In both cases, the starting point
has been manually digitized. The XY coordinates of the different points per specimen have
been saved in .NTS file, and then exported to PAST software (Paleontological Statistics)
(Hammer et al. 2001). A 2D Procrustes superimposition of the XYoutline coordinate data has
been performed, which scaled, rotated, and translated the XY data, bringing all handaxe
outlines to a standardized size, orientation, and position before subsequent analysis (Figure 4).
In this way, the differences in landmarks‟ can be attributed exclusively to shape differences
between different objects.
In contrast, for performing the landmarks-based GM shape analysis on 3D models we
have used the open access Artifact GeoMorph Toolbox 3D (AGMT3-D). This is a software
designed specifically to use on archaeological artefacts. It has been written using the Matlab
programming language. AGMT3-D consists of a data-acquisition procedure for automatically
positioning 3D models in space and fitting them with grids of 3D semi-landmarks. In fact,
each point of the grid consists of two semi-landmarks, one placed on each artefact face, so
that a grid of 50×50 provides 5000 landmarks (Figure 3c). The top and bottom latitudes
capture the exact 3D outline of the artefact‟s distal and proximal ends. Thus, this protocol
provides a list of landmarks that accurately expresses the artefact‟s volumetric configuration.
It also provides a number of analytical tools and procedures that allow the processing and
statistical analysis of the data (Herzlinger & Grosman 2018).
The multivariate outline data obtained has been projected into two dimensions so that the
underlying shape variables could be qualitatively examined and compared. In order to
interpret the meaning of the PCA results from a morphological perspective, Procrustes
superimposed shape data have been examined utilizing thin-plate splines to facilitate
visualization of shape changes from the group mean along relative warp (i.e., principal
component) axes (Hammer & Harper 2006). By examining the morphological deformations
and XY plots of specimens from the PCA scatters, it has been possible to interpret the shape
variation by itself. The PCA graph includes the warps‟ tool (representing the tools‟
morphology) on the maximum value of each axis. Colour coding remark the landmarks that
vary the most on the shape trend described on positive and negatives scores of PC1 and PC2.
Journal of Lithic Studies (2020) vol. 7, nr. 1, p. xx-xx DOI: https://doi.org/10.2218/jls.4327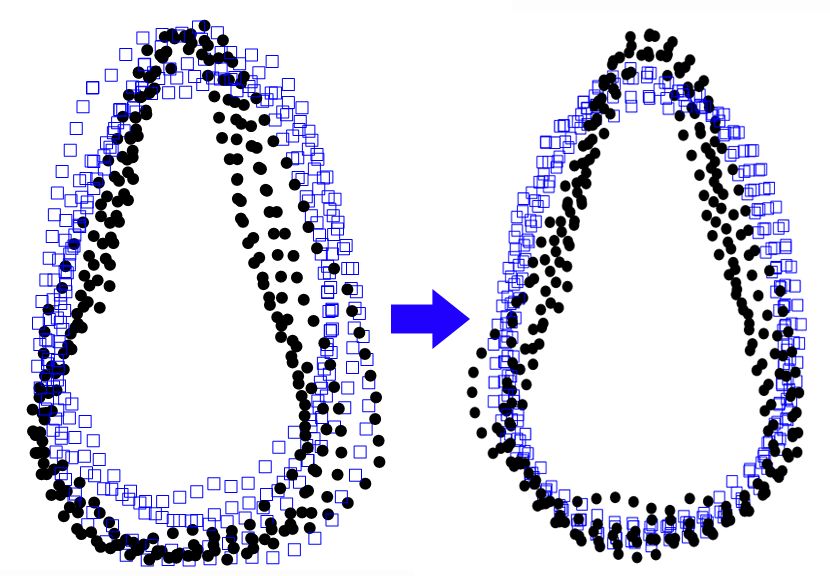
6                                                                                                                                      García-Medrano et al.

Figure 2. Examples of handaxes from Boxgrove Q1B Unit 4 (left) and Swanscombe-UMG (right) used with this methodological approach. The 3D images have been
extracted using Artifact3-D Software (Grosman et al., 2008).

Journal of Lithic Studies (2020) vol. 7, nr. 1, p. xx-xx                                                                DOI: https://doi.org/10.2218/jls.4327
Garcia-Medrano et al.                                                                                       7

Figure 3. Three morphometrical approaches to the analysis of the morphological variability of handaxes using
2D images (a, b) and 3D models (c). a) 60 equally spaced points, b) 28 semi-landmarks, specially concentrated
on tips and proximal parts, and c) 5000 points defining outlines and tool surfaces.

Journal of Lithic Studies (2020) vol. 7, nr. 1, p. xx-xx                 DOI: https://doi.org/10.2218/jls.4327
8                                                                                           García-Medrano et al.

Figure 4. Procrustes superimposition process removes size, translates, and rotates (i.e., orientation) the outlines
from the original shape data. Original outline data (left) vs. Procrustes aligned data (right). These images
correspond with the 60 equally spaced points outlines of handaxes from the Swanscombe (black dots) and
Boxgrove (blue squares).

    Those morphological tendencies lack the size effect and compare the different tools
within a site or between different sites. In addition, the derived principal component scores
has also permitted application of other quantitative tests of multivariate equality of means
between the groups (Costa 2010; Herzlinger & Grosman 2018).

4. Results
     With the outlines defined using 2D images with 28 points, specially located on the tool‟s
tip and butt, the PC1 explains 56.70% of the morphological variability Boxgrove and
Swanscombe-UMG handaxes (Figure 5a), showing a clear division between wider oval
shapes or wider bases with pointed tips. And the second factor, explaining the 16.81% of their
variability of those samples, represent nearly the same pattern that the first PC, but
concentrated mainly on bases: wider bases vs. narrow ones. So, this approach clearly
associates the tool‟s morphological variability to the shape on tips and butts.
     If we define the handaxes‟ outlines using 60 points, equally distributed, the
morphological variability of handaxes is mainly explained by the combination of the two
Principal Components: PC1 (51.09%) and PC2 (17.52%) (Figure 5b). So, despite the clear
dependence on the features of the tip vs butt (PC1), there is a second factor (PC2) which
contribute to the morphological variability of tools: the distribution of the edges, either
convergent or with a clear tendency to parallel edges (Figure 5b).
     Nevertheless, according to the non-parametric Mann-Whitney U test, in both cases only
the PC1 has statistically significant effect in the morphological differences between the
handaxes from those two sites, PC1 (28 points p=0.0001 and 60 points p=0.0001) and PC2
(28 points p=0.66 and 60 points p=0.99).

Journal of Lithic Studies (2020) vol. 7, nr. 1, p. xx-xx                     DOI: https://doi.org/10.2218/jls.4327
Garcia-Medrano et al. 9
Figure 5. Principal components scatter plots of handaxes from Boxgrove (blue square) and Swanscombe (Black
dots). Outlines on 2D images, made on 28 semi-landmarks (upper), and on 60 equally spaced semi-landmarks
(lower) with their percentages of cumulative variance of each graph.
In addition, using the 3D models to analyse variability and creating a web of 5000 points,
using not only outlines but also surfaces and topography, it shows how most of the variability
is expressed for the two first principal components: PC1 (35.37%) and PC2 (10.76%). These
results are very similar to those explained by the 60 equally spaced points. The difference
between them is the main feature represented within these PCs. As in the two previous cases,
PC1 represents the oval shapes vs pointed tips. Nevertheless, the major variability is
concentrated only from the mid part of the object to the tip. On the other hand, the second
component refers to the changes in the proximal part of the tool, in combination with changes
of the tool‟s thickness (Figure 6). In this case, it shows how the thickest tools are more
pointed and the thinner ones more oval through using the combination of 3D models plan-
shape analysis and profile shape, to get the most accurate interpretation of the data.
Journal of Lithic Studies (2020) vol. 7, nr. 1, p. xx-xx DOI: https://doi.org/10.2218/jls.432710 García-Medrano et al.
Figure 6. Principal components scatter plots of handaxes from Boxgrove (blue square) and Swanscombe (Black
dots). Outlines on 3D models, made on 5000 semi-landmarks, with their percentages of cumulative variance. The
ellipses are 90% confidence ellipses. It includes the warps‟ tool, representing the morphology. Colour coding
represents the landmarks that vary the most on the shape trend described on positive and negatives scores of the
PC1 and PC2. Two crosses represent the mean shapes of each group.
In addition, if we apply a Wilcoxon Rank-Sum test on inter-point distances between
group means points (Figure 6) the results show that the mean shapes between Boxgrove and
Swanscombe handaxes are significantly different, (ranksum=2330, n1=30, n2=30, p= < 0.01).
5. Discussion and conclusions
In recent years there has been increasing use of statistically robust methods in
archaeological studies and experiments to characterize and define the morphologies of
Acheulean handaxes. Despite the significance of these tools, there is no one protocol based on
experimental tests to choose the most suitable way to analyse morphology.
In this case, we have compared two Middle Pleistocene British sites: Boxgrove and
Swanscombe. Boxgrove has „classic‟ oval bifaces and those from Swanscombe have more
pointed shapes (Figure 2). According to our results, a low number of points or the
concentration of those on selected parts (in this case, tip and butt), simplify the origin of the
morphological differences or create a tendency to concentrate the analysis on these specific
parts. Besides, the equally distribution of points generates more information along the whole
perimeter of tools, allowing us to include other aspects such as the distribution of edges,
something clearly related with the width effect, localisation of the widest point and the
Elongation index, maximum length (L)/maximum width (m). And this aspect has been crucial
in the traditional interpretation of those samples by authors as Bordes (1961) and Roe (1968).
Both 60 equally spaced points on 2D images and 5000 points on 3D models are very
useful to interpret and analyse the factors which explain the morphological variability of
tools, independent of their size. Nevertheless, increasing the number of points, there are
substantial changes to take into account. PCA provides a small number of independent (non-
correlated) linear combinations (principal components) of a set of measured variables that
capture as much of the variability in the original variables as possible. By default, if the
number of variables (semi landmarks) p is smaller than the number of observations (artifacts)
n, the analysis produces p principal components. If the number of observations is higher, than
Journal of Lithic Studies (2020) vol. 7, nr. 1, p. xx-xx DOI: https://doi.org/10.2218/jls.4327Garcia-Medrano et al. 11
n-1 principal components are produced. The principal components are ranked so that each
subsequent principal component explains less variability than its former one. The proportions
of variability of each PC (and hence also the cumulative explained variability) is calculated by
dividing the PC‟s eigenvalue by the sum of eigenvalues of all the PCs. For example, if the 3D
dataset consists of 60 artifacts and 15000 landmarks coordinates (5000 landmarks × 3
dimensions), then the proportion of explained variability of each PC should be calculated by
dividing each PC‟s eigenvalue by the sum of the eigenvalues of 59 PCs. So, there are
differences in the number of PCs and differences in the percentage of variability represented
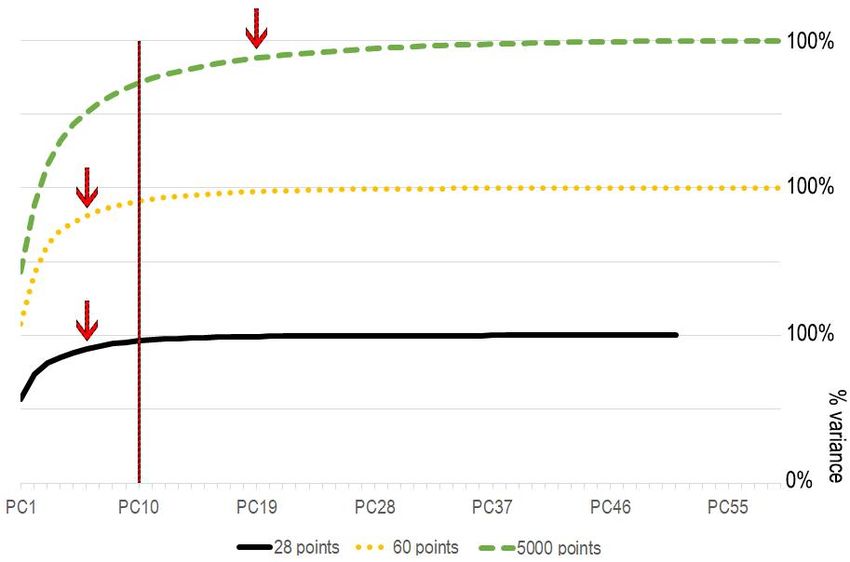
by them on each case (Figure 7). As less number of points are considered, more variability is
represented by the first PCs. Nevertheless, in the case of the outlines made using 28 and 60
points, the 90% of the variability is explained by the first 6 principal components. By the
contrary, in the case of 5000 points, the 90% of variability is explained in the first 19
principal components.
Figure 7. Cumulative variability chart (28 points, 60 points, 5000 points). The red line marks the first ten
principal components. The red arrows show where the PCs represents more than 90% of the variability.
The resulting information is complementary between these approaches. As the 60 points
only define the outline of pieces (contour), the resulting information only refers to that aspect:
the butt and tip and the delineation of the edges. If any additional information is required, e.g.,
the thickness of tools, there is a need to conduct a new analysis of the profile shape. With the
3D models the whole information is recorded, so the 5000 points cover the whole surface of
the tool, analysing at the same time the plan and the profile shapes. This is crucial because the
thickness of tools is one of the factors that has stronger variation through the shaping process
and is clearly associated with the thinning process. In our case, it is much more significant
because the thickness is clearly correlated with the distal shape.
So, as we have seen the localisation of points on specific sectors of the tools, generates a
bias in the results, whereas more points provide a better record. But even nowadays, many of
the researchers do not have a 3D scanner available. If this is the case, the 2D images can be
used to analyse the tool‟s morphological variability. But at least, 60 equally spaced points are
needed to get an accurate analysis of the tool‟s shape. It is also important to remark that for a
complete description of the factors that contribute to the shape variation, not only should the
plan shape be considered, but also the profile of tools. So, the process must be made twice.
Journal of Lithic Studies (2020) vol. 7, nr. 1, p. xx-xx DOI: https://doi.org/10.2218/jls.432712 García-Medrano et al.
On the other hand, working with 3D models, a web of 5000 semi-landmarks will record
the maximum morphology of tools, including plan-shape, surface topography and profile
shape. Through this method, the PCA made on the resulting coordinate points provides a
complete view of all the factors that contribute to the shape variation between several tools or
several groups of tools.
Acknowledgements
P.G.M. has fellowship from the European Union‟s Horizon 2020 research and innovation
programme under the Marie Sklodowska-Curie grant agreement N. 748316. This study has
been developed at the Dpt. Britain, Europe and Prehistory (British Museum) at the Franks
House. The University of Bradford and Dr. Adrian Evans, throughout the “Fragmented
Heritage AHRC Project”, have led us the scanner to work with. We feel really thankful with
the Hebrew University of Jerusalem, Dr. Leore Grosman and Antoine Miller, who have
helped us with the Artifact3-D and AGMT3-D softwares.
References
Archer, W. & Braun, D.R. 2010, Variability in bifacial technology at Elandsfontein, Western
cape, South Africa: A geometric morphometric approach. Journal of Archaeological
Science, 37(1): 201-209. doi:10.1016/j.jas.2009.09.033
Ashton, N. & McNabb, J. 1996, The flint industries from the Waechter excavations. In:
Excavations at Barnfield Pit, Swanscombe, 1968-72, (Conway, B., McNabb, J. &
Ashton, N. Eds.), British Museum Occasional Paper Vol. 125, British Museum Press,
London: p. 53-66.
Ashton, N., Lewis, S.G. & Parfitt, S. (Eds.) 1998, Excavations at the Lower Palaeolithic Site
at East Farm, Barnham, Suffolk 1989-94. British Museum Occasional Paper Vol. 125,
British Museum Press, London, 305 p.
Barnes, R.S.K. 1980, Coastal Lagoons. Cambridge University Press, Cambridge, 120 p.
Binford, L.R. 1985, Human Ancestors: changing views of their behaviour. Journal of
Anthropological Archaeology, 4(4): 292-327. doi:10.1016/0278-4165(85)90009-1
Boëda, E., Geneste, J.-M. & Meignen, L. 1990, Identification de chaînes opératoires lithiques
du Paléolithique ancien et moyen. Paléo, Revue d’Archéologie Préhistorique, 2(1): 43-
80. (in French) (“Identification of lithic chaînes opératoires of the Old and Middle
Palaeolithic”) doi:10.3406/pal.1990.988
Bookstein, F.L. 1997, Landmark methods for forms without landmarks: morphometrics of
group differences in outline shape. Medical Image Analysis, 1(3): 225-243.
Bordes, F. 1961, Typologie du Paléolithique Ancien et Moyen. CNRS Editions, Paris, 216 p.
(in French) (“Old and Middle Palaeolithic typology”)
Bretzke, K. & Conard, N.J. 2012, Evaluating morphological variability in lithic assemblages
using 3D models of stone artifacts. Journal of Archaeological Science, 39(12): 3741-
3749. doi:10.1016/j.jas.2012.06.039
Bridgland, D.R. 1994, Quaternary of the Thames. Chapman and Hall, London, 460 p.
Carbonell, E., Mosquera, M., Ollé, A., Rodríguez, X.P., Sala, R., Vaquero, M. & Vergés, J.M.
1992, New elements of the logical analitic system. Cahier Noir, 6, 61 p.
Journal of Lithic Studies (2020) vol. 7, nr. 1, p. xx-xx DOI: https://doi.org/10.2218/jls.4327Garcia-Medrano et al. 13
Clark, J.D. 1996, The Acheulian industrial complex in Africa and elsewhere. In: Integrative
Paths to the Past: Palaeoanthropological Advances in Honor of F. Clark Howell
(Corruccini, R.S. & Ciochon, R.L., Eds.), Englewood Cliffs, Prentice Hall Publishers,
New Jersey: p. 451-469.
Conway, B., McNabb, J. & Ashton, N. 1996, Excavations at Barnfield Pit, Swanscombe,
1968-72. British Museum Press, London, 265 p.
Costa, A.G. 2010, A Geometric Morphometric assessment of Plan shape in bone and stone
Acheulean bifaces from the Middle Pleistocene site of Castel di Guido, Latium, Italy.
In: New Perspectives on Old Stones: Analytical Approaches to Paleolithic Technologies
(Lycett, S.L. & Chauhan, P.R.E., Eds), Springer, New York: p. 23-41. doi:10.1007/978-
1-4419-6861-6_2
Dryden I.L. & Mardia K.V. 1998, Statistical shape analysis. Wiley, Chichester, 347 p.
Eren, M.I. & Lycett, S.J. 2012, Why Levallois? A morphometric comparison of experimental
„preferential‟ Levallois flakes versus debitage flakes. PLoS One, 7(1): e29273.
doi:10.1371/journal.pone.0029273
García-Medrano, P., A. Ollé, N. Ashton & Roberts M.B. 2019, The Mental Template in
Handaxe Manufacture: New Insights into Acheulean Lithic Technological Behavior at
Boxgrove, Sussex, UK. Journal of Archeological Method and Theory, 26(1): 396-422.
doi:10.1007/s10816-018-9376-0
Gibbard, P. 1985, The Pleistocene History of the Middle Thames Valley. Cambridge
University Press, Cambridge, 168 p.
Grosman, L., Smikt, O. & Smilansky, U. 2008, On the application of 3-D scanning
technology for the documentation and typology of lithic artifacts. Journal of
Archaeological Science, 35(12): 3101-3110. doi:10.1016/j.jas.2008.06.011
Hammer, Ø. & Harper, D.A.T. 2006, Paleontological Data Analysis. Malden. Blackwell
Publishing, Oxford, 368 p.
Hammer, Ø., Harper, D.A. & Ryan, P.D. 2001, PAST: Paleontological statistics package for
education and data analysis. Paleontologia Electronica, 4(1): 4-9. URL: http://palaeo-
electronica.org/2001_1/past/issue1_01.htm
Herzlinger, G. & Grosman, L. 2018, AGMT3-D: A software for 3-D landmarks-based
geometric morphometric shape analysis of archaeological artifacts. PLoS ONE, 13(11):
e0207890. doi:10.1371/journal.pone.0207890
Hillson, S.W., Parfitt, S.A., Bello, S.M., Roberts, M.B. & Stringer, C.B. 2010, Two hominin
incisor teeth from the middle Pleistocene site of Boxgrove, Sussex, England. Journal of
Human Evolution, 59(5): 493-503. doi:10.1016/j.jhevol.2010.06.004
Lewis, S.G., Roberts, C.L. 1999, Location of buried cliff-line using resistivity methods. In:
Boxgrove: a Middle Pleistocene Hominid Site at Eartham Quarry, Boxgrove, West
Sussex (Roberts, M.B. & Parfitt, S., Eds.), English Heritage, London: p. 37-41.
Lycett, S.J. 2009, Quantifying transitions: Morphometric approaches to Palaeolithic
variability and technological change. In: Sourcebook of Paleolithic Transitions:
Methods, Theories, and Interpretations (Camps, M. & Chauhan, P., Eds.), Springer,
New York: p. 79-92. doi:10.1007/978-0-387-76487-0_5
Lycett, S.J. & Chauhan, P.R. 2010, Analytical approaches to Palaeolithic technologies: An
introduction. In: New Perspectives on Old Stones: Analytical Approaches to Paleolithic
Journal of Lithic Studies (2020) vol. 7, nr. 1, p. xx-xx DOI: https://doi.org/10.2218/jls.432714 García-Medrano et al.
Technologies (Lycett, S.J., Chauhan, P.R., Eds.), Springer, New York: p. 1-22.
doi:10.1007/978-1-4419-6861-6_1
Lycett, S.L. & von Cramon-Taubadel, N. 2013, A 3D morphometric analysis of surface
geometry in Levallois cores: patterns of stability and variability across regions and their
implications. Journal of Archaeological Science, 40(3): 1508-1517.
doi:10.1016/j.jas.2012.11.005
Lycett, S.J., von Cramon-Taubadel, N. & Foley, R.A. 2006, A crossbeam co-ordinate caliper
for the morphometric analysis of lithic nuclei: a description, test and empirical examples
of application. Journal of Archaeological Science, 33(6):847-861.
doi:10.1016/j.jas.2005.10.014
McNabb, J. 2007, The British Lower Palaeolithic: Stones in Contention. Routledge, London,
448 p.
McNabb, J., Cole, J. & Hoggard, C.S. 2018, From side to side: Symmetry in handaxes in the
British Lower and Middle Palaeolithic. Journal of Archaeological Science: Reports, 17:
293-310. doi:10.1016/j.jasrep.2017.11.008
Moncel, M. H., Ashton, N., Lamotte, A., Tuffreau, A., Cliquet, D., & Despriée, J. 2015,
North-west Europe early Acheulian. Journal of Anthropological Archaeology, 40: 302-
331. doi:10.1016/j.jaa.2015.09.005
Newcomer, M.H. 1971, Some quantitative experiments in handaxe manufacture. World
Archaeology, 3(1): 85-104. doi:10.1080/00438243.1971.9979493
Okumura, M. & Araujo, A.G.M. 2019. Archaeology, biology and borrowing. A critical
examination of GM in Archaeology. Journal of Archaeological Science, 101: 149-158.
doi:10.1016/j.jas.2017.09.015
Overy, C.D. (Ed.) 1964, The Swanscombe Skull: a Survey of Research on a Pleistocene Site.
Royal Anthropological Institute. Occasional Paper No. 20. Proceedings of the
Prehistoric Society, 32: 367-368. doi:10.1017/S0079497X00014602
Parfitt, S. 1999a, Mammalia. In: Boxgrove: a Middle Pleistocene Hominid Site at Eartham
Quarry, Boxgrove, West Sussex (Roberts, M.B. & Parfitt, S., Eds.), English Heritage,
London: p. 197-290.
Parfitt, S. 1999b, Palaeontology. In: Boxgrove: a Middle Pleistocene Hominid Site at Eartham
Quarry, Boxgrove, West Sussex (Roberts, M.B. & Parfitt, S., Eds.), English Heritage,
London: p. 157-196.
Parfitt, S.A., Ashton, N.M., Lewis, S.G., Abel, R.L., Coope, G.R., Field, M.H., Gale, R.,
Hoare, P.G., Larkin, N.R., Lewis, M.D., Karloukovski, V., Maher, B.A., Peglar, S.M.,
Preece, R.C., Whittaker, J.E., Stringer, C.B. 2010, Early Pleistocene human occupation
at the edge of the boreal zone in northwest Europe. Nature, 466: 229-233.
doi:10.1038/nature09117
Parfitt, S.A., Barendregt, R.W., Breda, M., Candy, I., Collins, M.J., Coope, G.R., Durbidge,
P., Field, M.H., Lee, J.R., Lister, A.M., Mutch, R., Penkman, K.E.H., Preece, R.C.,
Rose, J., Stringer, C.B., Symmons, R., Whittaker, J.E., Wymer, J.J. & Stuart, A.J. 2005,
The earliest record of human activity in northern Europe. Nature, 438: 1008-1012.
doi:10.1038/nature04227
Pope, M. 2002. The Significance of Biface-rich Assemblages: an Examination of the
Behavioural Controls on Lithic Assemblage Formation in the Lower Palaeolithic.
Journal of Lithic Studies (2020) vol. 7, nr. 1, p. xx-xx DOI: https://doi.org/10.2218/jls.4327Garcia-Medrano et al. 15
Doctoral Thesis at the Department of Archaeology, University of Southampton, UK,
350 p.
Pope, M. & Roberts, M.B. 2005, Observations on the relationship between Palaeolithic
individuals and artefact scatters at the Middle Pleistocene site of Boxgrove, UK. In: The
Hominid Individual in Context: Archaeological Investigations of Lower and Middle
Palaeolithic Landscapes, Locales and Artefacts (Gamble, C. & Porr, M., Eds.),
Routledge, London, 456 p.
Preece, R.C. (Ed.) 1995, Island Britain: a Quaternary Perspective. The Geological Society
Special Publication Vol. 96, University of Cambridge, UK, 280 p.
Roberts, M.B. & Parfitt, S. (Eds) 1999a, Boxgrove: a Middle Pleistocene Hominid Site at
Eartham Quarry, Boxgrove, West Sussex. English Heritage, London, 463 p.
Roberts, M.B. & Parfitt, S. 1999b, Human modification of faunal remains. In: Boxgrove: a
Middle Pleistocene Hominid Site at Eartham Quarry, Boxgrove, West Sussex (Roberts,
M.B. & Parfitt, S., Eds.), English Heritage, London: p. 395-414.
Roberts, M.B., Parfitt, S.A., Pope, M. & Wenban-Smith, F.F. 1997, Boxgrove, West Sussex:
rescue excavations of a Lower Palaeolithic landsurface (Boxgrove Project B 1989-91).
Proceedings of the Prehistoric Society, 63: 303-358. doi:10.1017/S0079497X00002474
Roberts, M., & Pope, M. 2018, The Boxgrove wider area project. Mapping the early Middle
Pleistocene deposits of the Slindon Formation across the Coastal Plain of West Sussex
and eastern Hampshire. Spoilheap monograph 15, Lavenham Press, Suffolk, 193 p.
Roe, D. 1968, British lower and middle Palaeolithic handaxe groups. Proceedings of the
Prehistoric Society, 34: 1-82. doi:10.1017/S0079497X00013840
Rohlf, F.J. 2009, TpsDig2 (version 2.0). Department of Ecology and Evolution. State University of
New York at Stony Brook. http://life.bio.sunysb.edu/morph/morphmet/tpsdig2w32.exe
Rovner, I. 1995, Complex measurements made easy: Morphometric analysis of artefacts using
Expert Vision Systems. In: Computer Applications and Quantitative Methods in
Archaeology 1993 (Wilcock, J. & Lockyear, K., Eds.), British Archaeological Reports,
Oxford: p. 31-37.
Schreve, D.C. 1996, The mammalian fauna from the Waechter excavations, Barnfield Pit
Swanscombe. In: Excavations at Barnfield Pit Swanscombe, 1968-72 (Conway, B.,
Ashton, N. & McNabb, J., Eds.), British Museum Occasional Paper Vol. 94, London:
p.149-162.
Schreve, D.C. 2004, The mammalian fauna of Barnfield Pit, Swanscombe, Kent. In: The
Quaternary Mammals of Southern and Eastern England (Schreve, D.C., Ed.),
Quaternary Research Association, London: p. 29-48.
Smith, G.M. 2013, Taphonomic resolution and hominin subsistence behaviour in the Lower
Palaeolithic: differing data scales and interpretive frameworks at Boxgrove and
Swanscombe (UK). Journal of Archaeological Science, 40: 3754-3767.
doi:10.1016/j.jas.2013.05.002
Stringer, C.B. 2012, The status of Homo heidelbergensis (Schoetensach 1908). Evolutionary
Anthropology: Issues, News, and Reviews, 21: 101-107. doi:10.1002/evan.21311
Stringer, C. & Gamble, C. 1993, In Search of the Neanderthals. Thames and Hudson,
London: 247 p.
Journal of Lithic Studies (2020) vol. 7, nr. 1, p. xx-xx DOI: https://doi.org/10.2218/jls.432716 García-Medrano et al.
Stringer, C. & Trinkaus, E. 1999, The human tibia from Boxgrove. In: Boxgrove: a Middle
Pleistocene Hominid Site at Eartham Quarry, Boxgrove, West Sussex (Roberts, M.B. &
Parfitt, S., Eds.), English Heritage, London: p. 420-421.
Stringer, C.B., Trinkaus, E., Roberts, M.B., Parfitt, S.A. & Macphail, R.I. 1998, The Middle
Pleistocene human tibia from Boxgrove. Journal of Human Evolution 34(5): 509-547.
doi:10.1006/jhev.1998.0215
Trinkaus, E., Stringer, C.B., Ruff, C.B., Hennessy, R.J., Roberts, M.B. & Parfitt, S.A. 1999,
Diaphyseal cross-sectional geometry of the Boxgrove 1 Middle Pleistocene human tibia.
Journal of Human Evolution, 37(1): 1-25. doi:10.1006/jhev.1999.0295
Waechter, J. 1968, Swanscombe 1968. Proceedings of the Royal Anthropological Institute of
Great Britain and Ireland 68: 53-61. doi:10.2307/3031707
Waechter, J. 1969, Swanscombe 1969. Proceedings of the Royal Anthropological Institute of
Great Britain and Ireland 69: 83-95. doi:10.2307/3031747
Waechter, J. 1976, Man Before History. Elsevier, London: 150 p.
Wenban-Smith, F.F. 1989, The use of canonical variates for determination of biface
manufacturing technology at Boxgrove Lower Paleolithic site and the behavioural
implications of this technology. Journal of Archaeological Science, 6(1): 17-26.
doi:10.1016/0305-4403(89)90053-8
Journal of Lithic Studies (2020) vol. 7, nr. 1, p. xx-xx DOI: https://doi.org/10.2218/jls.4327You can also read