OC6 Phase I: Investigating the underprediction of low-frequency hydrodynamic loads and responses of a floating wind turbine
←
→
Page content transcription
If your browser does not render page correctly, please read the page content below

Journal of Physics: Conference Series

PAPER • OPEN ACCESS

OC6 Phase I: Investigating the underprediction of low-frequency
hydrodynamic loads and responses of a floating wind turbine
To cite this article: A N Robertson et al 2020 J. Phys.: Conf. Ser. 1618 032033

View the article online for updates and enhancements.

 This content was downloaded from IP address 46.4.80.155 on 07/11/2020 at 18:13
The Science of Making Torque from Wind (TORQUE 2020) IOP Publishing
Journal of Physics: Conference Series 1618 (2020) 032033 doi:10.1088/1742-6596/1618/3/032033

OC6 Phase I: Investigating the underprediction of low-
frequency hydrodynamic loads and responses of a floating wind
turbine

 A N Robertson1, S Gueydon2, E Bachynski3, L Wang1, J Jonkman1, D Alarcón4,
 E Amet5, A Beardsell6, P Bonnet7, B Boudet5, C Brun8, Z Chen9, M Féron10, D
 Forbush11, C Galinos12, J Galvan13, P Gilbert14, J Gómez15, V Harnois15, F
 Haudin16, Z Hu17, J Le Dreff18, M Leimeister19, F Lemmer20, H Li3, G
 McKinnon21, I Mendikoa13, A Moghtadaei22, S Netzband23, S Oh24, A Pegalajar-
 Jurado12, M Q Nguyen16, K Ruehl11, P Schünemann25, W Shi26, H Shin27, Y Si9, F
 Surmont8, P Trubat4, J Qwist28, S Wohlfahrt-Laymann20
 1
 National Renewable Energy Laboratory, 15013 Denver W Pkwy, Golden, CO, USA 80401
 2
 Maritime Research Institute Netherlands, Haagsteeg 2, 6708 PM Wageningen, Netherlands
 3
 Norwegian University of Science and Technology, 7491 Trondheim, Norway
 4
 Universitat Politècnica de Catalunya, Jordi Girona 1-3, 08034, Barcelona, Spain
 5
 Bureau Veritas, 60 avenue du Général de Gaulle, 92046 Paris - La Défense
 6
 DNV GL, One Linear Park, Avon St., Temple Quay, Bristol, BS2 0PS, UK
 7
 Siemens Digital Industries Software, C/Lluis Muntadas 5, Cornellà, Spain 08940
 8
 Bureau Veritas, 8, avenue Jacques Cartier, Atlantis - 44807 Saint-Herblain Cdx - France
 9
 Ocean College, Zhejiang University, Zhoushan 316021, China
 10
 DORIS Engineering, 58a rue du Dessous des Berges, 75013 Paris, France
 11
 Sandia National Laboratories, 1515 Eubank Blvd SE, Albuquerque, NM 87123
 12
 DTU Wind Energy, Nils Koppels Allé 403, Kgs. Lyngby, DK-2800, Denmark
 13
 Tecnalia Research & Innovation, Parque Tecnologico Bizkaia, Ed.700, 48160 Derio, Spain
 14
 IFPEN, 4 avenue de Bois Préau 92852 Rueil-Malmaison Cedex, France
 15
 PRINCIPIA, ZAC Athelia I - 215 Voie Ariane, 13705 La CIOTAT Cedex France
 16
 Vulcain Ingénierie, 5 rue Beffroy, 92200 Neuilly-sur-Seine, France
 17
 School of Engineering, Newcastle University, Newcastle upon Tyne, NE1 7RU, UK
 18
 EDF R&D, 7 boulevard Gaspard Monge, 91120 Palaiseau, France
 19
 Fraunhofer Inst. for Wind Energy Systems, Am Luneort 100, 27572 Bremerhaven, Germany
 20
 University of Stuttgart, 70569 Stuttgart, Germany
 21
 Orcina Ltd., Daltongate, Ulverston, Cumbria LA12 7AJ, UK
 22
 Queen’s University Belfast, Belfast, BT9 5AG, Northern Ireland, United Kingdom
 23
 Hamburg University of Technology, 21071 Hamburg, Germany
 24
 ClassNK, 4-7 Kioicho, Chiyodaku, Tokyo, Japan
 25
 Universität Rostock, Albert-Einstein-Str. 2, 18059 Rostock, Germany
 26
 Dalian University of Technology, No.2 Linggong Road, Dalian, Liaoning, China 116024
 27
 University of Ulsan, 93 Daehakro Namgu Ulsan, 44610, South Korea
 28
 4Subsea, Hagaløkkveien 26, 1383 Asker, Norway
 Amy.Robertson@nrel.gov

 Abstract. Phase I of the OC6 project is focused on examining why offshore wind design tools
 underpredict the response (loads/motion) of the OC5-DeepCwind semisubmersible at its surge
 and pitch natural frequencies. Previous investigations showed that the underprediction was
 primarily related to nonlinear hydrodynamic loading, so two new validation campaigns were
 performed to separately examine the different hydrodynamic load components. In this paper, we

 Content from this work may be used under the terms of the Creative Commons Attribution 3.0 licence. Any further distribution
 of this work must maintain attribution to the author(s) and the title of the work, journal citation and DOI.
Published under licence by IOP Publishing Ltd 1
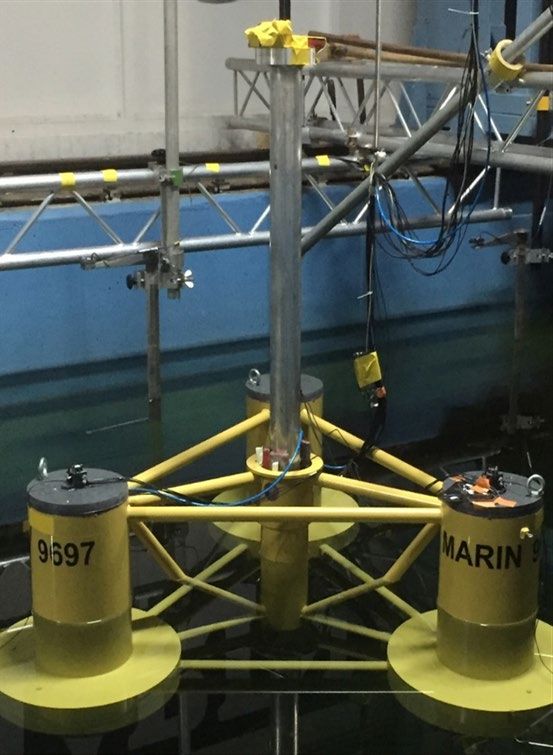
The Science of Making Torque from Wind (TORQUE 2020) IOP Publishing
Journal of Physics: Conference Series 1618 (2020) 032033 doi:10.1088/1742-6596/1618/3/032033

 validate a variety of tools against this new test data, focusing on the ability to accurately model
 the low-frequency loads on a semisubmersible floater when held fixed under wave excitation and
 when forced to oscillate in the surge direction. However, it is observed that models providing
 better load predictions in these two scenarios do not necessarily produce a more accurate motion
 response in a moored configuration.

1. Introduction
Currently, floating wind systems are in a precommercial stage of development with one five-turbine
wind farm and some single utility-scale prototypes deployed in the open ocean. Fixed-bottom systems
are becoming quite prolific, in large part due to their competitive cost of energy. Floating wind systems,
however, are still significantly more expensive, and the costs for these systems need to be reduced to be
commercially viable. That cost reduction will come from a variety of sources: One avenue is to better
optimize the designs to minimize the requirements on support structures and make them easier to mass
manufacture and deploy. Floating wind optimization is difficult because the systems are complex and
coupled, with multiple sources of excitation. An efficient search for optimal solutions requires advanced
modeling and design tools capable of accurately capturing the physical behavior of these systems under
realistic conditions. Methodically identifying and addressing the sources of inaccuracy and uncertainty
in these tools will enable a path toward finding cost-optimal floating wind design solutions.
 The OC3 (Offshore Code Comparison Collaboration) – OC6 projects (Offshore Code Comparison
Collaboration, Continued with Correlation and unCertainty) were created under the framework of the
International Energy Agency (IEA) Wind to address the need for verifying and validating the load
predictions of coupled modeling tools for offshore wind design. In the present phase (Phase I of OC6),
the focus is on examining the underprediction of the response (loads/motion) of a floating
semisubmersible (semi) at its surge and pitch natural frequencies. This issue was identified within the
OC5 Phase II project [1], which focused on validating modeling tools against a scaled-model test of the
OC5-DeepCwind semi in a wave tank under combined wind and wave loading. In general, the modeling
tools represented the behavior of the system well, but with a persistent underprediction of the global
loads and motion (about 20% underprediction). In some applications this level of inconsistency would
be considered acceptable; however, it is a concern when attempting to develop optimized designs.
Further investigation showed that the underprediction came primarily from the underestimation of the
loads/motion of the semi in the low-frequency region where the pitch and surge natural frequencies were
located. These frequencies lie outside the linear wave excitation region and are excited by nonlinear
hydrodynamic loading.
 The underprediction of the response of floating wind systems
at these frequencies has been reported by other researchers as
well. Azcona et al. [2] investigated new hybrid techniques for
wind loading on floating systems and found that, even when wind
loading was included, the low-frequency response of a semi
(similar to the present geometry) was underpredicted when
comparing simulations to experimental measurements.
Pegalajar-Jurado and Bredmose [3] investigated methods to better z
represent the low-frequency response of the NAUTILUS-DTU10
floating wind turbine (a semi design) by tuning damping values
directly from a sea state using operational modal analysis. They y x
found that tuning the damping to the response under irregular or O
random (pink noise) wave loading led to a better match as
compared to tuning the damping properties from free-decay tests.
However, the tuning had to be redone for each wave case. Simos
et al. [4] investigated various frequency-domain formulations for Figure 1: Configuration 1, OC6-
predicting the low-frequency response of a semi in irregular DeepCwind floating semi-
waves, paying special attention to the effect of quadratic transfer submersible with rigid tower (photo
functions (QTFs). By comparing the model predictions with by Amy Robertson, NREL)

 2
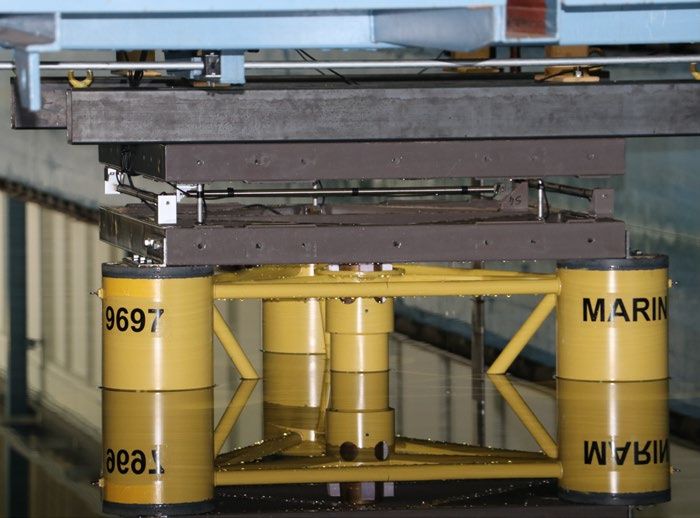
The Science of Making Torque from Wind (TORQUE 2020) IOP Publishing
Journal of Physics: Conference Series 1618 (2020) 032033 doi:10.1088/1742-6596/1618/3/032033

wave-tank experiments, it was observed that Newman’s
approximation tends to underestimate the second-order
response in some cases. Underprediction at low frequencies
has even been seen in tension-leg-platform designs, as
highlighted in Caillé et al [5]. Some success in this area was
achieved by Lemmer et al. [6] when examining the
TripleSpar floating wind system. The authors were able to
reproduce the surge, heave, and pitch low-frequency
response in irregular waves using drag values from the
literature. The reason for the improved results is believed to
be related to the fact that the heave plates are located quite
 Figure 2: Configuration 2, OC6-
deep (54 m), compared to about 20 m for the OC5-
 DeepCwind floating semisubmersible
DeepCwind semi.
 attached to a carriage – seen from +x to -
2. Methodology x (photo by Amy Robertson, NREL)
To better understand the nonlinear hydrodynamic loading, two new wave-tank validation campaigns
were performed at the concept basin at MARIN for the OC5-DeepCwind semisubmersible design. Phase
I of OC6 is dedicated to validating simulation models using the measurements from these experiments
to better understand the reasons for the underprediction of the nonlinear hydrodynamic response.
 In the first campaign, the floating system was simplified from the testing configuration in OC5 to
remove as much uncertainty from the test as possible. Since hydrodynamic loads were of primary
interest, the turbine was removed and the tower was changed to a stout, rigid one with inertial properties
similar to those of the OC5-DeepCwind semi turbine and tower combined (see Figure 1, Configuration
1). The mooring system was also replaced with a spring and wire mooring system that reproduced the
angle at the fairlead and the linear response behavior of the original catenary system (see [7, 8] for more
details). The wetted geometry in the tests was the same as for the OC5 system. The 6-degree of freedom
(DOF) motion of the system, the mooring loads at each fairlead, and the wave elevation at multiple
locations were measured. Through extensive repetition tests and documentation of sources of uncertainty
bias, the first campaign assessed the role of uncertainty in the experiments in the disparity between
simulations and measurements.
 The second validation campaign [8] investigated the diffraction and radiation hydrodynamic loads
on the floating wind system separately. The tower was removed from the floater and the platform was
affixed to a carriage system as shown in Figure 2 (Configuration 2). This setup allowed the floater to
be held fixed under wave excitation to examine the diffraction loads, then to be forced to oscillate in the
surge direction to examine the radiation loads. Of course, for both conditions, drag forces were still
present as well. The 6-DOF force on the entire structure was measured at the top of the structure, and
the same wave cases from the previous campaign were run for this configuration. The right-handed
coordinate system used in this study originates on the calm water level at the center of the central column,
with positive x (surge) in the direction of wave propagation and z upward (see Figure 1).
 The five load cases (LC) examined in the two experimental campaigns are summarized in Table 1.
All data and results are presented at full scale. The details of the most relevant cases are provided in
Table 2 and Table 3. A full summary of the system properties for the two configurations and the
associated load cases can be found in the description document for the project [8].
 Table 1. Load Case Configurations
 Load Case Configuration Description
 LC 1 Configuration 2 Towing tests at 6 velocities: 0.5, 1.0, 1.5, 2.0, 2.5, and 3.0 m/s
 LC 2 Configuration 2 Forced surge oscillation at 3 frequencies, each with 2 amplitudes
 LC 3 Configuration 2 Four wave cases—2 regular and 2 irregular
 LC 4 Configuration 1 Free decay in 3 DOFs with 2 initial offset positions for each DOF
 LC 5 Configuration 1 Four wave cases—same as for LC 3

 3
The Science of Making Torque from Wind (TORQUE 2020) IOP Publishing
Journal of Physics: Conference Series 1618 (2020) 032033 doi:10.1088/1742-6596/1618/3/032033

 Table 2. Specification of Forced Oscillation and Free-Decay Load Cases
 Load Case Amplitude (m) Period (s) Load Case Mode Initial Offset
 2.1 40.11 105.2 4.1 Surge -1.86 m
 2.2 30.07 104.5 4.2 Surge -3.39 m
 2.3 9.601 31.23 4.3 Heave -1.06 m
 2.4 6.444 31.01 4.4 Heave -1.57 m
 2.5 3.367 21.07 4.5 Pitch -2.21°
 2.6 4.481 21.02 4.6 Pitch -3.95°
 Table 3. Irregular Wave Specification
 Significant Wave
 Load Case Spectrum Peak Period (s) Simulation Length
 Height (m)
 3.3 and 5.3 JONSWAP, γ=3.3 7.4 12.0 3 hr
 3.4 and 5.4 White Noise 6.7 6-26 3 hr
 Participants of the OC6 project built numerical models for the two configurations (fixed and floating)
in their respective tools and simulated the five load cases in the time domain. The modeling approaches
used by the participants are summarized in the Appendix. Participants used either a potential flow (PF)-
based solution, a strip-theory solution with Morison’s equation, or a combination of the two. The
potential-flow models use radiation/diffraction matrices computed from a frequency-dependent
boundary-element method (BEM), such as WAMIT. To account for viscous effects, some participants
added the drag term from Morison’s equation to their time-domain solution, whereas others added a
damping matrix (“Additional Damping” in the Appendix) in place of, or in addition to, this drag term.
For the BEM solution, some participants used only a first-order solution; those using a second-order
solution included the QTF. To evaluate the QTF, it is necessary to solve the second-order potential-
flow problem where the boundary condition on the body surface depends on the first-order motion of
the floater. Therefore, most models based on second-order PF used two sets of QTFs: one for the fixed
condition (LC 3.3) and another for the floating condition (LC 5.3). One exception is NTNU which used
the QTF for the floating condition in both cases. Other modeling choices that contribute to the response
are wave stretching and the use of measured waves from the experiment instead of synthetic waves with
the appropriate spectrum.
 Results for LC 1-4 were provided to the participants to tune their models. The exact tuning approach
differs for each participant; however, most focused on adjusting the drag coefficients to match the steady
drag and moment of LC 1 and/or the radiation load of LC 2. Some also tuned damping matrices based
on the free-decay time history of LC 4. It should be noted that the participants were required to produce
reasonable predictions at the wave frequencies for LC 3; tuning purely for low frequencies at the expense
of wave-frequency response was not allowed. LC 5 was reserved for a “blind comparison.” Only those
that worked on the experiments, NREL and the Norwegian University of Science and Technology, had
access to the experimental data of LC 5, though their models were not calibrated based on this load case.
 The validation approach taken in this project was to determine whether simulated results using a
model with the measured properties of the experiment fall within the uncertainty bounds of the
experimental measurements. These bounds encompassed uncertainties in the measurement sensors as
well as the excitation to the system (e.g., wave properties) and the system properties (e.g., mass/inertia
and mooring properties). The uncertainty of the excitation and system properties were propagated to
the system response and combined with the measurement uncertainty, as summarized by Robertson et
al. [7]. An alternative approach would be to put the excitation and system uncertainties on the modeling
side; however, the approach used here allowed for a more straightforward assessment of validation.
 To validate the simulation response for these load cases against the measurements, a “PSD sum”
metric was created to capture frequency-dependent responses both inside and outside the wave

 4
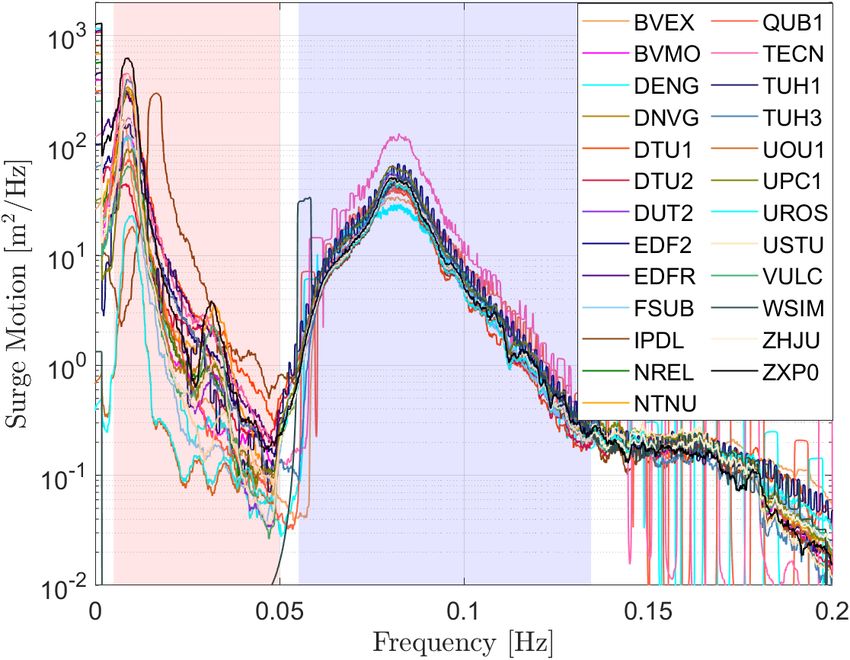
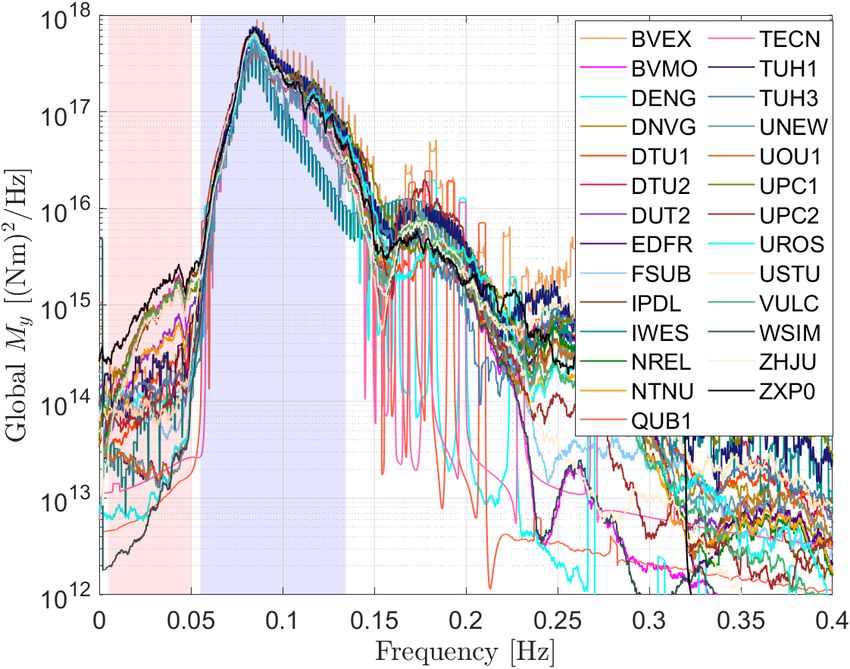
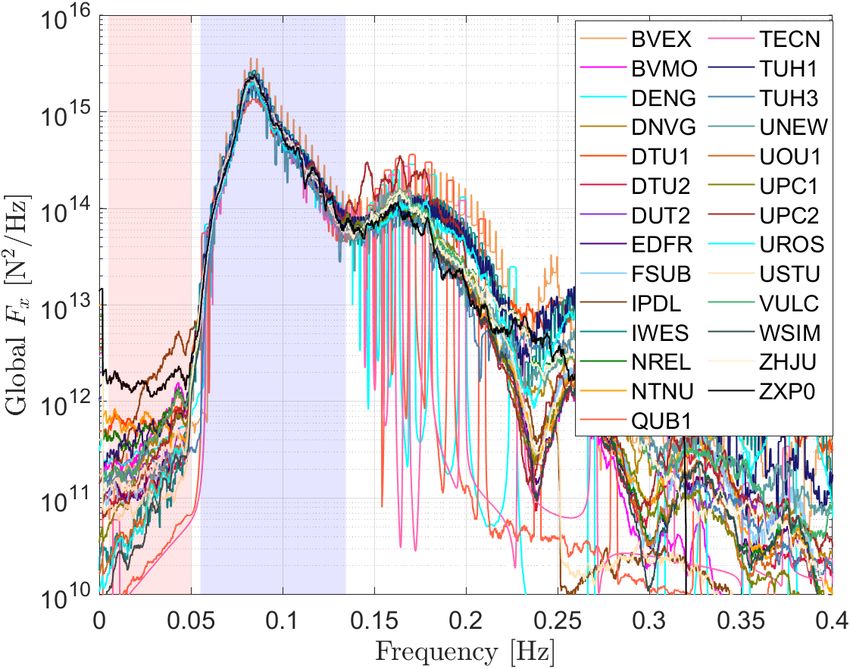
The Science of Making Torque from Wind (TORQUE 2020) IOP Publishing
Journal of Physics: Conference Series 1618 (2020) 032033 doi:10.1088/1742-6596/1618/3/032033

frequency range of irregular sea states. The power-spectral density (PSD) sums are computed based on
the one-sided, unsmoothed, discrete power density functions:

 = � ( ) Δ
 =
where ( ) is the discrete PSD of the response at frequency , Δ is the frequency increment, and
 are the indices of the first and last frequency of interest. The frequency limits for the low- and wave-
frequency regions of the spectrum are shown in Table 4. These are based on identifying the ranges over
which the wave spectra were defined, then encompassing the lower frequencies below that range without
considering the zero-frequency mean value.
 Table 4. Frequency Limits for Summation of Power Spectral Density for Response Metrics
 Wave Low-Frequency Window Wave-Frequency Window
 Irregular Wave 0.005 to 0.05 Hz 0.05519 to 0.1345 Hz
 White Noise 0.005 to 0.036 Hz 0.0385 to 0.1667 Hz

3. Results
The validation objective for this work is to accurately predict the low-frequency response of the floating
semi under irregular wave loading in LC 5.3 and 5.4, which correspond to a JONSWAP and white-noise
wave, respectively. The results presented here, however, only focus on LC 5.3 because of the limitations
on paper length. Validation is achieved if the PSD sum metric in the low-frequency region (see Table 4)
of the simulated results falls within the uncertainty bounds of the experimental measurements. LC 2, 3,
and 4 are used to examine the ability of the simulation tools to predict the hydrodynamic load
components that contribute to the floating response in LC 5. LC 1 did not provide much insight into the
predictions for a floating configuration and, therefore, is not included in the analysis in this paper.
 A comparison of the PSD of the surge response for LC 5.3 (floating platform) and the surge force for
LC 3.3 (fixed platform) between simulations and experiment is shown in Figure 3. The PSD sum metric
ranges are indicated by the pink coloration for the low-frequency region and blue for the wave frequency.
Both figures show a large response peak at the wave frequency around 0.08 Hz; however, the floating
condition (LC 5.3) also shows a larger peak in the low-frequency region associated with the surge natural
frequency of the system at approximately 0.01 Hz. With only a few exceptions, most participants (shown
in different colors) match the experimental measurements (ZXP0 shown in black) in the wave-frequency
region well, but underestimate the load/motion in the low-frequency region both for the fixed (LC 3)
and floating (LC 5) conditions. The goal here is to understand the source of the differences between
simulation and experiment for the surge natural frequency peak in LC 5.3 as well as the pitch natural
frequency peak for the pitch response (shown in Figure 4).
 Figure 5 shows the PSD sum metric for the surge loads and motion across LC 2, 3, and 5. As shown
in Figure 5c, no modeling tool was able to predict the response at the surge natural frequency for LC
5.3 within the uncertainty bounds of the experiment (grey bands); therefore, all simulation tools fail the
validation objective. The hatched bars indicate modeling tools that use a Morison’s equation-only
approach, and those with a red dot indicate a second-order PF solution. For LC 2, 3, and 5, the simulation
results are sorted from highest to lowest values.
 In the engineering tools, the forces that affect the motion at the natural frequencies include, among
others, the wave and viscous excitation on a fixed system (modeled in LC 3.3 – Figure 5b) as well as
the radiation and viscous drag associated with a moving structure (modeled in LC 2.1 – Figure 5a). For
LC 2.1, many tools underpredict the force during oscillation, mostly due to an underprediction of
radiation and/or viscous drag (the force component in phase with surge velocity). The higher predictions
are mainly attributed to a higher-valued transverse drag coefficient. The underprediction of the surge
force (Fx) on a fixed structure under wave loading (Figure 5b) is more significant. Figure 3 shows that
the force levels in the low-frequency region for this configuration are small, but they nevertheless can
contribute to large resonant responses. Those modeling approaches that result in a larger value than
others for the fixed-condition surge force are again those that utilize an increased drag coefficient and

 5
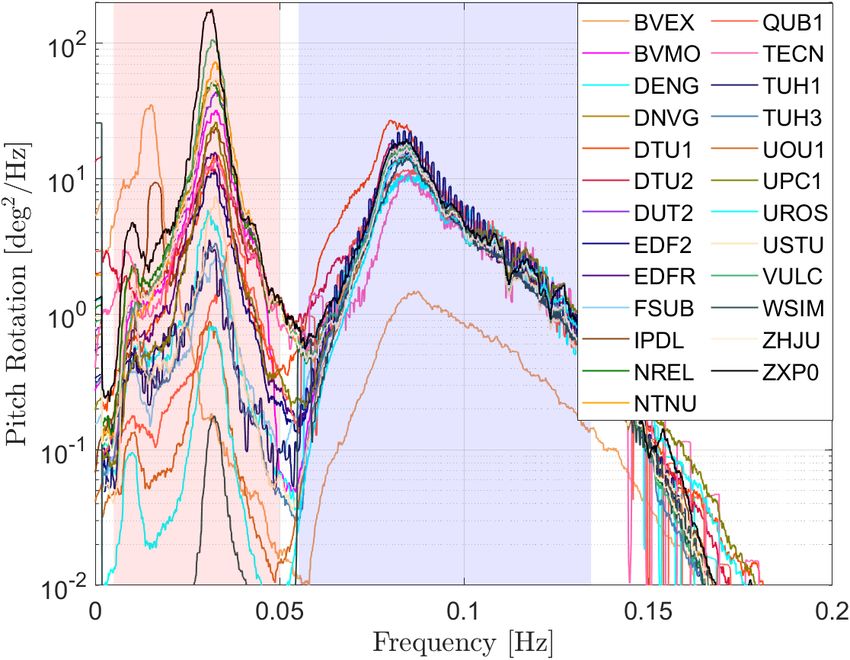
The Science of Making Torque from Wind (TORQUE 2020) IOP Publishing
Journal of Physics: Conference Series 1618 (2020) 032033 doi:10.1088/1742-6596/1618/3/032033

those that incorporate a second-order PF solution. DTU1 is the only Morison-only approach predicting
a large surge force in Figure 5b, likely because of the use of fully nonlinear wave kinematics, which are
not used in other Morison-only models. In the DTU1 model, the measured time series of the free-surface
elevation were band-pass filtered to remove sub- and super-harmonic content to obtain the target “linear”
wave signal at the floater location. A fully nonlinear wave model was then used to furnish the filtered
wavefield with additional nonlinear components. This approach provided the simulation with fully
nonlinear fluid velocity and acceleration of the incident wavefield which likely improved the accuracy
of Morison added-mass and drag forces.

Figure 3. PSD comparison of experimental measurement to simulations for the surge force for LC 3.3
and surge response for LC 5.3.

Figure 4. PSD comparison of experimental measurement to simulations for the pitch moment for LC
3.3 and pitch response for LC 5.3.
 However, larger surge forces in LC 2.1 and LC 3.3 at the low frequencies do not equate to a larger
surge response at the surge natural frequency for LC 5.3. Instead, those that have the largest response
(e.g., TECN, EDFR, TUH3, and USTU) have some of the smallest forces for LC 2.1 and 3.3. To try to
better understand the reason for higher response levels in LC 5.3, one can also look at the behavior of
the model in free decay (LC 4). The linear and quadratic damping, represented by P and Q values [9]
derived from surge-free decay time history of the floating system (LC 4.2), are summarized in Figure
5d and 5e. The large linear damping from the experiment is significantly higher than what PF wave
radiation models would suggest, forcing many participants to add strong external linear damping to the
model that is not flow dependent. TECN, EDFR, TUH1 (same as the TUH3 model), and USTU are
among the exceptions that did not use any additional damping, resulting in negligible linear damping.

 6
The Science of Making Torque from Wind (TORQUE 2020) IOP Publishing
Journal of Physics: Conference Series 1618 (2020) 032033 doi:10.1088/1742-6596/1618/3/032033

Therefore, larger drag coefficients and added damping matrices, while providing a better match for
fixed-condition loads and free-decay characteristics, generally fail to produce better estimation of the
floating response at the surge natural frequency. The resolution of this conflict requires a better
understanding of the source of the large linear damping observed in the experiment. It may come from
the unsteady drag, which might not be quadratic in nature, or from a more complicated mechanism where
viscous effects alter the wave radiation characteristics of the platform. Again, DTU1 stands out by
predicting large surge motion despite the use of external damping and a large drag coefficient. The use
of fully nonlinear wave kinematics likely improved the motion prediction.

 (a) LC 2.1 – Fx for forced surge (b) LC 3.3 – Fx for fixed condition (c) LC 5.3 – Surge motion for
 oscillation under wave loading floating condition

 (d) LC 4.2 – Free surge decay of floating system (e) LC 4.2 – Free surge decay of floating system
 linear damping component (P) quadratic damping component (Q)
Figure 5. Comparison of surge-frequency-related hydrodynamic loads and motion (LC 2.1, 3.3, 5.3, and
4.2). PSD sum in (a) were computed over a frequency range ±10% of the motion frequency. P and Q
shown in (d) and (e) are proportional to the linear and quadratic damping coefficients.
 For PF models, the features that consistently improve the result across load cases are the inclusion of
a QTF from second-order PF solutions and the use of measured waves from the basin. The measured
waves contain some low-frequency components absent from the target wave spectra, creating additional
excitation at low frequencies. To provide an estimate of the contribution from these low-frequency wave
components, the NREL model, which constructed the wavefield using linear superposition based on the
measured waves, was run a second time with low-frequency wave components removed. More
specifically, the original measured waves were filtered by zeroing all frequency components below 0.05
Hz. With the filtered waves as input, the low-frequency PSD sums for surge force and pitch moment
(Figure 5b and 6b) predicted by the NREL model were reduced by 25% and 10%, respectively. In

 7
The Science of Making Torque from Wind (TORQUE 2020) IOP Publishing
Journal of Physics: Conference Series 1618 (2020) 032033 doi:10.1088/1742-6596/1618/3/032033

addition to the use of QTF and measured waves, wave stretching, to a lesser degree, also tends to improve
the result. With Morison-only models, the use of fully nonlinear wave kinematics coupled with large
drag coefficients appears to provide significantly improved predictions for surge force and motion.
 Figure 6 shows the same analysis of the pitch load/response of the floating wind system in irregular
waves. Again, it is shown in Figure 6c that none of the modeling tools are able to predict the low-
frequency response accurately. For LC 2.1 (Figure 6a), the forced oscillation is still in the surge
direction, but the pitch moment (My) is examined. The results here are fairly similar to those observed
for the surge forces. However, for LC 3.3, a different group of models perform better for the pitch
moment. The Morison-only model DTU1 that predicted the surge force well largely underpredict the
pitch moment. This observation also holds for LC 5.3 where no Morison-only model is in the top tier
for response prediction.

 (a) LC 2.1 – My for forced surge (b) LC 3.3 – My for fixed condition (c) LC 5.3 – Pitch motion for
 oscillation under wave loading floating condition

 (d) LC 4.6 – Free pitch decay of floating system (e) LC 4.6 – Free pitch decay of floating system
 linear damping component (P) quadratic damping component (Q)
Figure 6. Comparison of pitch-frequency-related hydrodynamic loads and motion (LC 2.1, 3.3, 5.3,
and 4.6). PSD sum in (a) were computed over a frequency range ±10% of the motion frequency. P
and Q shown in (d) and (e) are proportional to the linear and quadratic damping coefficients.
 The damping characteristics in the pitch direction are also very different than for surge. In surge, the
linear damping dominates over the quadratic. For the pitch direction, however, the linear damping is
much smaller while quadratic damping becomes significant, indicating the importance of viscous drag
across the heave plates. The damping behavior influences the pitch response for LC 5.3. Notice that the
lack of added linear damping no longer produces a larger response in pitch. Otherwise, it is hard to
identify any common components that lead to a larger pitch response other than the two features that are

 8
The Science of Making Torque from Wind (TORQUE 2020) IOP Publishing
Journal of Physics: Conference Series 1618 (2020) 032033 doi:10.1088/1742-6596/1618/3/032033

shown to consistently improve the result across all load cases: the inclusion of a QTF for second-order
PF solutions and the use of measured waves from the basin. It should be noted that DENG, FSUB, and
USTU all use Newman’s approximation instead of the full QTF, which likely caused the low pitch
moment in Figure 6b [4].
 Another approach that has been shown to improve the pitch-moment prediction under some
conditions is to use distinct drag coefficients for different parts of the platform (e.g., see [10]). Since
engineering-level modeling tools do not account for the flow acceleration around the bottom of the
platform, one can tune the drag coefficient to approximate the effect. This modeling approach worked
well for LC 1 where the structure was towed at different velocities and, to a lesser degree, LC 2 with
forced surge oscillation. However, the benefit is not obvious under floating conditions.

4. Conclusions
OC6 Phase I sought to better understand the source of the underprediction of the response of floating
semisubmersibles at their surge and pitch natural frequencies. This underprediction was found to have
a significant impact on the accurate prediction of the ultimate and fatigue loads of floating wind systems.
 As part of the project, a set of experiments was performed to break apart the low-frequency loads to
understand the source of the underprediction. Constrained tests were performed to examine the radiation
and viscous loading under forced surge oscillation, then the diffraction and viscous loading in a fixed
condition under waves. For both test conditions, the modeling tools in general under-predicted both the
surge force and pitch moment, resulting in the underprediction of the floating response at the natural
frequencies.
 For PF models, a few model features were shown to consistently improve the match to experimental
measurements across load cases. First is the inclusion of second-order PF solutions in the form of a QTF
that models the difference-frequency inviscid wave loading on the system. The second component is the
use of measured waves, which contains some lower-frequency content absent from the target wave
spectra. However, without a better understanding of the nature of the measured low-frequency waves, it
is difficult to determine whether the wave nonlinear effect is double counted in this case.
 Morison-only solutions tend to work relatively well in surge, especially when fully nonlinear wave
kinematics are used, but underpredict pitch load and motion at the pitch natural frequency. The use of
fully nonlinear wavefield can be highly beneficial to Morison-only models because it improves the
evaluation of the added-mass component with more accurate flow acceleration. The accuracy of the
drag component may also be improved; however, this is likely less important since the Morison drag,
up to second order, only depends on the first order wavefield velocity.
 Wave stretching also improves the surge predictions, but not pitch. The damping models have a
significant effect on the response of the system. Larger drag coefficients and external damping matrices
lead to larger forces for the constrained configuration that better match the experimental measurements.
Many participants set these damping values based on the free-decay response of the experiment.
However, the increased drag and damping tend to decrease the motion response of the system under
wave excitation, increasing the discrepancy with experiment for these cases. This contradiction seems
to indicate that some flow mechanism is missing from the models that are being used.
 One idea to improve the models is to have a viscous drag coefficient that is frequency and/or
amplitude-dependent; however, that can be difficult to formulate for an irregular sea state where multiple
frequency components with different amplitudes coexist. Furthermore, we observe that in a fixed
condition, the surge force is being underpredicted. Therefore, perhaps the PF QTF itself needs to be
corrected. While the modeling tools based on PF solution have been extensively used by the oil and gas
industry, certain assumptions may be violated with the smaller dimension and larger motion of a floating
wind system.
 A proposed approach is to tune the QTF using either tank-test data or a higher-fidelity modeling tool,
such as computational fluid dynamics (CFD). One difficulty with this approach is that inviscid wave
loading and viscous effects cannot be clearly separated because viscous effects can alter wave radiation
characteristics, especially at small scale. Therefore, should the QTF be tuned based on experiment or
CFD, no Morison drag can be included so as not to double-count viscous drag. Instead, an external
damping matrix can be tuned to capture the free-decay characteristics. Another group within OC6 is

 9
The Science of Making Torque from Wind (TORQUE 2020) IOP Publishing
Journal of Physics: Conference Series 1618 (2020) 032033 doi:10.1088/1742-6596/1618/3/032033

currently working on CFD analysis of the system and investigating how it can be used to better tune the
engineering models, with a focus on understanding the low-frequency excitation using bichromatic
waves. Results from this study are expected in the next year.
 All data and simulation results from the OC6 project can be found after the conclusion of the work
at the website: https://a2e.energy.gov/projects/oc6.

References
[1] Robertson, A., et al. (2017). OC5 Project Phase II: Validation of global loads of the DeepCwind
 floating semisubmersible wind turbine, Energy Procedia, 137, pp. 38-57.
 [DOI: 10.1016/j.egypro.2017.10.333]
[2] Azcona, J., Bouchotrouch, F., and Vittori, F. (2019). Low‐frequency dynamics of a floating wind
 turbine in wave tank–scaled experiments with SiL hybrid method. Wind Energy, 22, pp. 1402-
 1413. [DOI:10.1002/we.2377]
[3] Pegalajar-Jurado, A., Bredmose, H., (2019). Reproduction of slow-drift motions of a floating wind
 turbine using second-order hydrodynamics and Operational Modal Analysis. Marine Structures, 66,
 pp. 178-196. [DOI: 10.1016/j.marstruc.2019.02.008]
[4] Simos, A. N., Ruggeri, F., Watai, R. A., Souto-Iglesias, A., and Lopez-Pavon, C. (2018). Slow-drift
 of a floating wind turbine: An assessment of frequency-domain methods based on model tests.
 Renewable Energy, 116, pp. 133-154. [DOI: 10.1016/j.renene.2017.09.059]
[5] Caillé, F., Bozonnet, P., Perdrizet, T., Poirette, Y., and Melis, C. (2017). Model test and simulation
 comparison for an inclined-leg TLP dedicated to floating wind. Proceedings of the ASME 2017 36th
 International Conference on Ocean, Offshore and Arctic Engineering.
[6] Lemmer, F., et al. (2018). The TripleSpar campaign: Validation of a reduced-order simulation model
 for floating wind turbines. Proceedings of ASME 37th International Conference on Ocean, Offshore
 and Arctic Engineering.
[7] Robertson, A., Bachynski, E., Gueydon, S., Wendt, F., and Schünemann, P. (2020). Total
 experimental uncertainty in hydrodynamic testing of a semisubmersible wind turbine, considering
 numerical propagation of systematic uncertainty, Ocean Engineering, 195, pp. 106605.
 [DOI: 10.1016/j.oceaneng.2019.106605]
[8] Robertson, A., Mucha, P., Wendt, F., and Jonkman, J. (2020). OC6 Phase I definition document.
 NREL Report. [Forthcoming]
[9] Jaouën, F., Koop, A., Vatinel, L. (2019). URANS predictions of low-frequency damping of a LNGC.
 Proceedings of ASME 38th International Conference on Ocean, Offshore and Arctic Engineering.
[10] Berthelsen, P. A., Bachynski, E., Karimirad, M., and Thys, M. (2016). Real-time hybrid model tests
 of a braceless semisubmersible wind turbine. Part III: Calibration of a numerical model. Proceedings
 of ASME 35th International Conference on Ocean, Offshore and Arctic Engineering.

Acknowledgements
The authors would like to acknowledge the support of the MARINET2 project (European Union’s
Horizon 2020 grant agreement 731084), which supplied the tank test time and travel support to
accomplish the testing campaign. The support of MARIN in the preparation, execution of the model-
tests, and the evaluation of the uncertainties was essential for this study. MARIN’s contribution was
partly funded by the Dutch Ministry of Economic Affairs through TKI-ARD funding programs.
 This work was authored in part by the National Renewable Energy Laboratory, operated by Alliance
for Sustainable Energy, LLC, for the U.S. Department of Energy (DOE) under Contract No. DE-AC36-
08GO28308. Funding provided by the U.S. Department of Energy Office of Energy Efficiency and
Renewable Energy Wind Energy Technologies Office. The views expressed in the article do not
necessarily represent the views of the DOE or the U.S. Government. The U.S. Government retains and
the publisher, by accepting the article for publication, acknowledges that the U.S. Government retains a
nonexclusive, paid-up, irrevocable, worldwide license to publish or reproduce the published form of this
work, or allow others to do so, for U.S. Government purposes.

 10
The Science of Making Torque from Wind (TORQUE 2020) IOP Publishing
Journal of Physics: Conference Series 1618 (2020) 032033 doi:10.1088/1742-6596/1618/3/032033

Appendix: Modeling Approach by Participant
 Table A1. Potential Flow-Based Models
 Company BEM Geometry and Axial/Heave
 Waves Transverse Drag Coeff.1 Additional Damping3 Weak Nonlinearities
 Modeling Tool QTF Drag Coeff.1,2
 Bureau Veritas Axial damping on moorings:
 Full geometry LC2: 4.8
BVMO Marine & Offshore (FR) Measured 0.63 (all members) 1.1E5 N/(m/s) Instantaneous position
 Full QTF LC3-5: 5.76
 Opera v0.1 B55 = 9.5E9
 Doris Group No bracing LC2&3: 1.4 (BC), 0.4 (others) LC2&3: 4.8 B11=1.0E5, B33=1.8E5,
DENG Synthesized Instantaneous position
 OrcaFlex v10.3a QTF (Newman’s Approx.) LC4&5: 1.55 (BC), 0.4 (others) LC4&5: 3.0 B55 = 7.5E7
 DNV GL Full geometry Instantaneous position
DNVG Measured 1.55 (BC), 0.325 (others) 3.57 None
 Bladed 4.9.0.21 QTF (no bracing) Excitation phase correction
 Tech. Univ. Denmark Full geometry
DTU2 Measured 1.52 (BC), 0.95 (others) LC3-5: 2.4 B11=4.5E4, B33=2.5E4 Instantaneous position
 HAWC2 12.7 Full QTF
 Dalian Univ. of Tech. Full geometry
DUT2 Measured 1.3 (BC), 0.4 (others) 4.5 None None
 OpenFAST v1.0.0 QTF (no bracing)
 EDF R&D Full geometry LC2&3: 1.32 (BC), 0.44 (others) 4.8 (BC) Nonlinear hydrostatics
EDFR Synthesized None
 DIEGO No QTF LC4&5: 2.0 (BC), 1.5 (others) 4.0 (MC) Instantaneous position
EDF2 Same as EDFR Synthesized Same as EDFR LC4&5: 1.0 (BC), 1.5 (others) Same as EDFR B11=1.0E5, B33=1.0E5 Same as EDFR
 Full geometry
 4Subsea
FSUB Synthesized QTF (no bracing, 1.5 (BC), 0.4 (others) LC3-5: 4.8 None Instantaneous position
 OrcaFlex v10.3
 Newman’s Approx.)
 IFP Energies nouvelles Full geometry
 B11=B22=75000
IPDL PRINCIPIA Measured QTF (no bracing, 1.5 (BC), 0.4 (others) 4.81 Nonlinear hydrostatics
 B44=B55=3.1E7
 DeepLines Wind V5.5.1 diff. freq. only)
 NREL Full geometry
NREL Measured 1.6 (BC), 0.4 (others) 8.2 B11=7.5E4, B55=3.1E7 None
 OpenFAST v1.0.0 Full QTF
 NTNU No bracing B11=1.0E5, B33=1.5E5,
NTNU Measured 0.774 (all members) 2.483 None
 SIMA v.3.6 Full QTF (diff. freq. only) B55=7.5E7
 Queen’s Univ. Belfast Load Case Full geometry
QUB1 0.82 (BC), 0.73 (UC), 0.67 (MC) 0.033 None Instantaneous position
 FlexCom V8.12.1 Dependent No QTF
 Tecnalia Full geometry
TECN Measured 1.6 (BC), 0.35 (others) None None Instantaneous position
 OrcaFlex v10.2c No QTF
 Hamburg Univ. of Tech. No bracing (Pot.-flow 1.25 (BC), 0.48 (UC), Nonlinear hydrostatics
TUH1 Synthesized 4.8 None
 panMARE solved at every time step) 0.44 (MC), 0.5 (bracing) Instantaneous position
TUH3 Same as TUH1 Measured Same as TUH1 Same as TUH1 Same as TUH1 Same as TUH1 Same as TUH1
 Newcastle Univ. Full geometry
UNEW Synthesized 1.0 (bracing), 0.8 (others) 8.0 None None
 DARwind v2.0 No QTF
 Univ. of Ulsan No bracing 0.77 (MC), 0.46 (bracing), B11=7.8E4, B33=5.0E4,
UOU1 Measured 4.8 None
 FAST8 v16 No QTF 0.78 (others) B55=3.0E7
 Univ. Poli. Catalunya No MC and bracing Re-dependent pressure coeff. Nonlinear hydrostatics for
UPC2 Measured 1.29 B11=1.0E5, B55=2.1E4
 FloaWDyn No QTF used instead of drag coeff.. MC+braces only & inst. pos.
 Univ. Stuttgart Full geometry
USTU Measured 0.6 (all members) LC3-5: 10 None None
 SLOW QTF (Newman’s Approx.)
 Vulcain Full geometry B11=7.0E4, Q11=4.0E5,
VULC Measured 1.6 (BC), 0.4 (others) 4.8 None
 OpenFAST Full QTF B55= 5.0E4
 Drag coefficients on mooring
 Sandia National Lab Full geometry
WSIM Measured 4.0 (all members) 7.8 line (0.1m diameter): None
 WEC-Sim No QTF
 1.17 (transverse), 0.05 (axial)
 Zhejiang Univ. Full geometry
ZHJU Measured LC3-5: 1.5 (BC), 0.38 (others) LC3-5: 7.8 B11=5.0E4, B55=3.0E7 None
 OpenFAST v2.2.0 Full QTF
1. UC and BC refer to the Upper Column and Base Column (heave plate) of the three corner columns. MC refers to the central Main Column.
2. Axial/heave drag is only applied on the bottom face of the heave plate or main column. Reference area for the drag coefficient is always the bottom surface area of the
 corresponding member. Unless specified otherwise, axial/heave drag is only applied to the heave plate / base column (BC) of the three corner columns.
3. Units for linear damping coefficients B11 (B33) and B55 are N/(m/s) and Nm/(rad/s), respectively. Unit for quadratic damping coefficient Q11 is N/(m/s)2.

 Table A2. Morison’s Equation-Only Models
 Company Transverse Added Axial/Heave Added Mass Transverse Drag Axial/Heave Additional Weak
 Waves
 Modeling Tool Mass Coeff.1 Coeff.1 Coeff.1 Drag Coeff.1,2 Damping3 Nonlinearities
 Bureau Veritas (FR) 0.63 (all members) 2.6 Nonlinear hydrostatics
 0.61 (UC), 0.68 (BC), 2.4
BVEX Samcef Wind Synthesized MacCamy-Fuchs load Top/bottom of BC, None and F-K forces
 0.56 (MC), 0.63 (bracing) Top/bottom of BC
 Turbines SWT18 model Ref. Vol. 4m × top/bottom area Instantaneous pos.
 Nonlinear hydrostatics
 ClassNK 0.5 (BC), 0.8 (UC), 4.2
CLNK Measured Information not provided 0.4 (UC), 1.38 (BC) B11=1.4E4 and F-K forces
 NK-UTWind 6.0.0 1.5 (bracing) Bottom of BC
 Instantaneous pos.
 Tech. Univ. Denmark LC2: 0.8-0.64 (BC), LC4: 0.69 LC2: 2.2 (BC),
 HAWC2 12.7 0.47-0.72 (others) LC3&5: 0.64 0.5-1.1 (others) LC4: 2.05 B11=5.6E4,
DTU1 with fully nonlinear Measured LC4: 0.52 (all memb.) Bottom of BC LC4: 0.35 (all members) LC3&5: 2.4 B33=3.0E5, Instantaneous pos.
 wave kinematics from LC3&5: 0.25 (BC), Ref. Vol: Equivalent LC3&5: 1.0 (BC), Bottom of BC B55=1.0E10
 OceanWave3D 1.48 (others) hemisphere 1.5 (others)
 0.63 (all members) 1.0
 Fraunhofer IWES 0.61 (UC), 0.68 (BC), 4.8 Nonlinear F-K forces
IWES Synthesized MacCamy-Fuchs load Bottom of BC None
 MoWiT 0.56 (MC), 0.63 (bracing) Bottom of BC Instantaneous pos.
 model Ref. Vol. 4878.05 m3
 0.72
 0.5 (all members) 2.0 B11=6.7E4,
 Univ. Poli. Catalunya Top/bottom of BC, bot. of MC Nonlinear hydrostatics
UPC1 Measured MacCamy-Fuchs load 1.5 (BC), 0.36 (others) Top/bottom of BC B33=8.8E3,
 FloaWDyn Ref. Vol: Equivalent Instantaneous pos.
 model and bottom of MC B55=6.6E7
 hemisphere
 1.540/1.348 Top/Bottom of BC
 Univ. Rostock 4.8
UROS Measured 0.63 (all members) Ref. Vol: Equivalent 1.3 (BC), 0.43 (others) B11=8.0E5 None
 OpenFAST v1.0.0 Top/bottom of BC
 hemisphere
1. UC and BC refer to the Upper Column and Base Column (heave plate) of the three corner columns. MC refers to the central Main Column.
2. Reference areas of axial/heave drag coefficients are the areas of the corresponding faces.
3. Units for linear damping coefficients B11 (B33) and B55 are N/(m/s) and Nm/(rad/s), respectively.

 11
You can also read


