OCBC TREASURY RESEARCH - Commodity Outlook 2021 15 June 2021
←
→
Page content transcription
If your browser does not render page correctly, please read the page content below

OCBC TREASURY RESEARCH
Commodity Outlook 2021
15 June 2021

    Crude Oil
    2021 H2 forecast: $80/bbl Brent
    We see a low possibility of oil returning to $100; instead, we expect it
    to peak at $80, possibly by end 2021, as we see supply from OPEC+
    to return in earnest beginning 2022. The global supply balance is
    expected to stay in deficit through 2021 but may return to a surplus
    by 2022. Contrary to IEA’s latest 2050 net-zero roadmap, we expect
    investments in oil and gas exploration to continue in the near to
    medium term.

    Gold
    2021 H2 forecast: $1,800/oz
    Slowly but surely, we are seeing a tilt to the hawkish camp within
    global central banks. None matters more to gold than what the Fed’s
    stance on rate normalisation would be, but with economic data
    looking relatively robust, the upward pressure on US real interest
    rates could pressure further fund outflows from gold into risky assets.

    Iron Ore
    2021 H2 forecast: $250/mt
    China’s import of iron ore may slow in the next 6-9 months but that
    does not mean its appetite for steel has waned. Its shifting stance
    towards prioritising pollution control mean it wants to encourage a
    more efficient pickup and recycling of domestic steel production i.e
    encouraging less steel exports and importing more foreign scrap
    steel. Once inventories dwindle, however, we expect China to return
    to international markets to replenish its stock.

    Copper
    2021 H2 forecast: $11,000/mt
    Copper remains our top pick for outperformance in 2021 and 2022
    on the back of global electrification and supply disruption in Latin
    America. Unlike iron ore and crude oil, China’s import of copper
    concentrate has continued to stay elevated year-to-date. We
    maintain our view that copper may peak at $12,500/mt, but we bring
    forward that forecast by a year to Q1 2023.

Treasury Research & Strategy                                                   1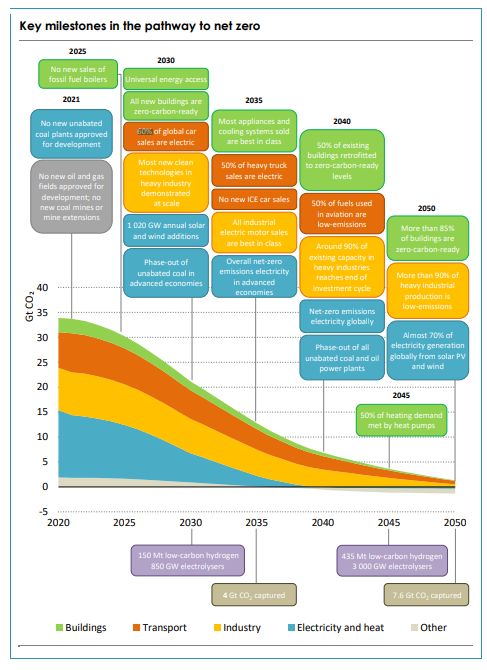
OCBC TREASURY RESEARCH
Commodity Outlook 2021
15 June 2021

    Soybeans
    2021 forecast: $12/bu
    Weather concerns have ebbed in the US following recent rains and
    Brazil looks set to produce another bumper crop. While the US
    balance sheet remains tight, Brazil’s supply crunch is expected to
    ease. Overall, the stock situation in 2021/22 is expected to be more
    expansive than the current crop year, meaning we may see more
    downside than upside for soybeans from here.

    Cotton
    2021 forecast: 80c/Ib
    US cotton exports are expected to retain its steady pace through
    next season but that is offset by higher production. The planting
    pace, soil moisture and even crop conditions are all hovering around
    the 5Y average – meaning any drive higher in prices would have to
    come from increased demand, which we see as unlikely given the
    already robust pace. We see little change to prices in 2021/22.

    Palm
    2021 forecast: 3,800 MYR/mt
    We continue to expect MPOB ending stock to trend below 2mil tons
    through 2021, fuelled by continued supply disruptions due to
    Malaysia’s Covid situation as well as the increasing need to replenish
    vegoil stocks in China and India. The broad decline in the soybean
    complex, however, may cap further gains in palm.

 Howie Lee
 Economist
 +65 6530 1778
 Howielee@ocbc.com

Treasury Research & Strategy                                                 2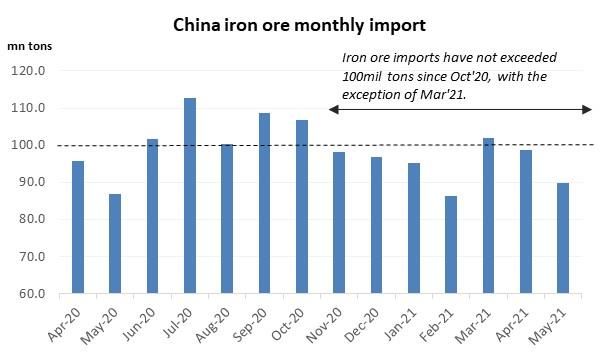
OCBC TREASURY RESEARCH
Commodity Outlook 2021
15 June 2021

OCBC Commodity Price Forecasts
                                                                                OCBC COMMODITY FORECAST
Accurate as of 15 Jun 2021                                             2021                                         2022                                        2023
                              3Y AVG     Spot          Q1      Q2      Q3        Q4      Average    Q1      Q2      Q3       Q4      Average    Q1      Q2      Q3       Q4      Average
Energy
WTI ($/bbl)                         54            71      59      70       72       78         70      72      72       68      68         70      62      62       62      62         62
Brent ($/bbl)                       60            73      63      72       75       80         73      75      75       70      70         73      65      65       65      65         65
Gasoline ($/gallon)               1.61          2.20    1.95    2.25     2.50     2.50       2.30    3.00    3.00     3.00    3.00       3.00    2.75    2.75     2.50    2.50       2.63
Natural Gas ($/mmbtu)             2.58          3.30    2.60    3.25     3.30     3.40       3.14    3.50    3.50     3.50    3.50       3.50    4.00    4.00     4.00    4.00       4.00
Precious Metals
Gold ($/oz)                       1478          1864    1685    1850     1850     1800      1796     1750    1700     1650    1600      1675     1550    1500     1500    1500      1513
Silver ($/oz)                     17.5          28.0    24.4    27.2     26.4     25.7      25.9     25.0    24.3     23.6    22.9      23.9     20.7    20.0     20.0    20.0      20.2
Soft Commodities
Crude Palm Oil (MYR/MT)           2418          3375    3612    3500     3800     3800      3678     3500    3300     3250    3250      3325     3000    3000     2800    2800      2900
Soybean (c/bu) (1st Active)        925          1478    1436    1600     1300     1200      1384     1200    1200     1000    1000      1100     1000    1000     9500    9000      5125
Cotton (c/Ib) (1st Active)          71            85      81      85       82       80        82       77      75       70      70        73       70      70       70      70        70
Industrials & Metals
Iron Ore ($/mt)                     90        211        155     200      220      250     206.25     250     225      200     200     218.75     150     150      125     125     137.5
Copper ($/mt)                     6254      10004       8786   10000    10500    11000    10071.5   11250   11500    11750   12000      11625   12500   12000    12000   12000     12125

Treasury Research & Strategy                                                                                                 3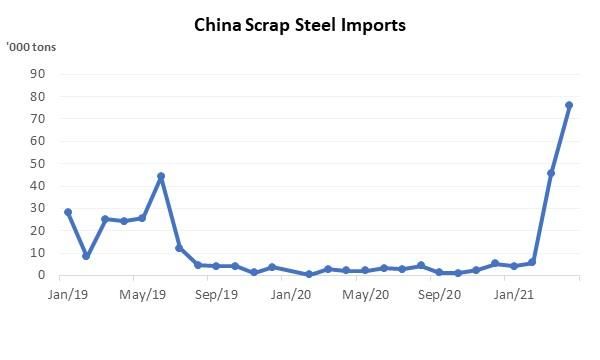
OCBC TREASURY RESEARCH
Commodity Outlook 2021
15 June 2021

                               Crude Oil
                               Highlights
                               ▪ While we expect the global supply balance to remain in deficit through
                                2021, we see it flipping back into a mild surplus by 2022.
                               ▪ Biden’s push for clean energy has a negative impact on oil in the long-
                                run; however, current environmental restrictions have capped US shale
                                production and kept prices supported.
                               ▪ Contrary to the US IEA’s 2060 net-zero report, while we expect
                                investment in O&G explorations to begin shrinking, this is unlikely to
                                decline to zero from 2022.
                               Price Outlook: We expect Brent to peak at $80 by year-end, before
                               normalising towards $65 across two years beginning 2022.
                               US production curtailed with Biden’s appointment.
                               A lot has been said about the impending demise of fossil fuels. We have
                               little doubt that the shift to a global green economy may mean peak oil
                               demand is near, and the effects of this unmistaken shift has profound
                               impacts on US oil production and investments in exploration projects. That
                               is, however, the future. The present reality, especially with the gradual end
                               of the pandemic, means oil is still very much at the forefront of energy
                               markets.
                               Ironically, President Biden’s campaign for clean energy is keeping oil prices
                               supported at present. Despite WTI prices having already recovered above
                               pre-pandemic levels, the rig count and frac spread count in the US have
                               only recovered 37% and 64% of last year’s shut-ins. As the world’s marginal
                               producer of oil, oil prices are the single biggest determinant in influencing
                               oil production in the US. The fact that prices have already recovered to
                               2018 levels but US production has remained stagnant at 11mbpd suggests
                               an external force is at play. We allude this development to the growing
                               uncertainty and environmental regulations that have prevented US shale
                               frackers from returning to the market en masse.

Treasury Research & Strategy                                                                              4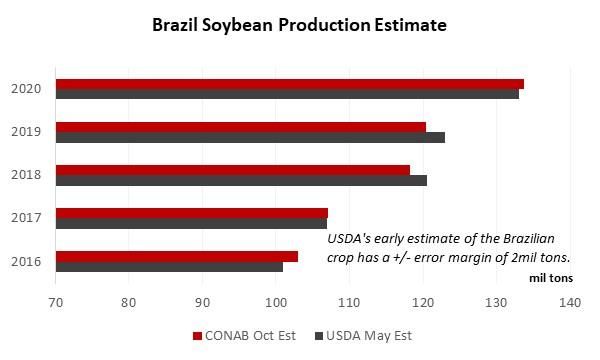
OCBC TREASURY RESEARCH
Commodity Outlook 2021
15 June 2021

                               Source: Baker Hughes, Bloomberg, OCBC

                               OPEC+ unlikely to reopen all its taps for now.
                               July 2021 will see the last of OPEC+’s plans to ease its pandemic supply
                               curbs, with production to increase a total of 850kbpd. Despite that increase,
                               the total output level of OPEC+ is still 6mbpd below its Oct’18 baseline. This
                               is almost thrice that of the 2.1mbpd the bloc enacted in response to the US-
                               China trade war – in place until the brief oil price war in Mar’20. Our base
                               case is for global supply to increase by 2mbpd by end 2022, of which largely
                               from OPEC+ and Iran. Should Iran’s oil embargo be lifted in the next 18
                               months, we expect 2mbpd of Iranian crude to return to international
                               waters, in which case we expect OPEC+ to keep constant its 6mbpd output
                               cut through 2022.
                               In that scenario, we estimate that global supply balance of crude oil will
                               return to surplus beginning Q1 2022 and likely to remain so through the
                               rest of next year. We see Brent peaking at $80 by end 2021, but the flip in
                               the global supply balance from deficit to surplus next year means Brent may
                               begin its retracement next year towards its long-term average price of $65.

                               Source: EIA, OCBC Estimates

                               End of oil and gas investment does not happen overnight.
                               The US IEA raised many eyebrows in its Net Zero 2050 report, stating
                               “beyond projects already committed as of 2021, there are no new oil and
                               gas fields approved for development in our pathway”. Saudi Arabia has
                               called that roadmap “a sequel of the La La Land movie” while Russia termed
                               that projection “simplistic” and “unrealistic”.

                               What the IEA was really trying to drive at was not a call for zero oil and gas
                               exploration projects beginning next year, but one of the many factors

Treasury Research & Strategy                                                                               5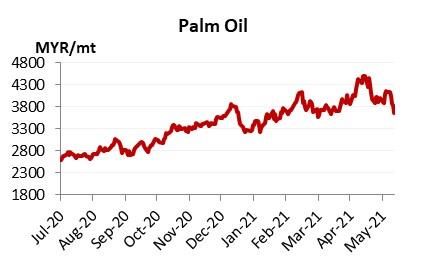
OCBC TREASURY RESEARCH
Commodity Outlook 2021
15 June 2021

                               needed if the US is to achieve its net zero pathway by 2050. We see this
                               development as being possible, but highly challenging – a notion that the
                               IEA also recognises. Firstly, an “unparalleled clean energy investment
                               boom”, estimated to be around $5 trillion by 2030 – would be needed. This
                               is thrice the total investment into this space between 2016-2020. Beyond
                               the question on how this investment would be funded, such a huge flow of
                               investment funds would also create unnecessary diminishing returns on
                               investment, consumer inflationary pressures and a crowding out of private
                               investments in other parts of the economy.
                               Secondly, the IEA predicts the total market size of critical materials like
                               copper, cobalt and manganese to increase 7-fold in the next ten years – a
                               CAGR of 95.1%. It also expects 60% of global car sales to be electric by 2030
                               from the current 4.2% - an average of a 5pct point increase each year. For
                               perspective, it took the world almost five years to see that same increase.
                               The scenarios laid out look highly challenging and while we expect
                               investment in oil and gas explorations to slowly dwindle as the push for a
                               green world gathers pace, we do not expect 2021 to be the year in which
                               we see the last of such investments.

                               Source: US IEA ‘Net Zero 2050’ report

Treasury Research & Strategy                                                                              6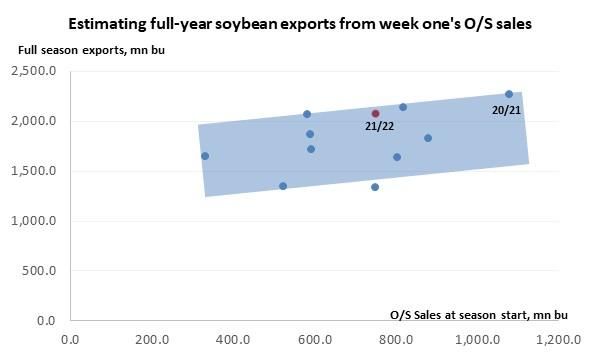
OCBC TREASURY RESEARCH
Commodity Outlook 2021
15 June 2021

                               Iron Ore
                               Highlights
                               ▪ China is shifting towards a green economy and in doing so, is
                                encouraging more domestic steel consumption over steel exports.
                               ▪ Focus from steel producers in the near-term will likely be to draw down
                                on existing iron ore stock and sell steel to domestic buyers.
                               ▪ China’s infrastructure plan will continue to require construction
                                materials; demand for iron ore and steel will likely stay robust beyond
                                2021.
                               ▪ Chinese buyers will look to replenish iron ore inventories once again in
                                2022 as current stockpiles deplete.
                               Price Outlook: Subdued prices in the next six months may be expected as a
                               result of active government intervention, but may test $250/mt when
                               Chinese buyers look to replenish depleted stockpiles.

                               China’s shift in import strategy to complement green economy.
                               China’s pace of iron ore imports year to-date has been generally slower
                               than what was observed in H2 2020. This is not due to weakening
                               consumption patterns for raw materials, but rather a shift in government
                               policy as it attempts to reduce carbon emissions as outlined in its 14th five-
                               year plan in Nov’20.

                               With the exception of Mar’21, iron ore imports into China each month have
                               not exceeded 100 million tons since Oct’20. The crux of this decline lies
                               with China’s push for net carbon neutrality by 2060 and reducing carbon
                               emissions per unit of GDP by 18% from now till 2025. Aluminium and steel
                               are the two highest energy consumption markets among the commodity
                               space and have hence attracted the most attention from policy makers.

Treasury Research & Strategy                                                                               7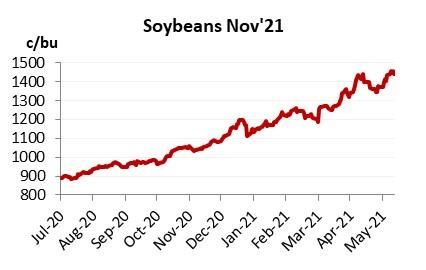
OCBC TREASURY RESEARCH
Commodity Outlook 2021
15 June 2021

                               Source: Bloomberg, China Customs General Administration, OCBC

                               China may continue to restrict output from steel mills while encouraging
                               less steel exports vis-à-vis domestic consumption.
                               The key changes that we continue to expect are the encouragement of a)
                               more scrap steel imports; b) higher domestic consumption of steel vis-à-vis
                               export market sales. There has been a noticeable increase in scrap steel
                               imports lately, with April’s imports totalling 76.25k tons – more than twice
                               the total scrap steel imports China managed in the entire of 2020. Removal
                               of the 15% VAT rebate on steel exports in May have also resulted in a sharp
                               decline of steel exports to 5.27million tons in May, which is about 5.5% of
                               total crude steel production by our estimates – a sharp reversal of the
                               upward trend in steel exports pertinent since Aug’20.

                               Source: Bloomberg, China Customs General Administration, OCBC Estimates

                               Source: Bloomberg, China Customs General Administration, OCBC

Treasury Research & Strategy                                                                             8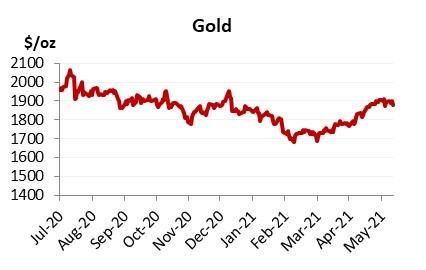
OCBC TREASURY RESEARCH
Commodity Outlook 2021
15 June 2021

                               In short, we expect China to import less iron ore while encouraging a
                               higher recycling rate of steel domestically, via reduced steel exports and
                               higher foreign scrap steel purchases.

                               Low iron ore imports do not equate low steel demand.
                               The low iron ore imports into China, in our opinion, is not an indication of
                               declining steel demand. We see steel demand remaining supported,
                               evident by the record high crude steel output and elevated pig iron
                               production in recent months. China’s ‘new infrastructure’ plan – developing
                               technology parks, electric vehicle (EV) charging points, data centres, ultra
                               high voltage (UHV) power transmission lines, and the development of high
                               speed rail – all require higher steel output on a sustained basis. Iron ore
                               imports may remain low in the next 6-9 months as steel mills draw down on
                               existing inventories and sell an increasing share of its steel production to
                               local end-users. As iron ore inventories continue to dwindle, however, we
                               expect China to return for iron ore to replenish stockpiles and feed its
                               domestic appetite for steel.

                               Source: Bloomberg, China Customs General Administration, OCBC Estimates

                               Price outlook: Iron ore to continue inching towards $250 by year-end.
                               We expect iron ore prices to remain supported in the near-term, and
                               eventually test a high of $250 before the end of the year.

Treasury Research & Strategy                                                                             9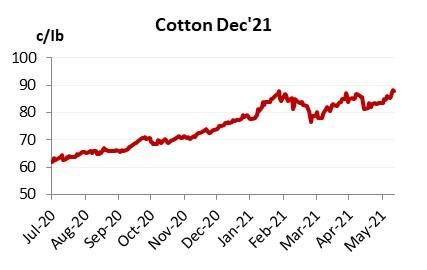
OCBC TREASURY RESEARCH
Commodity Outlook 2021
15 June 2021

                               Soybeans
                               Highlights
                               ▪ China’s purchases of US new crop have been slow; we estimate
                                outstanding sales to begin new crop year 2021/22 at only 775mn bu.
                               ▪ US production is not expected to see much upside, given the current
                                crop condition of 70 is close to the 5-year high of 85.
                               ▪ With Brazil expected to produce yet another record crop in 2021/22
                                (144mn tons), the combined US + Brazil ending stock should see an
                                easing of tightness.
                               Price Outlook: We think soybean prices may have peaked and may begin
                               retracing back towards $12/bu. The stock-to-use of US and Brazil, however,
                               remains tight and we do not expect prices to decline below $10/bu.

                               US production not expected to see much further upside.
                               USDA released its first soybean crop condition for new crop 2021/22 in
                               early June. At time of writing, the new crop has a current Crop Condition
                               Index (CCI) score of 70 , according to our calculations. This index has a
                               historical range of 55 to 85 in the past ten years. With the persistently poor
                               soil moisture year to date, we do not expect the crop condition to continue
                               persisting at the higher end of its historical range in the coming weeks and
                               to possibly decline towards the long-term average of 65.
                               We estimate that with the current CCI score of 70, the US should see a
                               planted yield of 50.00 – not far from USDA’s current estimate of 50.29.
                               Further upside in yields, however, may prove to be challenging. As
                               mentioned, the maximum CCI the US has ever recorded in the past ten
                               years is 85 – assuming planted acreage remains at the current 87.6 million
                               hectares, even with the improved crop condition to 85, the incremental
                               production from the US would only be 120 million bushels more against the
                               current USDA estimate of 4.4bn bu.

                                     2021/22 US Soybean Est.
                                     Crop Cond.           70
                                     Est Yield        49.99
                                     USDA Yield       50.29
                                     Acreage            87.6
                                     Est Prod          4379
                                     USDA Prod         4405

                               Source: USDA, OCBC Estimates

Treasury Research & Strategy                                                                              10
OCBC TREASURY RESEARCH
Commodity Outlook 2021
15 June 2021
US soybean exports look suspect and likely to disappoint.
USDA expects 2.08bn bushels of US exports in the upcoming 2021/22
season, which is on the higher end of our estimate range. New soybean
sales have so far looked a pale shadow of what was seen last year. We
estimate new crop orders to end this season at 750mn bushels, while
rollover of existing crop sales to be minimal at about 25mn bushels – which
means 2021/22 outstanding sales will likely begin the new season at 775mn
bushels. This is considerably lower than the 1.1bn bushels that 2020/21
started with.
We estimate that full-year 2021/22 US soybean exports will be in a broad
range of 1.5bn bushels to 2.1bn bushels. USDA’s current estimate of 2.08bn
bu, however, is right at the top end of this range and we see scope for
further downward revision, possibly to 1.9bn bu. Given adequate stock
levels of soymeal and soybeans in China at present, the slowing pace of
bean purchases is a growing possibility.
Source: USDA, OCBC Estimates
Our US Supply & Demand estimates.
We forecast US production at 4.28bn bu and US exports at 1.90bn bu,
which will yield an ending stock of 205mil bu. This will be a slight
improvement from last year’s stock tightness of 135mn bu but remains very
tight – especially with a stock-to-use ratio of 4.8%. We hence expect
2021/22 prices to remain above $10/bu, but a new record high is unlikely in
our opinion. The higher ending stock situation puts us on a bearish slant
towards new crop soybeans, and we see delivery on the Mar’22 contract to
end the year at $12/bu.
Treasury Research & Strategy 11OCBC TREASURY RESEARCH
Commodity Outlook 2021
15 June 2021
2016 2017 2018 2019 2020 OCBC
United States 2016/2017 2017/2018 2018/2019 2019/2020 2020/2021 2021/22
Beginning Stocks 197 302 438 909 525 135
Production 4296 4412 4428 3552 4135 4280
Imports 22 22 14 15 35 20
Total Supply 4515 4735 4880 4476 4695 4435
Exports 2167 2134 1752 1682 2280 1900
Crush 1901 2055 2092 2165 2175 2225
Food Use Dom. Cons. 0 0 0 0 0 0
Feed Waste Dom. Cons. 146 108 128 105 106 105
Total Demand 4214 4297 3971 3952 4561 4230
Ending Stocks 302 438 909 523 135 205
Stock to Use % 7.2% 10.2% 22.9% 13.2% 3.0% 4.8%
Source: USDA, OCBC Estimates
Brazil stock tightness unlikely to drop further next year.
USDA’s June World Agriculture Supply and Demand Estimate (WASDE)
estimates the new Brazilian 2021/22 crop production at 144mn tons (5.3bn
bu). Although the first CONAB (Companhia Nacional de Abastecimento –
Brazil’s government food supply statistics agency) estimate isn’t out until
October, the early estimate from USDA normally serves as a reliable
estimator of the October CONAB soybean production figure. In the last five
years, the maximum deviation of the October CONAB production estimate
from USDA’s June WASDE is +/- 2.5mn tons (~+/- 90mn bu), which means
the CONAB estimate for 2021/22 is likely to come in within a range of 5.2-
5.4bn bu. Of course, thereafter the production estimates will be heavily
weather dependent.
Even at the lower range of 5.2bn bu, Brazil’s ending stock is estimated at
about 800mn bu – just slightly lower than this year’s 850mn bu. The upside
production surprise, on the other hand, would drive the ending stock close
to the psychological 1bn bu level, which may trigger further selling if
CONAB estimates eventually edge towards said level.
Treasury Research & Strategy 12OCBC TREASURY RESEARCH
Commodity Outlook 2021
15 June 2021
Source: Bloomberg, CONAB, USDA, OCBC
Conclusion:
On a US and Brazil combined basis, the base case is for total ending stocks
to exceed 1bn bu, although it will still be materially lower than the 5Y
average of 1.5bn bu primarily due to US stock tightness. With rising
prospects of an easing stock to use ratio on a US + Brazil combined basis,
we do not expect 2021/22 crop prices to reach the heights of the previous
season. Hence, we see limited upside gains for the soy complex and expect
prices to end 2021 at $12/bu.
OCBC Est
US + Brazil 2015/2016 2016/2017 2017/2018 2018/2019 2019/2020 2020/2021 2021/22
Beginning Stocks 1088 1048 1482 1639 2102 1287 982
Production 7473 8518 8946 8826 8273 9169 9645
Imports 39 32 28 19 36 61 44
Total Supply 8599 9597 10456 10485 10411 10517 10670
Exports 3941 4486 4931 4503 5068 5440 5317
Crush 3347 3386 3679 3655 3855 3893 3978
Food Use Dom. Cons. 0 0 0 0 0 0 0
Feed Waste Dom. Cons. 213 244 206 225 203 203 202
Total Demand 7500 8116 8816 8383 9125 9536 9497
Ending Stocks 1099 1522 1639 2102 1285 982 1173
Stock to Use % 14.7% 18.8% 18.6% 25.1% 14.1% 10.3% 12.3%
Source: USDA, OCBC Estimates
Treasury Research & Strategy 13OCBC TREASURY RESEARCH
Commodity Outlook 2021
15 June 2021
Gold
Highlights
▪ Gold is in a state of flux, having declined in Q1 to $1700, only to recover
all its losses in April and May.
▪ Gold ETFs recorded its first meaningful fund inflows in May, but this is
not likely to persist beyond Q2.
▪ As real rates continue to rise, that is likely to pressure gold prices lower.
▪ We remain bearish on gold through this year and next.
Price Outlook: We think gold has topped at $1900 and is likely to end the
year around $1800. Gold may reach its terminal steady state price of $1500
by end 2022.
Gold in a state of flux.
Gold declined in the first three months of 2021, and then retraced all its
losses in April and May. The initial decline was premised on a recovering
economy, while its inflation-hedging appeal seemingly was overlooked in
favour of raw commodity investing and (debatably) cryptocurrencies.
Gold’s rise in Q2 came on the back of rising inflation expectations and an
uncertain macro environment due to the Covid resurgence in Asia,
alongside some big misses in US nonfarm payrolls. 10Y Treasury real yields
fell from -0.63% in early April to a low of -0.93% in mid-May –
correspondingly, gold rose about 8.8% in this period. Since mid-May,
however, 10Y real yields have been stuck largely in a range of -0.80% to -
0.90%, which has capped any further advance in gold.
Source: Bloomberg, OCBC
Treasury Research & Strategy 14OCBC TREASURY RESEARCH
Commodity Outlook 2021
15 June 2021
Gold may have topped at $1900.
With the recent disappointment in US labour market data, inflation
expectations have started to edge lower. The FOMC minutes in May also
showed, for the first time, the willingness by officials to begin tapering
discussions in the near future, which has further put a lid on the rise in US
10Y breakeven yields. The shift downward in both nominal yields (as a
result of the soft US labour market) and breakeven yields (due to falling
inflation expectations) mean real yields are likely to continue trading within
range for now. Our rates strategist expects that US real yields may find a
bottom at -1.0% in the near term and slowly rise towards -0.6% by end-
2021. This suggests that gold, which typically moves in opposite correlation
to real yields, may have found a top at its current level of $1900.
Source: Bloomberg, US Bureau of Labor Statistics, OCBC
Gold trading too rich by our valuation.
Our valuation of gold at present suggests a fair value range of $1750-$1850.
We expect gold to end at $1800 by end 2021 as the global vaccination drive
gathers pace while the Fed turns increasingly less dovish on its monetary
stance, driving real rates higher and in turn pushing gold prices down. Our
estimation of gold’s terminal steady state remains at $1500, which we think
the precious metal may retrace to by end 2022.
Treasury Research & Strategy 15OCBC TREASURY RESEARCH
Commodity Outlook 2021
15 June 2021
ETF inflows in May unlikely to persist.
Despite the rally in gold price in April, we noted that there was still a net
outflow on gold ETF funds. Particularly, since Nov’20, gold has been
experiencing mostly fund outflows, with the inflows in Jan’21 almost
minimal. Therefore, although we note that total gold ETF holdings rose
1.58mil oz in May’21, we think this trend is unlikely to persist, especially
with the weak start gold prices have shown in June to-date.
Source: Bloomberg, OCBC
Treasury Research & Strategy 16OCBC TREASURY RESEARCH Commodity Outlook 2021 15 June 2021 Treasury Research & Strategy Macro Research Selena Ling Tommy Xie Dongming Wellian Wiranto Howie Lee Head of Research & Strategy Head of Greater China Research Malaysia & Indonesia Thailand & Commodities LingSSSelena@ocbc.com XieD@ocbc.com WellianWiranto@ocbc.com HowieLee@ocbc.com Carie Li Herbert Wong Hong Kong & Macau Hong Kong & Macau carierli@ocbcwh.com herberthtwong@ocbcwh.com FX/Rates Strategy Frances Cheung Terence Wu Rates Strategist FX Strategist FrancesCheung@ocbc.com TerenceWu@ocbc.com Credit Research Andrew Wong Ezien Hoo Wong Hong Wei Seow Zhi Qi Credit Research Analyst Credit Research Analyst Credit Research Analyst Credit Research Analyst WongVKAM@ocbc.com EzienHoo@ocbc.com WongHongWei@ocbc.com ZhiQiSeow@ocbc.com This publication is solely for information purposes only and may not be published, circulated, reproduced or distributed in whole or in part to any other person without our prior written consent. This publication should not be construed as an offer or solic itation for the subscription, purchase or sale of the securities/instruments mentioned herein. Any forecast on the economy, stock market, bond market and economic trends of the markets provided is not necessarily indicative of the future or likely performance of the securities/instruments. Whilst the information contained herein has been compiled from sources believed to be reliable and we have taken all reasonable care to ensure that the information contained in this publication is not untrue or misleading at the time of publication, we cannot guarantee and we make no representation as to its accuracy or completeness, and you should not act on it without first independently verifying its contents. The securities/instruments mentioned in this publication may not be suitable for investment by all investors. Any opinion or estimate contained in this report is subject to change without notice. We have not given any consideration to and we have not made any investigation of the investment objectives, financial si tuation or particular needs of the recipient or any class of persons, and accordingly, no warranty whatsoever is given and no liability whatsoever is accepted for any loss arising whether directly or indirectly as a result of the recipient or any class of persons acting on such information or opinion or estimate. This publication may cover a wide range of topics and is not intended to be a comprehensive study or to provide any recommendation or advice on personal investing or financial planning. Accordingly, they should not be relied on or treated as a substitute for specific advice concerning individual situations. Please seek advice from a financial adviser regarding the suitability of any investment product taking into account your specific investment objectives, financial situation or particular needs before you make a commitment to purchase the investment product. OCBC Bank, its related companies, their respective directors and/or employees (collectively “Related Persons”) may or might have in the future interests in the investment products or the issuers mentioned herein. Such interests include effecting transactions in such investment products, and providing broking, investment banking and other financial services to such issuers. OCBC Bank and its Related Persons may also be related to, and receive fees from, providers of such investment products. This report is intended for your sole use and information. By accepting this report, you agree that you shall not share, communicate, distribute, deliver a copy of or otherwise disclose in any way all or any part of this report or any information contained herein (such report, part thereof and information, “Relevant Materials”) to any person or entity (including, without limitation, any overseas office, affiliate, parent entity, subsidiary entity or related entity) (any such person or entity, a “Relevant Entity”) in breach of any law, rule, regulation, guidance or similar. In particular, you agree not to share, communicate, distribute, deliver or otherwise disclose any Relevant Materials to any Relevant Entity that is subject to the Markets in Financial Instruments Directive (2014/65/EU) (“MiFID”) and the EU’s Markets in Financial Instruments Regulation (600/2014) (“MiFIR”) (together referred to as “MiFID II”), or any part thereof, as implemented in any jurisdiction. No member of the OCBC Group shall be liable or responsible for the compliance by you or any Relevant Entity with any law, rule, regulation, guidance or similar (including, without limitation, MiFID II, as implemented in any jurisdiction). Co.Reg.no.:193200032W Treasury Research & Strategy 17
You can also read