OCEAN FREIGHT MARKET UPDATE - DHL

Page created by Arnold Ward
 
CONTINUE READING
OCEAN FREIGHT MARKET UPDATE - DHL
PUBLIC

DHL Global Forwarding, Freight

OCEAN FREIGHT
MARKET UPDATE
February 2019
Publication Date 30th January 2019

                                          1
OCEAN FREIGHT MARKET UPDATE - DHL
PUBLIC

Contents

    TOPIC OF THE MONTH
    Top 12 carrier’s 2019 capacity expansion plans

    HIGH LEVEL DEVELOPMENT

    MARKET OUTLOOK
    Freight Rates and Volume Development

    ECONOMIC OUTLOOK & DEMAND DEVELOPMENT

    CAPACITY DEVELOPMENT

    CARRIERS

    REGULATIONS

    DID YOU KNOW?
?   Top 15 container ports

                                                     DHL Global Forwarding | OFR Market Update | Feb 2019        2
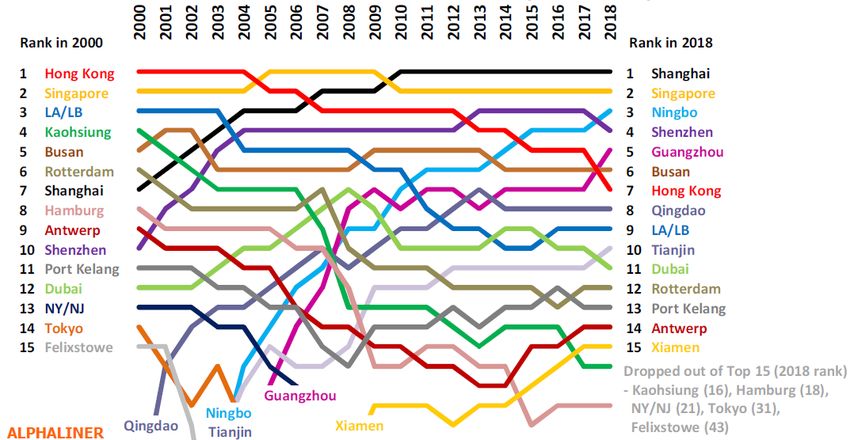
OCEAN FREIGHT MARKET UPDATE - DHL
Topic of the Month
Top 12 carrier’s 2019 capacity expansion plans
Top 12 Carriers : Scheduled Newbuilding Deliveries in 2019
                                                                 MSC has the largest newbuilding pipeline of all carriers this year, with some 20 orders,
                                                                 aggregating a total capacity of 334,550 TEU. The carrier’s orderbook includes 8 megamax
                                                                 units of 23,000 TEU, with 8 deliveries of such vessels expected for the 2 nd half of the year. All of
                                                                 the megamax units are destined for the Asia-North Europe route, although no new string is
                                                                 expected to be launched this year, as the 2M partners (Maersk/MSC) have announced the
                                                                 extension of the rotation of six Asia-Europe strings that should take up some of these ships. The
                                                                 newbuildings are also expected to cover for some of the existing ships in MSC’s fleet that will go
                                                                 out of service for weeks or months for scrubber retrofitting in the 2 nd half of this year. In addition to
                                                                 its substantial new ship pipeline, MSC is expected to launch a vessel jumboisation program
                                                                 this year.

                                                                 COSCO Shipping has the second largest vessel orderbook in 2019, with 12 units and a total
                                                                 capacity of 180,970 TEU. Most of the ships are expected to be delivered in the 1st half of the
year. Notably, another 6 19,200 – 21,200 TEU units will complete COSCO Group’s current ‘megamax’ vessel program. The 6 new megamaxes are expected to
join the OCEAN Alliance’s Far East – North Europe ‘NEU3/AEU7’ loop, replacing ships of 13,000 – 14,000 TEU.

Evergreen has an orderbook of 10 ships in 2019, including 6 G-class 20,388 TEU units. The first 2 G-class megamax units will be assigned to the Asia – North
Europe CEM service, which is currently being upgraded from the 13,800-14,000 TEU size to the 20’000 TEU scale. The remaining G-class units are expected to
follow onto the same service later this year. Evergreen is also expected to launch a jumboisation program for some of its 8,500 units later this year.

Hapag-Lloyd, ZIM and Wan Hai have no new ships due for delivery in 2019. All 3 carriers will have to rely on the charter market for any capacity expansion this
year. This counts also for carrier HMM. It’s newbuilding program includes 12 ships of 23,000 TEU and 8 units of 15,000 TEU, but this will only be delivered in the
2nd quarter of 2020 and 2021 respectively.
                                                                                                                                                               Source: Alphaliner

                                                                                                          DHL Global Forwarding | OFR Market Update | Feb 2019                 3
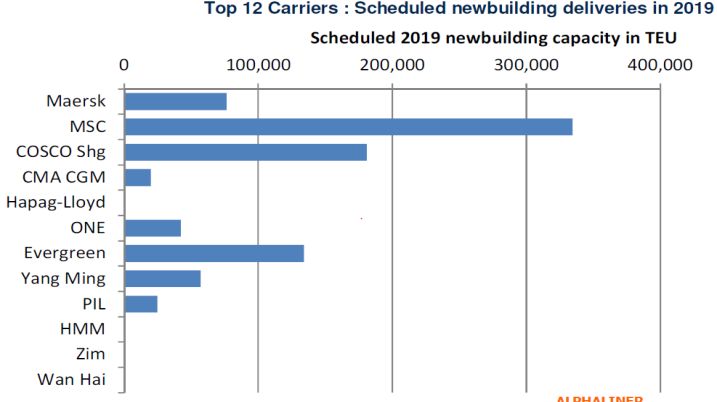
OCEAN FREIGHT MARKET UPDATE - DHL
PUBLIC

   High Level Market Development – Supply and Demand

 ECONOMIC OUTLOOK GDP GROWTH BY REGION1)                                                               DHL TRADE BAROMETER6)                                                                                 SUPPLY/DEMAND
                                                                                                                                                                                                             SUPPLY/DEMANDGROWTH
                                                                                                                                                                                                                           GROWTH(ANNUALIZED),
                                                                                                                                                                                                                                  (ANNUALIZED), IN % 2)2)
                                                                                                                                                                                                                                                 IN%
                                                                                                            75
                                                                                                                                                                                                           7%
                                                                                    CAGR                    70
                     2018F 2019F 2020F 2021F 2022F                                                                                                                                                         6%
                                                                                  (2019-22)                 65
                                                                                                           60                                                                                              5% Demand
EURO                    2.1%       1.6%       1.5%        1.5%       1.7%           1.6%                                                                                                                      Growth
                                                                                                            55                                                                                             4%   %
MEA                     2.9%       3.1%       3.4%        3.3%       3.3%           3.3%
                                                                                                            50                                                                                             3%
AMER                    2.6%       2.6%       2.1%        1.8%       1.8%           2.1%
                                                                                                            45                                                                         Ocean               2%
ASPA                    4.9%       4.7%       4.5%        4.7%       4.7%           4.7%                   40                                                                                                         Supply
                                                                                                                                                                                       Global              1%
                                                                                                            35                                                                                                       Growth %
DGF World               3.3%       3.1%       2.9%        2.8%       2.9%            2.9%                  30
                                                                                                                                                                                                           0%
                                                                                                                                                                                                                      2016        2017       2018F        2019F       2020F        2021F       2022F
                                                                                                                 Q1    Q2    Q3      Q4    Q1      Q2    Q3     Q4     Q1    Q2       Q3     Q4
                                                                                                                 ’16                       ’17                         ’18

 WORLD CONTAINER INDEX (WCI)3)                                                                        SHANGHAI CONTAINERIZED FREIGHT INDEX (SCFI)4)                                                            BUNKER PRICE INDEX5)
    3,000                                                                                               1,200                                                                                                   1,000
                                                                                                        1,100
    2,500                                                                                                                                                                                                         800
                                                                                                        1,000
    2,000
                                                                                                          900                                                                                                     600
    1,500                                                                                                 800
                                                                                                          700                                                                                                     400
    1,000                                                                        Actual                                                                                               Actual                                                                                                BIX 380
                                                                                                          600
                                                                                                                                                                                                                  200
      500                                                                        Forecast                                                                                             Forecast                                                                                              BIX MGO
                                                                                                          500
         0                                                                                                400                                                                                                        0
             Q1    Q2     Q3       Q4      Q1      Q2      Q3      Q4      Q1       Q2                           Q1     Q2      Q3        Q4     Q1     Q2      Q3      Q4      Q1      Q2                               Q1    Q2     Q3 Q4        Q1     Q2     Q3     Q4      Q1     Q2
             ’17                           ’18                             ’19                                   ’17                             ’18                            ’19                                      17                        18                           ’19
1) real GDP, Global Insight, Copyright © IHS, Q4 2018 . All rights reserved. 2) Demand growth = Port-to-Port Container Traffic growth. Supply growth = Fleet Growth. Source: Drewry Maritime Research. 3) Drewry, in USD/40ft container, including BAF & THC both ends, 42 individual routes, excluding
intra-Asia routes, 5.5% predicted freight rate increase. 4) Shanghai Shipping Exchange, in USD/20ft container & USD/40ft ctnr for US routes, 15 routes from Shanghai. 5) Bunker Index, in USD/metric ton, Bunker Index MGO (BIX MGO) = avg. Global Bunker Price for marine gasoil (MGO) port prices; (BIX
380= avg. Global Bunker Price for all 380 centistoke (cSt) port prices; both index published on the Bunker Index website., Forecast based on HIS Market assumption of avg. USD70 per Brent barrel equaling Nov18 price. 6) DHL Global Trade Barometer Mar18, index value represents weighted average of
current growth and upcoming two months of trade, a value at 50 is considered neutral, expanding above 50, and shrinking below 50.

                                                                                                                                                                                             DHL Global Forwarding | OFR Market Update | Feb 2019                                                      4
OCEAN FREIGHT MARKET UPDATE - DHL
PUBLIC

  Market Outlook February 2019 – Major Trades

Carriers have announced an extensive blank sailing program in anticipation of the weaker demand during Chinese New Year
EXPORT REGION IMPORT REGION                      CAPACITY                RATE           EXPORT REGION     IMPORT REGION           CAPACITY               RATE
                                AMNO                  =                   +                                    AMNO                    =                   ++
       EURO                                                                                AMLA
                                 AMLA                 =                  =/-                                    ASPA                   +                   +
                                 ASPA                 +                  =/-                                    EURO                   =                   ++
                                MENAT                 +                  =/-                                   MENAT                   =                   +
                                  SSA                 =                   =                                      SSA                   --                  ++

                                 AMLA                 =                   +                                     ASPA                   -                   =
       AMNO                                                                                 ASPA
                                 ASPA                 =                   =                                    AMNO                    -                       -
                                EURO                  =                   =                                     AMLA                   =                       -
                                MENAT                 =                   =                                     EURO                   --                  =
                                  SSA                 =                   +                                    MENAT                   -                   =
                                                                                                                                     --(AU)              = (AU)
                                                                                                              OCEANIA
   KEY
               Strong
                         ++
                              Moderate
                                         +
                                               No
                                                      =
                                                          Moderate
                                                                     -
                                                                         Strong
                                                                                   --                                                 - (NZ)             + (NZ)
              Increase        Increase       Change        Decline       Decline

Source: DGF

                                                                                                        DHL Global Forwarding | OFR Market Update | Feb 2019            5
PUBLIC

  Market Outlook February 2019 – Ocean Freight Rates Major Trades
    Market outlook on smaller trades available in the back-up

  OCEAN FREIGHT RATES OUTLOOK
                             overall space situation is getting tight before the Chinese New Year holiday. An extensive blank sailing program is in place from all
  ASPA – EURO
                             alliances as a reaction to the low demand and will start from wk5 onwards.
                             Ocean rates remain stable resp. slightly decreasing for certain commodities and short term agreements due to the space and bunker
  EURO – ASPA & MEA
                             development.
                             Space continue to be tight to Mexico & WCSA, while ESCA is manageable. Space issues expected post Chinese New Year to
  ASPA – AMLA
                             Mexico/WCSA and ECSA due to multiple blank sailings from all carriers.

  ASPA – AMNO                No major rush prior Chinese New Year. Extensive blank sailings are expected between wk6 to wk8 (particularly into USEC).
                             Ocean rates are strong and still increasing; inland carriages in US remain problematic; congestion on USEC & CAEC causes severe
  EURO – AMNO
                             delays into USMW area
                             As predicted, space is getting tight before Chinese New Year period. Carriers are also restricting low paying cargo onboard. Most of the
  ASPA – MENAT
                             FAK rates have been extended till mid February.

  ASPA – ASPA                Blank sailings have been planned during the Chinese New Year period. No significant changes to the FAK rates expected.

  AMNO – EURO                No change with rates & Capacity in February. Space remains tight out of Houston.

Source: DGF

                                                                                                           DHL Global Forwarding | OFR Market Update | Feb 2019           6
PUBLIC
  Economic Outlook & Demand Development
  Danger of global economic downturn has risen, probability of a recession in 2019 still low

                               Fiscal stimulus coming in DE, FR & IT will lead to a temporary pickup in real GDP in Q1 ’19. UK parliament’s rejection of the Withdrawal
          EURO
                               Agreement support cautious near-term UK growth projections.

                               Recent turbulences in financial markets implied that volatility had spiked, and risk spreads had widened. The partial government shutdown
          AMNO
                               in Jan will cut an estimated 0.1 percentage point from real GDP growth, and the assumption is that losses will be recovered in Q2.

                               Real GDP recovered in JP in Q4 18, tanks to a rebound in domestic demand – consumer spending & capital expenditure remain solid.
                               However, imports increased more rapidly than exports in Q4. The scheduled increase in sales tax in Oct ’19 will contribute to volatility in
          ASPA                 quarterly GDP growth patterns, as consumers & businesses shift purchases forward. Economic growth in CN should stabilize as the
                               Government’s measured stimulus policies gradually kick in. Meanwhile, exports, industrial production, & retail sales have decelerated, as
                               has factory price inflation.

      EMERGING                 While currency pressures on emerging markets have eased, weakening global growth and more pessimism on commodity prices will do
      MARKETS                  little to boost growth prospects.

                               JPMorgan Global PMI sank to its lowest level in 27 months. Meanwhile, optimism about the year ahead slipped to its weakest reading in 2 ½
    DEMAND
                               years, suggesting the slowdown has further to run. Deteriorating goods trade was once again the major factor behind the slowdown.
  DEVELOPMENT
                               Manufacturing PMIs for a number of countries (CN, FR, IT, CZ,PL, TW, MY, KR, MX, TR) are below the 50-point threshold.

Source: IHS Markit Global Executive Summary, IHS Purchasing Manager Index Manufacturing, a PMI at 50 is considered neutral, expanding above 50, and business shrinking below 50.

                                                                                                                                                      DHL Global Forwarding | OFR Market Update | Feb 2019        7
PUBLIC

  Carriers / Capacity

     CARRIERS
    The OCEAN Alliance members CMA CGM, COSCO Shipping, Evergreen and OOCL (part of COSCO Group) have unveiled their new ‘Day 3 Product’ that is
    due to start from April 2019. It will offer 38 liner services on East – West trades, to be ensured with 330 ships, representing a total fleet capacity of 3.8 MTEU.
    The 4 carriers have also decided to extend their cooperation until 31 Mar 2027. The OCEAN Alliance was launched in Apr 2017 for an initial period of 5 years with
    an option for a 5-year renewal. The OCEAN Alliance ‘Day 3 Product’ is an expansion of the current ‘Day 2 Product’ with several significant enhancements,
    such as, addition of a 7th Far East – North Europe loop, with a full up-grade of a 3rd string to the 20,000 TEU scale, an upgrade of the Far East – Middle
    East ‘MEA5’ service to the 20,000 TEU scale. This will make the ‘MEA5’ the first service to employ megamax ships outside of the Asia – North Europe route and
    an improved Vietnam coverage.
    The OCEAN Alliance is expected to continue to expand at the fastest pace in 2019, compared to its rivals in 2M and THE Alliance. OCEAN Alliance’s growth
    will be pushed by the scheduled deliveries of ULCS newbuilding for COSCO and Evergreen. Although MSC also has substantial pipeline of ULCS units
    scheduled for delivery this year, most of MSC’s ships will be delivered in the 2 nd half of the year, while COSCO and Evergreen’s ships will be mostly delivered in
    the 1st half.
    ZIM and the 2M partners (Maersk and MSC) will extend their cooperation to the Transpacific North West and Asia – East med routes from March 2019,
    subject to regulatory approvals. They already had concluded a 1st strategic cooperation agreement for the Asia – US East Coast trade in Jul 2018. Although this
    extended cooperation will bring some changes in the services the overall trade capacity is expected to remain largely unchanged, with the 2M services to be
    upsized to accommodate the ZIM volumes.

    CAPACITY DEVELOPMENT
    The idle containership fleet fell slightly to 561,187 TEU as at 7 Jan 2019, with healthy capacity utilization on the Asia – Europe and Transpacific routes over the
    year and keeping idle capacity in check. The number of idle ships of over 12,500 TEU dropped to only 8 units compared to 13 ships in Dec 2018. This mainly due to
    the return of several vessels to active duty on the Asia- Europe route, involving Maersk, CMA CGM, Hapag-Lloyd and Yang Ming tonnage. However vessel
    demand is expected to fall again in February as the Lunar New Year holidays in the Far East starting on 5 Feb 2019, will put more ships out of work.

Source: Alphaliner, Dynaliners, carriers

                                                                                                           DHL Global Forwarding | OFR Market Update | Feb 2019           8
PUBLIC

  Drewry’s Altman Z-Score as of 1 Dec 2018
                                                                                                                                                   Assets                Book Value                 Liabilities              Retained
    Company                                       Period       Period Ended              Units          Net Sales          EBIT                                                                                                       Z-Score
                                                                                                                                           Total          Current         of Equity            Total          Current        Earnings

    OOIL 1)                                    6 months             30. Jun 18 million US$                      3'115             51           9'939             3'136             4'637            5'302           1'580           4'575       2.28
    AP Moeller-Maersk                          9 months             30. Sep 18 million US$                    28'837            408           61'787           23'232            34'116           27'671          12'229          29'749        2.24
    CMA CGM                                    9 months             30. Sep 18 million US$                    17'176            399           20'381             6'115             5'632          14'749            5'991           5'276       1.81
    Wan Hai                                    9 months             30. Sep 18 million NT$                    48'185            474           75'695           26'449            34'279           41'416          19'785          11'649        1.69
    Hapag-Lloyd Holding                        9 months             30. Sep 18 million euro                     8'428           301           15'099             1'742             6'192            8'907           3'101           3'086       1.43
    NYK group                                  9 months             30. Sep 18 billion Yen                        916              -4          2'096               502               565            1'532             604             331       1.24
    K Line group                               9 months             30. Sep 18 billion Yen                        416            -12           1'037               322               285              753             243             102       1.18
    Evergreen Marine Corp                      9 months             30. Sep 18 million NT$                  120'035          -1'015         218'491            62'598            66'626          151'865          50'194            8'850       1.10
    MOL group                                  9 months             30. Sep 18 billion Yen                        620             15           2'263               415               654            1'609             532             311       0.97
    Pacific International Lines                6 months             30. Jun 18 million US$                      2'244            -38           6'666             1'714             1'728            4'938           2'349             952       0.93
    Yang Ming                                  9 months             30. Sep 18 million NT$                  103'349          -6'223         140'155            33'289            20'449          110'705          47'530           -7'037       0.71
    China Cosco 2)                             9 months             30. Sep 18 million RMB                    82'130          1'565         227'872            64'350            54'986          172'886          95'823          10'216        0.60
    Zim                                        9 months             30. Sep 18 million US$                      2'395          -125            1'802               630              -186            1'909             653          -1'879      -0.07
    Hyundai Merchant Marine                    9 months             30. Sep 18 billion Won                      3'777          -493            3'419               951               337            3'082           1'059          -3'310      -0.49

The Z-Score is a statistical analysis to predict a company’s probability of failure in the next two years, using data from the company’s financial statement.
Z-Score  2.99 = company is “safe”; Z-Score between 1.8 and 2.99 = exercise caution (“grey zone”); Z-Score  1.8 = Higher risk of the company going bankrupt
(“distress zone”)
Source: Drewry Sea & Air Shipper Insight Aug 2018, 1) parent of OOCL, 2) parent of Cosco Container Lines; Z-score is calculated as follows: T1 = (Current Assets - Current Liabilities) / Total Assets, T2 = Retained Earnings / Total Assets, T3 =
Annualized EBIT / Total Assets, T4 = Book Value of Equity / Total Liabilities, T5 = Annualized Sales / Total Assets, Z-score bankruptcy rating = 1.2*T1 + 1.4*T2 + 3.3*T3 + 0.6*T4 + 1.0*T5

                                                                                                                                                               DHL Global Forwarding | OFR Market Update | Feb 2019                                    9
Did you know?
Top 15 Container Ports
Change in Top 15 Container Port Rankings 2000-2018

                                                     •   The number of major ports in Asia has climbed from 8 to 11
                                                         in 18 years , out of these 11 Asian ports 7 are in China
                                                     •   European ports are the big losers as their number has
                                                         reduced by half, with Hamburg and Felixstowe dropping out
                                                         of the Top 15 altogether
                                                     •   Hong Kong is also suffering. Throughput has declined in 7
                                                         out of the last 10 years since its peak of 24.49 mTEU in
                                                         2008. Hongkong International Terminals (HIT), Modern
                                                         Terminals (MTL), COSCO-HIT Terminals (CHT) and Asia
                                                         Container Terminals (ACT) have therefore announced on 8
                                                         Jan the formation of the Hong Kong Seaport Alliance, a joint
                                                         operating agreement aimed at combating the decline in
                                                         container volumes

Source: Alphaliner

                                                           DHL Global Forwarding | OFR Market Update | Feb 2019         10
PUBLIC

BACK-UP
          11
PUBLIC

  Market Outlook January 2019 – Ocean Freight Rates Additional Trades (1/2)

  OCEAN FREIGHT RATES OUTLOOK

  EURO – AMLA    Capacity unchanged, space is available, rates remain stable and are expected to slightly decrease until end of Q1

  EURO – MENAT   ME region shows same trend as ASPA; low space but stable rates

  EURO – SSA     Rates remain stable and space is available. Congestion / PSS surcharge for PODs in Nigeria from all carriers still in force

                 Rates in the market are stable. Space can be an issue from US Gulf Coast while bookings are 2 weeks out. USEC is in a better shape where
  AMNO – MENAT
                 we mostly can manage to get space for the next week sailings.

                 Rates to South Africa and West Africa were stable for long time but direct carriers announced GRIs for February. No changes in capacity.
  AMNO – SSA
                 Space is available. (Direct Service is currently shared by Maersk/Safmarine/MSC/HSUD).

  AMNO – AMLA    Fuel is raising cost slightly. Q 1 2019 outlook soft to begin the year.

                 Roll over and space constraints affecting entire region. MX/BR/SAWC region facing port omissions/blank sailings/congestion. Shippers are
                 strongly urged to provide forecasts 4-6 weeks out.
  AMLA Exports   Lack of trucking capacity in Mexico interrupting supply chain/extensive delays in cargo movement.
                 GRI’s and Emergency Fuel surcharges announced daily on all trades.
                 F/Time/Drop off conditions coming with a cost.

                 Heavy delays at several rail ramps and ports affecting export cargo. Market is stable in terms of rates for January / February. Space is tight for
  AMNO – ASPA
                 Oceania direct services off USWC. Pre-booking 2-3 weeks ahead recommended.

Source: DGF

                                                                                                      DHL Global Forwarding | OFR Market Update | Feb 2019            12
PUBLIC

  Market Outlook January 2019 – Ocean Freight Rates Additional Trades (2/2)

  OCEAN FREIGHT RATES OUTLOOK
  EURO MED - AMNO    Unchanged / stable. Nothing to be highlighted
  EURO MED – AMLA    Unchanged / stable. Nothing to be highlighted
  EURO MED – ASPA    Unchanged / stable. Nothing to be highlighted
  EURO MED – MENAT   Unchanged / stable. Nothing to be highlighted
  EURO MED – SSA     Unchanged / stable. Nothing to be highlighted
                     Average weekly blank sailing for February hovers at 40-45% after a very slight peak in January this year. FAK has been extended to
  ASPA-SPAC
                     mid/end-February as no extreme space issue is anticipated.

Source: DGF

                                                                                               DHL Global Forwarding | OFR Market Update | Feb 2019       13
PUBLIC
  Market Outlook – Volume Outlook in Main Trade Lanes, 2018 Estimate &
  2019/22 Growth Forecast in %
                                                                                                                                      2018e, in mTEU   2019e-2022e CAGR, in %

            N O R T H                                                                                                                                N O R T H
          A M E R I C A                                                                                                                            A M E R I C A
             I n c l .                 4.0 mTEU   +2.4%                                                                        8.5 mTEU   +4.7%       I n c l .
           M E X I C O                                                                           F A R   E A S T                                    M E X I C O

                                       2.2 mTEU   +3.1%                       12.8 mTEU +2.4%                                  18.7   mTEU +3.1%

 2.0 mTEU       1.6 mTEU
   +4.5%          +4.3%                1.6 mTEU   +4.3%    E U R O P E        7.3 mTEU   +3.4%                                 1.7 mTEU   +2.2%
                          L A T I N                                                                                                                                L A T I N
                                                          I n c l .   M E D
                       A M E R I C A   1.7 mTEU   +2.5%                                                                        4.2 mTEU   +4.6%               A M E R I C A
                                                                                                 INTRA ASIA
                                                                                                   excl. Oceania

                                                                                                 41.6 mTEU +4.8%

                    GLOBAL CONTAINER TRADE 2018e                                      152.6 mTEU            +4.1% CAGR 2019e-2022e

                                                           Mid-term growth is mainly driven by Asian tradelanes.

Source: Seabury Nov18 update

                                                                                                           DHL Global Forwarding | OFR Market Update | Feb 2019                14
PUBLIC

  Carrier Mergers, Acquisitions and Alliances

                                                M E R G E R S               A N D     A Q U I S I T I O N S

                                                                               United      Hyundai
      China                                                   CMA   Hapag                             Hamburg     Maersk                                        Yang
                      Cosco   OOCL Evergreen APL                                Arab       Merchant                           MSC          K Line   MOL   NYK
     Shipping                                                 CGM   Lloyd                               Süd        Line                                         Ming
                                                                              Shipping      Marine
                                                                                                                                                
                                                                                            HYUNDAI
      CHINA COSCO SHIPPING                EVER      CMA CGM                                             MAERSK LINE                         OCEAN NETWORK       YANG
                                                                      HAPAG-LLOYD          MERCHANT                            MSC
              OOCL                       GREEN        APL                                   MARINE      Hamburg Süd                          EXPRESS (ONE)      MING

                                                                             A L L I A N C E S
                         F O R M E R       A L L I A N C E S                                               P R E S E N T               A L L I A N C E S
                                                                                                                        MAERSK LINE                                         OOCL
                                                                                 CMA CGM
                                                                                                                                  MSC
                                  MAERSK LINE                           CHINA SHIPPING                                                      OCEAN                        CMA CGM
 2M                                             OCEAN 3                                     2M                         HMM (strategic
                                         MSC                               UNITED ARAB
                                                                                                                   cooperation until Apr
                                                                                                                                            ALLIANCE         CHINA COSCO SHIPPING
                                                                     SHIPPING COMPANY                                                                                 EVERGREEN
                                                                                                                                 2020)

                    HAPAG-LLOYD      HYUNDAI                        COSCO
                                                                                                                       HAPAG-LLOYD
                            MOL    MERCHANT                    EVERGREEN          K-LINE
 G6                                   MARINE    CKYHE                                       THE ALLIANCE                       ONE
                            NYK                                    HANJIN     YANG MING
                                        OOCL                                                                             YANG MING
                            APL                                   SHPPING
*Source: Carriers

                                                                                                                DHL Global Forwarding | OFR Market Update | Feb 2019           15
PUBLIC

Acronyms and Explanations
          2M    -   Carrier Alliance: Maersk / MSC                                    Ocean 3    -   Carrier Alliance: CMA, UASC, China Shipping
      AMLA      -   Latin America                                                       OCRS     -   Operational Cost Recovery surcharge
      AMNO      -   North America                                                       OOCL     -   Orient Overseas Container Line
          AR    -   Argentina                                                            OWS     -   Overweight Surcharge
      ASPA      -   AsiaPacific                                                            PH    -   Philippines
          BR    -   Brazil                                                               PNW     -   Pacific North West
      CAGR      -   Compound Annual Growth Rate                                           Ppt.   -   Percentage points
     CENAC      -   Central Amercia and Caribbean                                        PSW     -   Pacific South West
     CKYHE      -   Carrier Alliance: Cosco, K-Line, YangMing, Hanjin and Evergreen      RR(I)   -   Rate Restoration
        CNC     -   CNC Line (Cheng Lie Navigation Co. Ltd.)                            SAEC     -   South America East Coast
          DG    -   Dangerous Goods                                                    SAWC      -   South America West Coast
       DWT      -   Dead Weight Tonnage                                                SOLAS     -   Safety of Life at Sea
          EB    -   Eastbound                                                           SPRC     -   South People’s Republic of China – South China
      ECSA      -   East Coast South America                                              SSA    -   Sub-Saharan Africa
      EGLV      -   Evergreen Marine Corp                                                 SSL    -   Steam Ship Line
      EURO      -   Europe                                                                  T    -   Thousands
        FMC     -   US Federal Marine Commission                                          TEU    -   Twenty foot equivalent unit (20‘ container)
          G6    -   Carrier Alliance: APL, Hapag Lloyd, Hyundai, MOL, NYK and OOCL         TP    -   Trans Pacific
         GRI    -   General Rate Increase                                                 TSA    -   Trans Pacific Stabilization Agreement
        HJS     -   Hanjin Shipping                                                     ULCS     -   Ultra Large Container Ship
       HMM      -   Hyundai                                                             USGC     -   US Gulf Coast
          HL    -   Hapag -Lloyd                                                      US FMC     -   US Federal Maritime Commission
      HSUD      -   Hamburg Süd                                                         USEC     -   US East Coast
       HWS      -   Heavy Weight Surcharge                                             USWC      -   US West Coast
           IA   -   Intra Asia                                                           VGM     -   Verified Gross Mass
       IPBC     -   India Pakistan Bangladesh Colombo                                   VLCS     -   Very Large Container Ship
          IPI   -   Inland Point Intermodal                                               VSA    -   Vessel Sharing Agreement
         ISC    -   Indian Sub Continent                                                   WB    -   Westbound
     MENAT      -   Middle East and North Africa                                       WCSA      -   West Coast South America
          ML    -   Maersk Line                                                          WHL     -   Wan Hai
          mn    -   Millions                                                              YML    -   Yang Ming Line
        MoM     -   Month-on-Month                                                        YoY    -   Year-on-Year
       NOO      -   Non-operating (vessel) owners                                         YTD    -   Year-to-Date

                                                                                         DHL Global Forwarding | OFR Market Update | Feb 2019             16
You can also read