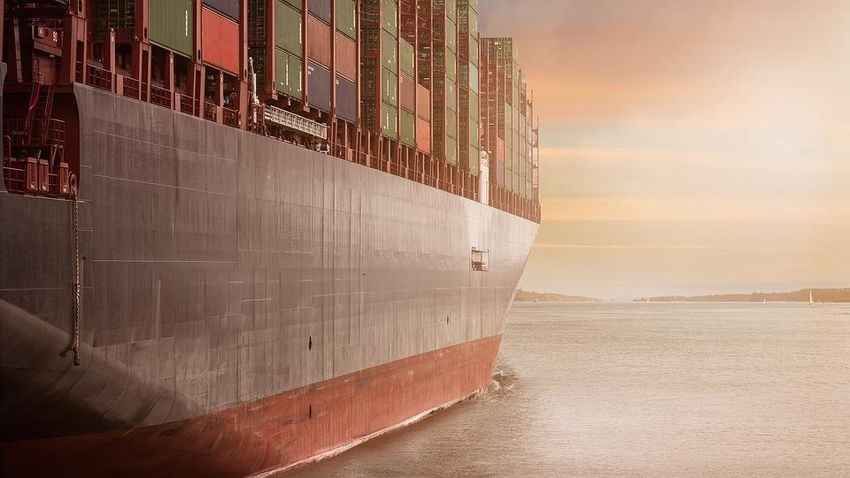
OCEAN FREIGHT MARKET UPDATE - October 2019 DHL Global Forwarding, Freight Dominique von Orelli - Global Head, Ocean Freight - Global Maritime Hub
←
→
Page content transcription
If your browser does not render page correctly, please read the page content below
PUBLIC

DHL Global Forwarding, Freight

OCEAN FREIGHT
MARKET UPDATE
October 2019
Publication Date 30th September 2019
Dominique von Orelli – Global Head, Ocean Freight

                                                        1
PUBLIC

Contents

    HIGH LEVEL DEVELOPMENT

    MARKET OUTLOOK
    Freight Rates and Volume Development

    ECONOMIC OUTLOOK & DEMAND DEVELOPMENT

    CAPACITY DEVELOPMENT

    CARRIERS

    REGULATIONS

?   DID YOU KNOW?
    Carrier Financial Results 6 Months 2018-19

                                                 DHL Global Forwarding | OFR Market Update | October 2019       2
                                                                                                                2
PUBLIC
High Level Market Development – Supply and Demand
ECONOMIC OUTLOOK GDP GROWTH BY REGION1) DHL TRADE BAROMETER6) SUPPLY/DEMAND GROWTH
SUPPLY/DEMAND GROWTH (ANNUALIZED),
(ANNUALIZED),ININ
%%2) 2)
CAGR 75 Demand
2019F 2020F 2021F 2022F 2023F Sep19 index 6%
(2020-23) 70 predicts Sep- Growth
65 Nov19 trade 5% %
EURO 1.4% 1.2% 1.4% 1.6% 1.6% 1.5%
60 development 4%
MEA 1.9% 2.8% 2.9% 3.1% 3.3% 3.1%
55
AMER 2.4% 2.1% 1.8% 1.6% 1.6% 1.9% 50
3%
ASPA 4.5% 4.3% 4.4% 4.4% 4.5% 4.4% 45 Ocean 2% Supply
40 Global 1% Growth %
DGF World 2.7% 2.7% 2.8% 2.8% 2.8% 2.8% 35
30
0%
Q1 Q2 Q3 Q4 Q1 Q2 Q3 Q4 Q1 Q2 Q3 2018 2019F 2020F 2021F 2022F 2023F
’17 ’18 ’19
Carriers will start bunkering
WORLD CONTAINER INDEX (WCI)3) SHANGHAI CONTAINERIZED FREIGHT INDEX (SCFI)4) BUNKER PRICE INDEX5) IMO 2020 compliant fuel as of
Q4 ’19. Implications on
3,000 1,200 1,000
bunker & BAF prices not
1,100 known yet.
2,500 800
1,000
2,000
900 600
1,500 800
700 400
1,000 Actual Actual
600 BIX 380
500 Forecast Forecast 200
500 BIX MGO
0 400 0
Q1 Q2 Q3 Q4 Q1 Q2 Q3 Q4 Q1 Q2 Q3 Q4 Q1 Q2 Q3 Q4 Q1 Q2 Q3 Q4 Q1 Q2 Q3 Q4
’18 ’19 ’18 ’19 ’18 ’19
1) real GDP, Global Insight, Copyright © IHS, Q2 2019 . All rights reserved. 2) Demand growth = Port-to-Port Container Traffic growth. Supply growth = Fleet Growth. Source: Drewry Maritime Research. 3) Drewry, in USD/40ft container, including BAF & THC both ends, 42 individual routes, excluding intra-Asia
routes. 4) Shanghai Shipping Exchange, in USD/20ft container & USD/40ft ctnr for US routes, 15 routes from Shanghai. 5) Bunker Index, in USD/metric ton, Bunker Index MGO (BIX MGO) = avg. Global Bunker Price for marine gasoil (MGO) port prices; (BIX 380= avg. Global Bunker Price for all 380 centistoke
(cSt) port prices; both index published on the Bunker Index website. 6) DHL Global Trade Barometer Jun19, index value represents weighted average of current growth and upcoming two months of trade, a value at 50 is considered neutral, expanding above 50, and shrinking below 50.
DHL Global Forwarding | OFR Market Update | October 2019 3
3PUBLIC
Market Outlook October 2019 – Major Trades
Further blank sailing announced due the to lower demand during the Chinese Golden week holidays out of Asia
EXPORT REGION1 IMPORT REGION CAPACITY RATE EXPORT REGION IMPORT REGION CAPACITY RATE
AMNO = = AMNO = =
EURO AMLA
AMLA = =/- ASPA = =
ASPA - =/+ EURO = =
MENAT - =/+ MENAT = =
SSA = = SSA = =
AMLA = - ASPA - =/+
AMNO ASPA
ASPA = - AMNO - =/-
EURO = = AMLA - -
MENAT = = EURO - -
SSA = = MENAT = +
OCEANIA - +
Strong Moderate No Moderate Strong
KEY ++ + = - --
Increase Increase Change Decline Decline
Source: DGF
DHL Global Forwarding | OFR Market Update | October 2019 4
4PUBLIC
Market Outlook October 2019 – Ocean Freight Rates Major Trades
Market outlook on smaller trades available in the back-up
OCEAN FREIGHT RATES OUTLOOK
Carriers report weak utilization. Capacity has been sharply reduced for the first two October weeks. Rates levels are expected to drop for
ASPA – EURO
October.
Due to the golden week in Far East and several blank sailings (ongoing scrubber upgrades), space constraints are expected to come up
EURO – ASPA & MEA mid/end of November (week 47/48). This will also affect the empty equipment situation throughout Europe, especially the hinterland
availability and will have a cascading effect on the connected trades ie ME / IPBS and AU&NZ.
Capacity has been reduced for the first two October weeks. Utilization remains moderate to strong. Rates levels have slightly dropped for
ASPA – AMLA
1st week of Oct but we expect a gradual climb across the next weeks.
Carriers have announced blank sailing for the first two weeks of October. Rate levels are expected to be under pressure due to the lower
ASPA – AMNO
demand during the China Golden Week.
EURO – AMNO space remains tight. However situation is expected to ease in the upcoming weeks.
Rates are stable. Capacity utilization is still moderate to strong. Impact of the Golden Week holidays is yet to be seen. In general, demand is
ASPA – MENAT
not expected to pick up immediately after the holidays.
Most Intra Asia/IPBC services will have blank sailing within first two weeks of October, space is expected to be tight for rest of the month.
Cargo-rolling at transshipment port on the Indian Subcontinent trade have eased a little but may worsen again with the China long holiday
ASPA – ASPA
rush. Heavy rains and floods in South Asia have further affected port productivity and operations in Chittagong, further delays are to be
expected.
AMNO – EURO US-EURO market rates remain flat – reduced capacity in week 41 ( no sailing for AL3 & Liberty Bridge ).
Source: DGF
DHL Global Forwarding | OFR Market Update | October 2019 5
5PUBLIC
Economic Outlook & Demand Development
Trade war & oil market disruption have increased the risk of recession
The slowdown in eurozone real GDP growth in Q2 is expected to be followed by a further deceleration in both Q3 & Q4 ‘19. Exports & manufacturing
are the principal sources of weakness. IHS Markit predicts another quarter of decline in DE (a mild recession, so far), & many quarters of contraction
in IT. The French & Spanish economies are expected to avoid recession. Meanwhile, the chaos around Brexit continues, as Prime Minister Boris
EURO
Johnson and the UK parliament have clashed over the fate of a no-deal outcome and whether to hold an early election. The European Union has
signaled its willingness to extend the Brexit deadline for a 3rd time. This signal increases the chances of avoiding a no-deal scenario with an
associated deep recession.
The Trump administration’s announced new 15% tariffs on most goods imports from China that had previously escaped tariffs, & an increase in the
tariff rate to 30% on imports from China that had been subject to a 25% rate. These tariff changes, being implemented in steps from 1 Sep to 15 Dec,
AMNO
are expected to boost US consumer prices & the cost of capital, softening the outlook for personal consumption expenditures, business fixed
investment, & GDP.
Front-loaded demand ahead of the consumption tax increase in JP from 8% to 10% on 1 Oct will modestly boost Q3. However, HIS Markit predicts a
ASPA contraction in real GDP in Q4, as consumer spending falls back. July and Aug data on the CN economy point to a further loss of momentum.
Industrial production & construction have led the deceleration. Even more troubling, automobile sales in Aug declined for the 14th time in 15 months.
The extreme difficulties facing some economies (e.g., AR & TR, which are both in deep recessions) are a function of negative dynamics at both the
EMERGING global & local levels. Special factors such as sanctions affect others (e.g., IR & RU). While some will continue to see positive growth in the near term
MARKETS (e.g., BR & IN), they are losing steam. IN is of particular concern. Growth has been slowing since the beginning of 2018 & recently hit a 6-year low of
5.0%. Car sales have also been plummeting. Lack of reforms is a big part of the problem.
The key driver of the recent slowdown of the JPMorgan Global PMI has been a decline in global trade. In manufacturing, export orders fell at the
DEMAND
sharpest rate since Oct’12, dropping for a 12th successive month in Aug. Although factory output stabilized after two months of declines, the
DEVELOPMENT
Source: IHS Markit, IHS Purchasingperformance was still aone
Manager Index Manufacturing, PMI atof
50the weakest
is considered seen
neutral, in theabove
expanding past50,seven years.
and business shrinking below 50.
DHL Global Forwarding | OFR Market Update | October 2019 6
6PUBLIC
Capacity Development 1/2
CAPACITY
Total capacity of the world’s cellular containership fleet has passed 23Mteu mid September, following the delivery of two more ‘Pegasus’ class (23,000 TEU+ megamax
ships) vessels to MSC. Growth of cellular fleet has remainded stready at around 4% since May, with deliveries of new containerships adding 826,000 TEU to the overall
fleet so far this year. In contrast scrapping has remainded low with only 165,000 TEU removed from the fleet since January.
The 2M partners Maersk and MSC are to reduce their capacity between Asia and Europe by temporarily suspending the Far East-North Europe ‘AE-2/Swan’ service.
The ‘AE-2/Swan’ service is one of six loops offered by 2M between the Far East and North Europe representing an average weekly capacity of 18,000 TEU of 18% of the
total 2M capacity on the route. The suspension will start from the first week of October due to the anticipated slowdown in demand after the Chinese ‘Golden Week’
holidays. MSC says it expects to resume the ‘AE-2/Swan’ service in mid-November, provided the market demand recovers.
In addition to the suspension of the ‘AE-2/Swan’ loop, Maersk and MSC will also skip three Asia-Europe sailings in the first half of October. This concerns one sailing of
the Far East-North Europe ‘AE-7/Condor’ service in week 40 and two sailings of the Far East-Med ‘AE-20/Dragon’ service in weeks 40 and 41.
The 2M partners offer a direct connection between Far East and New Orleans with the insertion of this port on the rotation of their Asia – US Gulf ‘TP-18/Lone Star’
service end of September. It is the second direct Asia connection for the port of New Orleans, adding to the OCEAN Alliance ‘AWE6’ service. Mid September, the 2M also
added a call at Nansha to the schedule of ist Asia – US East Coast service ‘TP-17/America’.
Further to the launch of direct Far East – US Gulf services covering Tampa, Mobile, New Orleans and Houston, ZIM and MSC will terminate at the end of September their
weekly US Gulf relay service connecting the hubs of Caucedo and Kingston with these same four US Gulf ports. This service, branded ‘CGX’ by ZIM and ‘US Gulf Feeder’
by MSC is made redundant by the direct services.
Maersk and MSC have re-launched in mid-September their jointly operated South China – Australia service, branded respectively as ‘Yoyo’ and ‘Panda’. The reboot will
come with a slightly different rotation, since Taiwan is no longer part of the itinerary. The original service was suspended an the end of March and it was initially due to be
restarted at the end of June. The temporary halt was termed as a ‘slack season program’, aimed at adjusting capacity in line with lower market demand.
Hapag-Lloyd, ONE and Yang Ming, cooperating under the scope of THE Alliance, have decided to deploy an additional vessel on their North Europe – US Gulf ‘AL4’
service to improve schedule reliability. With immediate effect, this service starts turning in seven weeks, compared to six weeks so far. Since the loop’s port rotation
remains unchanged, the alliance members gain seven days of buffer time to reduce the risk of vessel delays and subsequent port omissions. The 7,323 TEU AL HILAL will
join the service mid-Ocotber as the seventh vessel.
Source: Alphaliner, Dynaliners, carriers
DHL Global Forwarding | OFR Market Update | October 2019 7
7PUBLIC
Capacity Development 2/2
CAPACITY
CMA CGM offers for the third consecutive year a seasonal (fruit oriented) North Brazil – North Europe service connecting Vila do Conde and Fortaleza with London-
Gateway and Rotterdam. This service, dubbed ‘UK Express’, will cater primarily for the North Brazil fruit exports and is expected to be operated until ealry next year. .
PIL and COSCO have added direct calls at Port Kelang (Malaysia) and Qinzhou (South China) on the Northbound leg of the Far East – East Coast South America (ECSA)
service. This service is jointly operated by PIL, COSCO, CMA CGM and Evergeen under the respective brands ‘SSA’, ESA2’, ‘SEAS2’ and ‘ESA3’. CMA CGM and Evergreen
have not yet advertised the additional calls. Co-loader OOCL (COSCO Group) also participates on the new calls. This move enables PIL and COSCO to offer the only direct
container service from Brazil to Qinzhou, a gateway to the Guangxi province. It also allows the Singapore and Chinese carriers to offer a direct link from Brazil ports to
Port Kelang, a hub in the Straits that will provide additional transshipment opportunities in the region.
Source: Alphaliner, Dynaliners, carriers
DHL Global Forwarding | OFR Market Update | October 2019 8
8PUBLIC
Carriers
CARRIERS
CMA CGM’s heavy debt burden has forced the carrier to seek a buyer for terminal assets held by its wholly-owned subsidiary CMA Terminals (CMAT). CMAT owns
stakes in 32 terminals worldwide and it handled volumes of over 8.50 MTEU in 2018. Strategic assets in CMAT’s portfolio are the 49% stake in the CMA CGM – PSA Lion
Terminal at Singapore, a 30% stake in Rotterdam World Gateway terminal, and a 100% stake in the Kingston Freeport Terminal. China Merchants is reported to be the
front runner to buy the CMAT terminals, which would allow the Chinese operator to further expand its global footprint. Continued negative results at CEVA Logistics,
which posted a net loss of $32M in Q2, 2019, are expected to have put a strain on CMA CGM’s performance. The same goes for interest payments of over $300M from
CMA CGM’s total debt of $19.9Bn (as per end of March 2019).
Maersk Line is in the process of gradually dropping the ‘Line’ suffix from its trading name. Maersk already stopped using the brand name ‘Maersk Line’ at the
beginning of the year and the far-reaching restructuring of the global shipping, ports and logistics group will be fully completed on 16 November when the name of the
legal entitgy Maersk Line A/S will be changed to Maersk A/S. Maersk will on 16 November also complete the rebranding of ist regional trade subsidiaries MCC Transport
(Asia), Seago Line (Europe) and Sealand (Americas). The three regional carriers have been operating since October 2018 already under ‘Sealand – A Maersk Company’
brand. The name of the legal entities behind will be chanded mid-November to Sealand Asia Pte Ltd. (ex MCC Transport Singapore Pte Ltd) and Sealand Europe A/S (ex
Seago Line A/S). The legal entity behind Sealand Americas will remain Maersk A/S.
One year after COSCO Group started the process to divest of Orient Overseas International Line’s (OOIL)s Long Beach Container Terminal (LBCT) at the eponymous
Californian port, the sale has finally been approved by the Long Beach Board of Harbor Commissioners. The Commissioners unanimously approved and finalized the
transfer of the terminal from OOIL to the investment fund Macquarie Infrastructure Partners. To secure the approval, OOCL has committed to an annual minimum
volume at the LCBT for a period of 20 years. According to details of the minimum volume commitment, OOCL will upgrade two of ist Far East – USWC services and
introduce one new transpacific service calling at LBCT within the next four years.
Evergreen has officially announced orders for ten megamax containerships of 23,000 TEU from Korean and Chinese yards. According to stock market disclosures, the
new ships will cost between $140-160M apiece. According to Alphaliner data, Evergreen is currently world’s seventh largest carrier with a fleet capacity of 1,305,000
TEU. The new megamax orders now bring Evergreen’s pipeline to 566,000 TEU – the largest orderbook of among all carriers.
CMA CGM and Hudong Zhonghua Shipyard are expected to float out the world’s first ever LNG-powered ULCS this week. Named after the founder of CMA, Jacques
Saadé, the 23,112TEU ‘megamax’ ship is scheduled for delivery in Q1, 2020. The CMA CGM JACQUES SAADÉ will be the lead ship in a series of nine LGN-powered sisters
that Hudong Zhonghua and Shanghai Waigaioqiao will deliver to CMA CGM from about March 2020 to February 2021.
Source: Alphaliner, Dynaliners, carriers
DHL Global Forwarding | OFR Market Update | October 2019 9
9PUBLIC
Regulations
REGULATIONS
Australia: 2019-2020 Quarantine Seasonal Treatment Requirements for Brown Marmorated Stink Bug (BMSB)
All goods shipped after 01 Sep ‘19 and will arrive before 31 May ‘20 in Australia, are within the scope of Brown Marmorated Stink Bug (BMSB) season 2019 / 2020. Non-
compliance will cause penalties as well as the risk of shipments being refused for entry and return to origin or destroyed. Kindly note that the measures mandated by the
Australian Government includes compulsory pre-arrival treatment for goods arriving from many countries. Please refer to this link for more information.
Benin: Implementation of Electronic Cargo Tracking Note Number (ECTN)
Effective 01 Sep ‘19, it is a mandatory requirement to mention the Electronic Caro Tracking Note (ECTN) on the Bill of lading. Failure to indicate the ECTN number on the
BL will delay the import clearance process and will be subject to penalties.
Source: DHL
DHL Global Forwarding | OFR Market Update | October 2019 10
10PUBLIC
Did you know?
Carrier Financial Results 6 Months 2018-19
IFRS 16 accounting rule changes helped push the carrier’s average operating margin up with some of the leased assets’ costs
now recognized as depreciation and interest expenses, instead of operating expenses
CARRIER FINANCIAL RESULTS 6 MONTHS 2018-19 (US$ MILLION)
Revenue Operating Profit Operating Profit Margin Net Profit
Carrier 2018 2019 % 2018 2019 % 2018 2019 2018 2019 %
Maersk (Ocean business) 5) 18’873.0 19’167.0 2% 2’093.0 2’593.0 24% 11.1% 13.5% -464.0 50.0 111%
CMA CGM 2), 4) 11’114.0 15’108.0 36% 155.0 434.0 180% 1.4% 2.9% -54.0 -152.0 -181%
COSCO SHIPPING Holdings 1), 4) 6’665.9 10’165.0 52% 40.4 456.4 1029% 0.6% 4.5% -24.9 205.9 928%
Hapag-Lloyd 1), 4) 6’579.1 7’064.4 7% 110.2 441.7 301% 1.7% 6.3% -130.8 156.3 219%
OOCL (container transport & logistics)4), 7) 3’102.0 3’298.0 6% -3.0 153.0 5200% -0.1% 4.6% -77.0 64.0 183%
Evergreen Marine Corp. 1), 4) 2’548.2 3’002.6 18% -88.1 74.9 185% -3.5% 2.5% -37.5 6.6 118%
Yang Ming 1), 4) 2’192.3 2’441.8 11% -189.6 -7.3 96% -8.6% -0.3% -195.5 -63.0 68%
ONE 3) 2’066.0 2’875.0 39% n.a. n.a. n.m. n.a. n.m. -120.0 5.0 104%
Zim 4) 1’554.0 1’630.0 5% -6.0 61.0 1117% -0.4% 3.7% -71.0 -21.0 70%
Wan Hai 1), 4) 988.9 998.3 1% 10.1 46.7 361% 1.0% 4.7% 13.8 56.3 309%
HMM (container shipping business 1), 4) 28.8 31.3 9% -0.3 -0.2 -44% -1.1% -0.6% n.a. n.a. n.a.
Average 6) 53’646.4 62’906.5 17% 2’121.8 4’253.3 100% 4.0% 6.8% -1’041.0 303.2 -129%
Source: Alphaliner; n.a. = not available, n.m. = not meaningful, 1) local currency numbers were converted into US$ using the average exchange rate for relevant financial period, 2) CMA CGM include CEVA Logistics from 2019, 3) results are Q1 of Japanese
financial year, i.e. Apr-Jun, not calendar year, 4) operating profit is “Core EBIT”, 5) operating profit is EBITDA, 6) Average excluding ONE, 7) Long Beach Container Terminal (LBCT) are excluded from Jul’18 persuant the decision to sell the terminal
DHL Global Forwarding | OFR Market Update | October 2019 11
11PUBLIC
B A C K- U P
12
12PUBLIC
Market Outlook October 2019 – Ocean Freight Rates Additional Trades (1/2)
OCEAN FREIGHT RATES OUTLOOK
EURO – AMLA No capacity issues. Rates remain stable until end 2019.
ME region shows same trend as ASPA; Additional blank sailings, combined with strong commodity demand put pressure on space and container
EURO – MENAT
availability. Space situation continues to be tight.
All South African ports are suffering with operational issues due to weather conditions, failure of cranes/equipment and structural issues. Rates
EURO – SSA
remain stable for now, but might increase as of Q1, 2020.
Rates are stable. No changes since slight decrease in September. Space continues to be tight out of USEC & USGC Ports on services to
AMNO – MENAT Middle East & India Subcontinent, but slightly better than August - September. October bookings are 1-2 weeks out from USEC and 2 weeks
out from Houston. No issues out of USWC.
AMNO – SSA Rates to South Africa and West Africa unchanged since the beginning of 2nd Q 2019. No changes in capacity. Space is available
AMNO – AMLA Overall soft market, driven by economic and political challenges in AR and BR, expected to hold through 2019. Rates are stable.
Equipment imbalance affecting drop off conditions in CO & CL.
13% VAT to be implemented on all haulage within Costa Rica.
AMLA Exports Space constraints w/weekly rolls at Callao Port.
Carriers introducing service to Posorja EC(deep water port).
Congestion continues at all t/shipment ports in Central America.
AMNO – ASPA carriers are looking for additional cargo for TPWB and are very aggressive in pricing and terms.
Source: DGF
DHL Global Forwarding | OFR Market Update | October 2019 13
13PUBLIC
Market Outlook October 2019 – Ocean Freight Rates Additional Trades (2/2)
OCEAN FREIGHT RATES OUTLOOK
EURO MED - AMNO Slight rate increases expected on selected lanes during October
EURO MED – AMLA Unchanged / stable
EURO MED – ASPA Slight rate increase expected depending on the service.
EURO MED – MENAT Slight rate increase expected depending on the service.
EURO MED – SSA Unchanged / stable
ASPA-SPAC Further blank sailing for week 40+41, will put pressure on space. Carriers have announced GRIs as of Oct 1 st.
Source: DGF
DHL Global Forwarding | OFR Market Update | October 2019 14
14PUBLIC
Market Outlook – Volume Outlook in Main Trade Lanes, 2019 Estimate &
2020/23 Growth Forecast in %
2019e, in mTEU 2020e-2023e CAGR, in %
N O R T H N O R T H
A M E R I C A A M E R I C A
I n c l . 4.3 mTEU +2.2% 7.6 mTEU +3.0% I n c l .
M E X I C O F A R E A S T M E X I C O
2.3 mTEU +1.5% 14.6 mTEU +3.8% 18.5 mTEU +3.4%
2.0 mTEU 1.5 mTEU
+3.9% +3.0% 1.7 mTEU +3.4% E U R O P E 7.3 mTEU +2.2% 1.7 mTEU +4.0%
L A T I N L A T I N
I n c l . M E D
A M E R I C A 0.4 mTEU +4.4% 4.4 mTEU +4.8% A M E R I C A
INTRA ASIA
excl. Oceania
40.7 mTEU +3.8%
GLOBAL CONTAINER TRADE 2019e 151.2 mTEU +3.9% CAGR 2020e-2023e
Mid-term growth is mainly driven by Asian tradelanes.
Source: Seabury Jun19 update
DHL Global Forwarding | OFR Market Update | October 2019 15
15PUBLIC
Carrier Mergers, Acquisitions and Alliances
M E R G E R S A N D A Q U I S I T I O N S
United Hyundai
China CMA Hapag Hamburg Maersk Yang
Cosco OOCL Evergreen APL Arab Merchant MSC K Line MOL NYK
Shipping CGM Lloyd Süd Line Ming
Shipping Marine
HYUNDAI
CHINA COSCO SHIPPING EVER CMA CGM MAERSK LINE OCEAN NETWORK YANG
HAPAG-LLOYD MERCHANT MSC
OOCL GREEN APL MARINE Hamburg Süd EXPRESS (ONE) MING
A L L I A N C E S
F O R M E R A L L I A N C E S P R E S E N T A L L I A N C E S
CMA CGM OOCL
MAERSK LINE CHINA SHIPPING MAERSK LINE OCEAN CMA CGM
2M OCEAN 3 2M
MSC UNITED ARAB MSC ALLIANCE CHINA COSCO SHIPPING
SHIPPING COMPANY EVERGREEN
HAPAG-LLOYD
HAPAG-LLOYD HYUNDAI COSCO
ONE
MOL MERCHANT EVERGREEN K-LINE
G6 MARINE CKYHE THE ALLIANCE YANG MING
NYK HANJIN YANG MING
OOCL SHPPING HMM (from 1 April
APL
2020)
*Source: Carriers
DHL Global Forwarding | OFR Market Update | October 2019 16
16PUBLIC
Acronyms and Explanations
AMLA - Latin America OWS - Overweight Surcharge
AMNO - North America PH - Philippines
AR - Argentina PNW - Pacific North West
ASPA - AsiaPacific Ppt. - Percentage points
BR - Brazil PSW - Pacific South West
CAGR - Compound Annual Growth Rate QoQ - Quarter on quarter
CENAC - Central Amercia and Caribbean SAEC - South America East Coast
CNC - CNC Line (Cheng Lie Navigation Co. Ltd.) SAWC - South America West Coast
DG - Dangerous Goods SOLAS - Safety of Life at Sea
DWT - Dead Weight Tonnage SPRC - South People’s Republic of China – South China
EB - Eastbound SSA - Sub-Saharan Africa
ECSA - East Coast South America (synonym for SAEC) SSL - Steam Ship Line
EGLV - Evergreen Marine Corp T - Thousands
EURO - Europe TEU - Twenty foot equivalent unit (20‘ container)
GRI - General Rate Increase TSA - Trans Pacific Stabilization Agreement
HMM - Hyundai USGC - US Gulf Coast
HL - Hapag-Lloyd US FMC - US Federal Maritime Commission
HSUD - Hamburg Süd USEC - US East Coast
HWS - Heavy Weight Surcharge USWC - US West Coast
IA - Intra Asia VGM - Verified Gross Mass
IPBC - India Pakistan Bangladesh Ceylon (= Sri Lanka) VLCS - Very Large Container Ship
IPI - Inland Point Intermodal VSA - Vessel Sharing Agreement
ISC - Indian Sub Continent (synonym for IPBC) WB - Westbound
MENAT - Middle East and North Africa WCSA - West Coast South America (synonym for SAWC)
ML - Maersk Line WHL - Wan Hai
mn - Millions WRS - War Risk Surcharge
MoM - Month-on-Month YML - Yang Ming Line
NOO - Non-operating (vessel) owners YoY - Year-on-Year
OCRS - Operational Cost Recovery surcharge YTD - Year-to-Date
OOCL - Orient Overseas Container Line
DHL Global Forwarding | OFR Market Update | October 2019 17
17You can also read