OCI N.V. Investor Presentation - February 2018

Page created by Cody Moore
 
CONTINUE READING
OCI N.V. Investor Presentation - February 2018
OCI N.V. Investor Presentation

February 2018
OCI N.V. Investor Presentation - February 2018
OCI N.V. Investment Highlights
                   Positive outlook: step-up of volumes and low capex requirement expected to result in significant cash generation

                                                        ▪ OCI’s total capacity to reach 14.3 mtpa1) in 2018
 Capacity Expansion Plan                                ▪ Iowa Fertilizer Company will have first full year of operations in 2018
 98% Complete                                           ▪ Natgasoline expected to start production in April 2018
                                                        ▪ BioMCN 2nd line on track to start commissioning in Q4 2018

                                                        ▪ Portfolio is equally split between fertilizers and industrial chemicals on indicative run-rate revenue basis
 Diversified across Products
 and Geographies                                        ▪ Diversified product portfolio benefits from increased proportion of higher margin downstream products
                                                        ▪ Geographic run-rate capacity diversification across USA, MENA and Europe

                                                        ▪ Access to low-cost feedstock, industry-leading efficiencies and infrastructure resulting in cost position in the
                                                          first quartile of the global cost curve
 Low Cost and Efficient
 Asset Base                                             ▪ Highly efficient plants with low usage of natural gas per ton produced relative to peers
                                                        ▪ Youngest average fleet relative to global peers with ~50% of production capacity under 5 years old

                                                        ▪ All plants are strategically located near end markets
 Strategic Locations with
 Strong Logistics Capabilities                          ▪ North African plants benefit from freight advantage to Europe (proximity and import duty exemption)
                                                        ▪ Centralized global sales and distribution platform

                                                        ▪ Strategic review of all financings with focus on optimising capital structure and lowering cost of debt

 Enhancing Capital Structure                            ▪ First steps have been taken:
 and Lowering Cost of Debt
                                                                ‒    IFCo: exchanged $425m of 2019/22 maturities for 2033/37 maturities, coupon reduced to 5.25%
                                                                ‒    OCIP: upsized TLB to $455m; pricing reduced by 250bps, extended maturity to 2025

 ________________________________________________________________                                                                                                            2
 1) Capacities do not take ownership stakes into account and maximum rates for downstream products cannot all be achieved at the same time
OCI N.V. Investor Presentation - February 2018
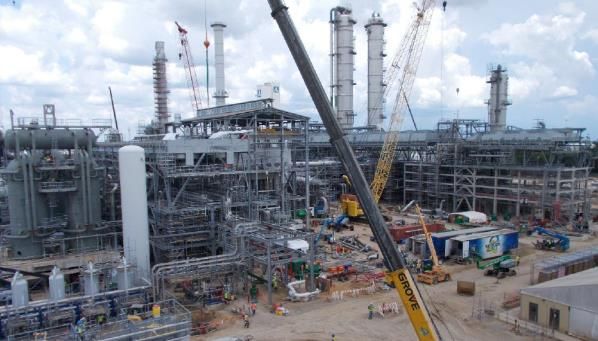
A 10-year Journey to Become a Globally Diversified Platform
                                                             2008                                                       2013                                           2019 run-rate1

        Site locations                                         1                                                           5                                                      8

                                                   Capacity: 1.3mtpa                                        Capacity: 7.5mtpa                                        Capacity: 14.3mtpa
                                                                                                                    USA                                     North
                                                                                                                    13%                                     Africa                              USA
                                                                                                                                                             28%                                39%
      Capacity split by                                                                                   Europe
        geography                                                                                          29%
                                                                        North                                                      North Africa
                                                                        Africa                                                        58%
                                                                        100%
                                                                                                                                                                     Europe
                                                                                                                                                                      33%

                                                                                                                                                                              DEF
                                                                                                                                                                     Melamine 3%           Sellable
                                                                                                                   Melamine                                            6%                 ammonia
                                                                                                                     12%           Sellable                                                 19%
                                                                                                                                  ammonia
                                                                                                          Methanol                  28%                     Methanol
                                                                                                            16%                                               30%
 Sales split by     product3,4                                                                                                                                                                  Urea
                                                                                                                                                                                                21%
                                                                                                            UAN
                                                                                                            6%                     Urea
                                                             Urea                                                                  18%
                                                             100%                                                    CAN                                                 UAN             CAN
                                                                                                                     20%                                                 12%             9%

   Replacement value2                                                                                                                                                         > $14bn

                                        Geographically diverse production footprint in premium commanding locations
 Source: Company information
 1 At 2019 production run-rates and spot prices as of February 8, 2018; includes 50% of Natgasoline; 2 Refers to value of OCI’s share of production assets; 3 Indicative revenue split excluding third-party   3
 traded product volumes. Excludes Melamine China. Includes 50% of Natgasoline; 4 2013 split based off average 2013 benchmark spot prices
OCI N.V. Investor Presentation - February 2018
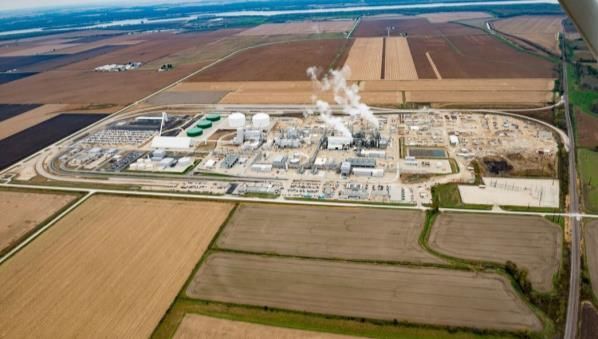
Global Positioning – Production Capacity Footprint
        OCI Partners LP (OCI Beaumont) – TX, US                                       BioMCN – Netherlands                OCI Nitrogen – Netherlands
▪ Acquired: 2011                                                       ▪ Acquired: 2015                      ▪ Acquired: 2010
▪ MLP: OCIP listed on NYSE                                             ▪ 100% owned                          ▪ 100% owned
   in 2013, 88.25% owned                                                    Product           ktpa           Product            ktpa
 Product         ktpa                                                       Methanol (I)       496           Ammonia (net)       350
 Methanol        912.5                                                                                       CAN                1,542
                                                                            Methanol (II)     438
 Ammonia          331                                                                                        UAN                 730
                                                                            (Line II under                   Melamine            219
                                                                            refurbishment,
                                                                            commissioning expected
                                                                            Q4 2018)                                   Egyptian Fertilizer Co (EFC) – Egypt
                                                                                                             ▪ Acquired: 2008
                                                                                                             ▪ 100% owned
                                                                                                             Product          ktpa
        Iowa Fertilizer Company (IFCo) - Iowa, US                                                            Urea             1,648

▪ Production and sales
   started April 2017                                                                                              Egypt Basic Industries Corp (EBIC) – Egypt
▪ 100% owned
Product             ktpa1                                                                                    ▪ Acquired: 2009
Ammonia (net)        195                                                                                     ▪ 60% owned
UAN                 1,566                                                                                    Product            ktpa
Urea                 437                                                                                     Ammonia             730
DEF                  820
                   Natgasoline LLC – TX, US                                                                                  Sorfert Algerie – Algeria
▪ First production                                                                                           ▪ Commissioned 2013
  expected April 2018                                                                                        ▪ 51% owned
▪ 50% owned                                                                                                  Product       ktpa
  Product          ktpa                                                                                      Urea          1,260
  Methanol         1,825                                                                                     Ammonia        800

                                              Production footprint facilitates a global approach to commercial strategy
  Source: Company information                                                                                                                                   4
  1 All lines cannot run simultaneously. This represents maximum capacity
OCI N.V. Investor Presentation - February 2018
Global Positioning – Leader in Fertilizers and Industrial Chemicals
                                                                                                        OCI NV Overview

        ▪ Globally competitive cost positions
        ▪ Advantageous positioning in the US Midwest, access to European in-land premium and strategic ports in North Africa

                                                 Fertilizers                                                                                        Industrial Chemicals

                     #4                              #2                                54                                        #1                      #5                  #1                      #1
                     Global                          CAN                             Countries                                 US and W.                Global            Global bio-               Global
                 producer by                      producer in                        sold to in                             Europe merchant           methanol            methanol                 melamine
                sellable design                     Europe                             2017                                     methanol             producer by           producer                producer
                    capacity                                                                                                   production           design capacity
                                                                                                                                capacity3

       25                                                                                                              10
                   20.8           16.9          11.1              9.6          6.8                6.0                              8.5        4.5                3.3       3.0           2.83           2.6
       20
                                                                Global Nitrogen fertilizer capacity1                   8                                                         Global methanol capacity2
       15                                                                                                              6
mtpa

       10                                                                                                       mtpa   4

       5                                                                                                               2

       0                                                                                                               0
                  Yara            CF      PCSNutrien
                                              / Agrium           OCI      Eurochem         QAFCO                              Methanex        CEL             Zagros    SABIC           OCI           MGC

            Source: Company information
            1 Capacities do not take ownership stakes into account. Ammonia is net sellable capacity, and includes OCIP ammonia. Downstream maximum capacities at IFCo and OCI Nitrogen cannot be achieved
                                                                                                                                                                                                              5
            simultaneously; 2 Global methanol capacity adjusted for ownership stakes; 3 OCI includes 50% of Natgasoline and BioMCN M2
OCI N.V. Investor Presentation - February 2018
State-of-the-Art Assets – Young Asset Age Compared to Peers

                OCI's capacity breakdown per vintage                                                                  Global ammonia capacity breakdown ex-China
                         (% of total capacity)                                                                                   (% of total capacity)

    OCI Nitrogen     BioMCN      EFC    EBIC     Sorfert    OCIP2   IFCo     Natgasoline
                                                                                                                                                         ~75% of global
                                                                                                                                                         capacity >20 years
                                                                                                                                                         old
                   Youngest asset base relative
                   to global peers with ~50% of
                   production capacity under 5                                   52%                                              36%
                   years old
                                                                                 12%
                                                                                                                27%

                                                                                 23%
                                                                                                                                                                   15%
                                                                                                                                                     14%
      17%
                                                              13%                                                                                                                9%
       6%
                         10%
                                            8%
                                                               2%                13%
       6%
                         10%                8%                10%
       5%                                                                         5%

    >40 years        30-40 years        20-30 years        10-20 years        0-10 years                     >40 years        30-40 years        20-30 years    10-20 years   0-10 years

▪ OCI maintenance capex projections account for approximately 4% of sales compared to c. 8-10% for peers1

       OCI’s age profile of assets competitive vs. industry, which allows for higher utilization rates and lower maintenance capex

Source: CRU, Fertecon, IFA, broker estimates                                                                                                                                               6
1 Peers include CF Industries, Eurochem, ICL, Methanex and Yara. Based off average 2018-2020 capex including growth capex; 2 Spent $800mm for refurbishing
OCI N.V. Investor Presentation - February 2018
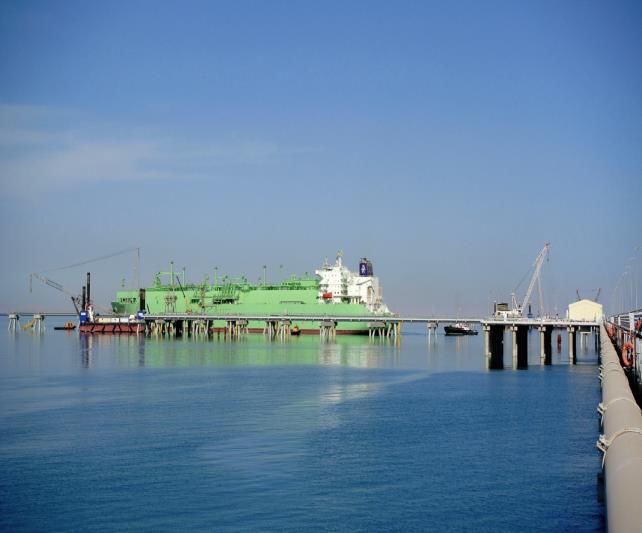
Strong Free Cash Flow Generation Directed Towards Deleveraging

         Increasing production capacity (million mtpa) 1) …
                                                          14.3
                             +59%
                                                                                      DEF
                                                                                      Melamine
                 9.0
                                                                                      Methanol                                ▪     Completion of major capex programs
                                                                                      UAN
                                                                                                                                    ‒     No remaining growth capex other than restart of
                                                                                      CAN
                                                                                                                                          mothballed second production line at BioMCN
                                                                                      Urea
                                                                                      Net ammonia                             ▪     Low maintenance capex of $150 – 200m per year
                                                                                                                              ▪     Significant step-up of operational cash flows from
                 2016                                     2018                                                                      higher volumes
                                                                                                                                    ‒     Start-up of new capacities in 2017 and 2018
                        … and decreasing capex ($ million)
                                                                                                                                    ‒     Return to high utilization of ammonia operations
      1,211
                                                                                                                                          in Egypt since July 2017
                     1,131
                                                                                                                                    ‒     Higher utilization at Sorfert expected in 2018
                                                                                                                                          following plant outage in 2017
                                     736

                                                                                      Expected on-
                                                                                          going
                                                                 150 - 200
                                                                                      maintenance
                                                     87
                                                                                       capex level
                                                                                      $150 - 200 m
      2014           2015           2016         H1 2017

                                                                                                                                                                                                       7
1.Capacities do not take ownership stakes into account and include maximum capacities for downstream products for Iowa Fertiliz er Company and OCI Nitrogen that cannot be produced at the same time
OCI N.V. Investor Presentation - February 2018
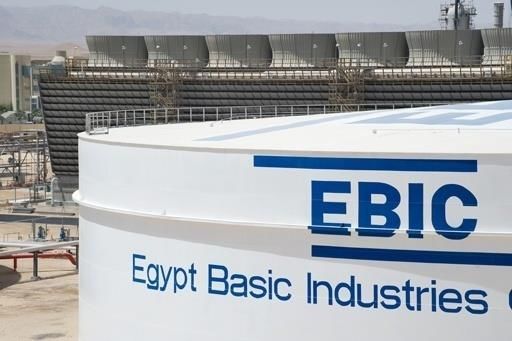
New Capacity Additions 2017 - 2018
             Iowa Fertilizer Co (IFCo)                                Natgasoline                                           BioMCN

▪ Completion date:                                 ▪ World-scale greenfield methanol plant:             ▪ Doubling capacity:
   – Started production and sales in April 2017        – 1.8 mtpa capacity in Beaumont, Texas              – Refurbishment of mothballed second plant
   – All products have achieved production in      ▪ Progress:                                               will add 438 ktpa of methanol to become
     excess of nameplate capacity                                                                            largest producer in Western Europe
                                                       – 95.8% complete as at 31 December 2017
                                                                                                        ▪ Expected completion:
▪ Flexible and diversified portfolio:                  – Expect first production in April 2018
  – c.2 mtpa of nitrogen fertilizer and DEF                                                                – Commissioning expected in Q4 2018
                                                   ▪ State-of-the-art technology:
▪ State-of-the-art technology:                                                                          ▪ Strategic location:
                                                       – Proven Lurgi MegaMethanol® process
  – KBR purifier ammonia technology allows for           technology provided supplied by Air Liquide       – Located at the Chemical Park Delfzijl in the
     gas-efficient production above nameplate            Global E&C Solutions                                Netherlands
  – Downstream technology: Stamicarbon and         ▪ Strategic US Gulf Coast location:                     – Connected to the national natural gas grid
     Uhde                                                                                                  – Easy logistical access to major European end
▪ Strategic location in heart of US Midwest Corn       – Ease of access to domestic US demand and
                                                                                                             markets via road, rail, barge and sea freight
                                                         international markets incl. Europe and Asia
  Belt:                                                                                                 ▪ Attractive market conditions:
                                                   ▪ Experienced management:
  – Logistics straight to customers
                                                                                                           – Well positioned to benefit from EU’s c.7
  – Region with the highest demand for nitrogen        – Benefits from operational expertise of its
                                                                                                             mtpa methanol supply deficit
    fertilizers in the US                                50/50 owners CEL and OCI - global leaders in
▪ Optionality for natural gas supply:                    methanol and petrochemicals

   – From both southern (Oklahoma) and
     northern (Chicago) markets
                                                                                                                                                            8
OCI N.V. Investor Presentation - February 2018
Egyptian Operations Returned to Normalized Run-Rates in 2017

    Egypt to again become self-sufficient in natural gas in
    2018 given significant recent gas discoveries

▪ Production from new gas fields, particularly ENI’s Zohr and BP’s West Nile
  Delta (WND) is ramping up
   ‒ WND fields started production in March 2017, 8 months ahead of
     schedule. When fully on stream, the fields are expected to reach
     production equivalent to ~30% of Egypt’s gas production
   ‒ Zohr, with potential resources in excess of 30 Tcf of gas in place, one
     of the world’s largest natural gas finds, has started production at 2017
     YE
                                                                                                                                                                                                 New jetty operational at Sokhna Port
▪ Egyptian Minister of Petroleum expects Egypt to be fully self-sufficient in
  gas production in 2018 and plans to achieve a surplus by 2020
▪ $15bn gas import contract with Israel announced in February 2018,
  confirming Egypt’s status as a net exporter
                                                                                                                      80

                                                                                       natural gas production (Bcm)
                                                                                                                      70                        Uptick in Egypt Natural Gas Production in 2017

    Strong performance in 2017, particularly after resumption                                                         60
    of ammonia exports from EBIC in July
                                                                                                                      50
▪ In 2016, EBIC gave the Egyptian government access to its export jetty to
  dock 2 FSRUs, allowing Egypt to import the required LNG to fulfil shortfall                                         40
  in domestic gas supply
▪ Egyptian Government built a replacement jetty, which was ready in June                                              30
  2017
▪ EBIC has regained access to its export jetty once again and plant has been                                          20

                                                                                                                                                       2004

                                                                                                                                                                                                        2011
                                                                                                                           2000
                                                                                                                                  2001
                                                                                                                                         2002
                                                                                                                                                2003

                                                                                                                                                              2005
                                                                                                                                                                     2006
                                                                                                                                                                            2007
                                                                                                                                                                                   2008
                                                                                                                                                                                          2009
                                                                                                                                                                                                 2010

                                                                                                                                                                                                               2012
                                                                                                                                                                                                                      2013
                                                                                                                                                                                                                             2014
                                                                                                                                                                                                                                    2015
                                                                                                                                                                                                                                           2016
                                                                                                                                                                                                                                                  2017
                                                                                                                                                                                                                                                         2018
                                                                                                                                                                                                                                                                2019
  running at rates in excess of 90% since then (above 100% utilization)
▪ EFC returned to full utilization and has achieved record production in 2017
  since inception

                                                                                                                                                                                                                                                                       9
     Source: Bloomberg, CRU, Reuters, Natural Gas Holding Company, company estimates
OCI N.V. Investor Presentation - February 2018
Fertilizer Prices Poised for Recovery in Tightening Market

                                         Ammonia NW Europe CFR ($/t)           Midcycle Average Ammonia           Urea Granular Egypt FOB ($/t)

   800                                   Midcycle Average Urea                 CAN CIF Germany (€/t)               Midcycle Average CAN

   600

   400

   200

      0
       2009                 2010                 2011            2012   2013             2014             2015   2016            2017             2018

   ▪ Current fertilizer benchmark prices are below historical mid-cycle prices, amongst the lowest prices since 2004
      – Partial recovery since June 2017, due to low inventories and demand growth
   ▪ Expected global urea capacity additions slowing to below demand growth
      – World population growth, urbanization (lower arable land), GDP growth and environmental push (DEF, ammonia scrubbing)
        continue to drive urea and nitrogen fertilizer demand growth
      – Supply additions have peaked
      – New global urea additions expected to be below demand growth trend on average in the next 4 years, tightening the market
      – Additional upside as a result of structural drivers, such as sustained reduced exports from key exporters (e.g. China, Trinidad)

Sources: CRU, adjusted using US CPI for inflation                                                                                                        10
Note: Mid-cycle averages exclude outlier prices in 2008 spike
Tightening of Global Nitrogen Supply-Demand to Support Fertilizer Market
                                                                            New global urea capacity start-ups excl. China (mtpa)
(millions of metric tons)                                                                                                          ▪       Capacity additions peaked in 2016 / H1 2017

    5.0                                                                                                                            ▪       Total incremental supply outside China 2018 – 2021 estimated at ~8
                   4.2                                                                                       Nigeria                       million tons, below expected incremental demand over that period:
    4.0                                              Demand trend growth ~>3 mtpa                            India                          ‒        Assuming no delays / cancellations, which are highly likely
                                                        10 year historical CAGR                              USA
    3.0                               2.8                                                                    Egypt                          ‒        Expected closure of PIC (~1.1 mt) in Kuwait and potential other old
                                                                                                                                                     capacity not reflected
                                                                            1.8                              Europe & CIS
    2.0                                                 1.7                                  1.6                                   ▪       Very limited spare capacity at operational plants
                                                                                                             Iran
    1.0                                                                                                      Indonesia                      ‒        Older plants likely to see reductions in utilization rate or even close
                                                                                                             Bolivia                                 down if not well-maintained
    0.0                                                                                                      Kuwait                         ‒        Outages are common in the industry due to planned turn-arounds,
                  2017               2018              2019                2020             2021                                                     technical issues or gas supply problems amongst other

                                                                                      Historical Chinese urea exports and pricing
           ('000 mtpa)                                                                                                      $/t        ▪        Chinese urea exports have declined by 66% 2015 - 2017 due to:

      16,000                                                                                                                 600                 ‒     Stricter environmental policies and inspections resulting in idling /
                                                                                                                                                       closure of urea plants and tightening of supply
                                                                                            13,555 13,748
      14,000
                                                                                                                             500                 ‒     High coal costs in China, resulting in higher break-even costs for
      12,000                                                                                                                                           producers
                                                                                                                             400
      10,000                                                                                                8,871                                ‒     Limited natural gas feedstock availability
                                                                                    8,265
        8,000                                              7,026            6,948                                            300       ▪        Chinese exports are expected to be structurally lower going forward, with
                                                                                                                                                potential rebounds in exports capped by environmental curtailments and
        6,000                      5,257
                                           4,360                                                                    4,656    200                increased focus on profitability of the industry
                                                   3,379           3,559
        4,000                                                                                                                          ▪        Potential increase in domestic demand in China to further tighten balance /
                 1,571 1,367                                                                                                 100                restrict exports:
        2,000

            0                                                                                                                0
                                                                                                                                                 ‒     Government’s proposal to implement nationwide ethanol policy by
                  2005      2006    2007    2008   2009    2010    2011     2012    2013    2014   2015     2016    2017                               2020, using corn as feedstock

                                   China Urea Exports ('000 tpa)               China Urea Prilled Bulk FOB ($/t)                                 ‒     Technical urea demand growth from diesel exhaust fluid
           ________________________________________________________________                                                                                                                                                    11
           Sources: CRU, Fertecon, International Fertilizer Association (“IFA”), company websites, and Company estimates
Industrial Chemicals Trajectory Highly Favorable
                 1,200                                                                                                                             2,000
                            Methanol US ($/t)                      Methanol Midcycle          Melamine NW Europe (EUR/t)     Melamine Midcycle
                                                                                                                                                   1,800
                 1,000
                                                                                                                                                   1,600

                                                                                                                                                   1,400
                  800

                                                                                                                                                           Melamine (€/t)
Methanol ($/t)

                                                                                                                                                   1,200

                  600                                                                                                                              1,000

                                                                                                                                                   800
                  400
                                                                                                                                                   600

                                                                                                                                                   400
                  200
                                                                                                                                                   200

                    0                                                                                                                              0
                     2007       2008                  2009              2011           2012          2013           2015      2016             2018

    ▪ Methanol outlook remains favorable
      – Methanol prices in 2017 significantly higher than in 2016, driven by supply-demand balance and MTO economics
      – Limited global new supply through 2020 once all projects are completed (of which Natgasoline and BioMCN 2nd line of 2.3Mt)
      – Demand growth expected at ~5% CAGR (excl. captive MTO/MTP) through 2020 driven by core derivatives (GDP growth), fuel applications, and
        MTO/MTP
      – DEF: consumption increasing due to continued environmental regulations on diesel in Europe and the US, DEF supply diverts capacity from fertilizers
    ▪ Melamine continues to outperform
      – Prices increased in 2016, 2017 and into 2018
      – Market expected to remain tight, demand growth remains solid

                                                                Outlook for methanol and melamine remains strong

Sources: Argus, adjusted using US CPI for inflation                                                                                                              12
Note: Mid-cycle averages exclude outlier prices in 2008 spike
Robust and Growing Global Methanol Market
 ▪     2017 global demand was c. 89 mt                                                               Global Methanol Capacity Additions 2017 - 2020
 ▪     The main drivers of growing methanol demand include
                                                                                         Company                                 Plant Name/ Location   Capacity (k MT)    Startup
       Chinese chemical self-sufficiency, increased construction
                                                                                         OCI N.V                                    Natgasoline, TX         1,825            2018
       activity, MTO application and use as a transportation fuel
                                                                                         Kaveh Methanol Co                             Dayyer, Iran         2,300            2018
 ▪     Chinese MTO/MTP will continue to drive demand growth
                                                                                         OCI N.V                                 BioMCN, Netherlands         438             2018
       and methanol affordability determining price cap
                                                                                         Caribbean Gas Chemical Ltd               Trinidad & Tobago         1,000            2019
 ▪     Additional demand (excluding CTO) expected to outstrip
                                                                                         Merchant capacity China                         Various         3,000 - 4,000    2017 - 2020
       new supply to market between 2017-2020
                                                                                         Total New Supply 2017-2020                                     c. 8.5 – 9.5 mt

                                                                                         Total Additional Demand                                           c. 11 mt

              2017 Global Methanol Demand by Derivative                                                         World Demand Growth (2012 – 2026E)

                                                                                          (millions of metric tons)

                                       Others
                                        7%                                                                                                                            132 136
                                                                                                                                                      121 124 126 129
                                                                                                                                              115 118
                                                 Formaldehyde                                                                           109
                            Methanol-to-             25%                                                                          98
                              Olefins                                                                                  85   89
                               23%                                                                                78
                                                                                                           73
                                                                                             60     65
                                                         Acetic Acid
                                                            8%
                             Fuel Applications
                                   21%            MTBE             Methylamines
                                                  12%                  2%
                                                                Methyl Methacrylate
                                                                        2%

Red = GDP-core - 44%
Blue = Fuel/Energy - 33%
                                           Note: Total demand ~ 89 million metric tons
Grays = Methanol to olefins = 23%
___________________________________                                                                                                                                                  13
Source: OCI , Argus
Significant Methanol Growth Expected from Multiple End-Use Applications
                                                                                                                      MTO / MTP Demand Growth
                    ▪ MTO / MTP demand grew at 34% CAGR from 2012-2017 and is
                      forecasted to develop at an average rate of 13% through 2022                    (mm t)
                                                                                                                                                39.2
                                                                                                      40.0
                       – China’s effort to be chemical self-sufficient has prompted the
  MTO / MTP              development of a wide range of innovative production applications,           30.0
  Expansion              specifically the creation of MTO and MTP production facilities                                         21.1
    (23%1)                                                                                            20.0
                       – Over the coming five years, China is expected to further develop its MTO
                         / MTP capacity to meet its growing demand for chemicals and plastics         10.0     4.9

                                                                                                       0.0
                                                                                                               2012            2017          2022
                                                                                                                  Formaldehyde Demand Growth
                    ▪ Formaldehyde demand expected to grow at 3.4% CAGR through 2022 (vs.             (mm t)

                      4.0% 2012-2017)                                                                 40.0
                                                                                                                                                28.6
                       – Formaldehyde is an essential input into paints, adhesives, textiles,         30.0
 Formaldehyde            automobile parts and laminates/wood products                                                           22.4
                                                                                                               18.4
    (25%1)                                                                                            20.0
                       – Expected further growth of housing starts in the US as well as continued
                         development of Asian construction market                                     10.0
                       – Accounts for 25% of world demand in 2017, and is forecast to remain           0.0
                         one of methanol’s single largest end uses by 2022                                     2012             2017            2022
                    ▪ Methanol’s use in fuel applications and gas blending will continue to grow
                      with expanding population and automobile demand (4.4% through 2022)                      Fuel & Gas Blending Demand Growth
                                                                                                      (mm t)
                       – While China has yet to adopt the M15 standard, methanol blending is
                         already widely practiced in many provinces of the country and is expected    40.0
     Fuel
 Applications            to continue through 2022                                                     30.0
                                                                                                                                                23.4
 and Gasoline          – Additional opportunities for demand growth include tightening Chinese                                  18.9
   Blending              environmental restrictions                                                   20.0     14.1
    (21%1)             – Use of methanol as a marine fuel (low capex cost and cleaner fuel relative   10.0
                         to diesel and heavy fuel oil)
                       – Methanol is used as a gasoline blend in other countries including             0.0
                         Australia, Israel and the UK                                                          2012             2017            2022

 Source: MMSA Report and IHS Markit; 1 % of 2017 global methanol demand                                                                                14
Fast-Growing DEF Segment in the US, Europe and China
                                                                                                              ▪   Increase in DEF consumption on the back of
                                Billion gallons
                                                                                                                  environmental constraints on diesel in Europe and
                                Forecasts
                                                                                                                  the US

                                                                                                1.44   1.48
                                       15% CAGR                                   1.37   1.41                     ‒    Introduction of Greenhouse Gas standards in
                                                                           1.31                                        the US
                                                                    1.24
Historical and                                               1.15
                                                      1.05
forecast North                                 0.95                                                               ‒    Implementation of recent US environmental
                                        0.84                                                                           standards states that new commercial vehicles
 America DEF                    0.70
                         0.59                                                                                          be equipped with SCR technology (requiring
 consumption                                                                                                           DEF)

                                                                                                                  ‒    In China, China V regulation implemented since
                                                                                                                       2017 and China VI currently being discussed

                         2016 2017 2018 2019 2020 2021 2022 2023 2024 2025 2026 2027                          ▪   DEF demand over the next decade is mainly
                                                                                                                  supported by replacement of older non SCR-
                                                                                                                  equipped vehicles in the US and in Europe
                                Billion gallons
                                Forecasts                                                                         ‒    This trend is expected to continue until 2030

                                                                                                       1.80   ▪   The Gulf Coast and the Midwest remain the largest
                                                                                                1.72
Historical and                                                                           1.63                     DEF markets in North America
                                       15% CAGR                                   1.54
                                                                           1.41
   forecast                                                         1.28                                      ▪   DEF supply is mainly driven by existing capacity
                                                             1.17
  European                                            1.03                                                        from urea producers diverted from fertilizers
                                               0.92
    AdBlue                              0.79                                                                      rather than new capacity
                                0.68
consumption              0.57
                                                                                                                  ‒    On the back of capped urea agricultural
                                                                                                                       demand in China due to an effort on pollution
                                                                                                                       control, an increasing share or urea is used for
                                                                                                                       DEF (from 100kMt in 2016 to an expected
                                                                                                                       6,000kMt by 2020)
                         2016 2017 2018 2019 2020 2021 2022 2023 2024 2025 2026 2027

                         DEF priced at premium with prices at pump (refill) averaging above $1,200/ton on urea basis

                                                                                                                                                                       15
 Source: Integer, PADD
Growing Melamine Market at Stable Prices
                        Main melamine manufacturers outside China – % global
                        capacity                                                                          ▪   13% market share in 2017 (1,525kt of demand in 2017)
                                                                                                          ▪   OCI Nitrogen is the global leader in melamine, with the largest
                           11%                                                                                single line melamine plant in the world
OCI Nitrogen                           9%
                                                                                                          ▪   Although China is the largest market participant and continues to
   is the
                                                     6%                                                       build capacities, Chinese producers are fragmented (more than
  world’s                                                             5%                                      25, mostly smaller melamine producers)
  leading                                                                            4%        4%

producer of                                                                                                   ‒   In 2016 China accounted for 65%, 55%, and 50% of world
                                                                                                                  capacity, production, and exports, respectively
 melamine
                                                                                                              ‒   Actual production in 2016 of ~ 800 kt, versus name plate

                                                                                               Eurochem
                                                     Grupo Azoty
                            OCI

                                       Borealis

                                                                     Cornerstone

                                                                                     Qafco
                                                                      Chem. Co
                                                                                                                  capacity (NPC) of ~1600kt
                                                                                                              ‒   World melamine consumption is driven by China (37%), EMEA
                                                                                                                  (35%) and APAC (19%)

                        Global GDP growth (%)                                                                 ‒   Anti-dumping measures against Chinese melamine imports
                                                                                                                  in the EU-28 and in the US have been put in place until at
                                                                                                                  least the end of 2020 and 1 July 2022 respectively
   Global             4.0%
                                                                                                          ▪   Aside from relatively small projects in India and Russia, no new
  melamine                                                                                                    melamine production capacity expansions have been
  demand                                                                                                      announced outside China
 growth has
 historically         3.5%                                                                                ▪   Melamine prices are based on supply & demand dynamics and
                                                                                                              fluctuate less strongly than commodity prices determined by
  followed                                                                                                    feedstock costs
 global GDP
   growth                                                                                                 ▪   Demand will mainly be driven by strong underlying economic
                      3.0%                                                                                    growth and solid demand from the construction and
                                  2017            2018             2019            2020      2021             automotive industries

  Sources: IMF, IHS, company reports                                                                                                                                            16
Appendix
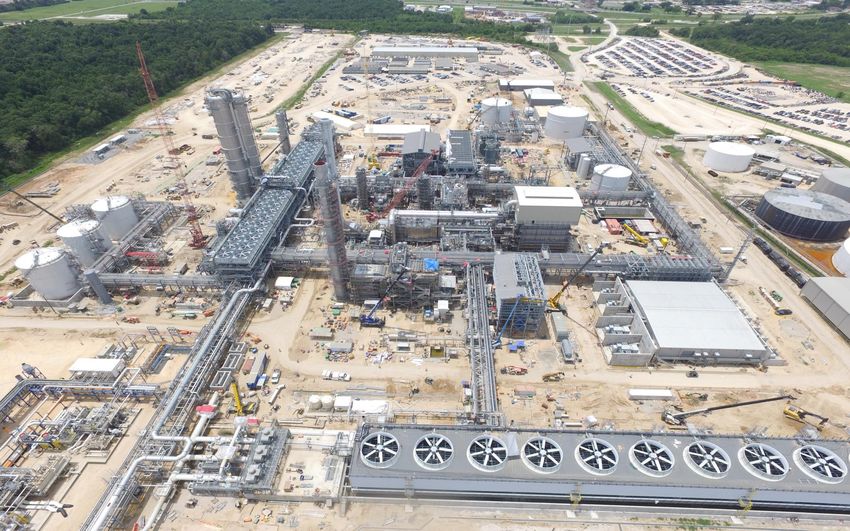
Iowa Fertilizer Company | Aerial Site
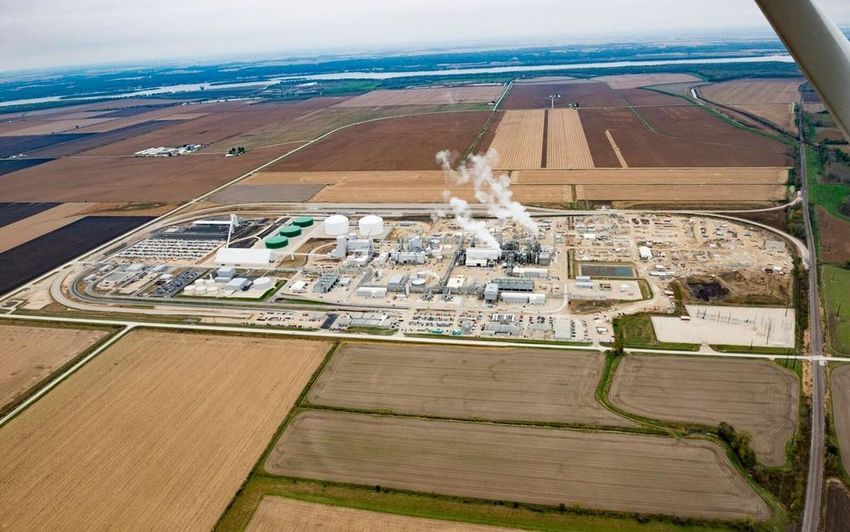
                                        18
Natgasoline | Aerial Site

                            19
Global Distribution Network
 Global trading platform capable of moving more than 2 mtpa creates additional volume security and room to grow market share

                                                   Global Distribution and Logistics Infrastructure
                                                           Port access both east and west of Suez Canal
                                                           ▪ Arzew and Bethouia (Algeria), Sokhna (Egypt), Rotterdam (Netherlands), US Gulf
                                                           ▪ Leased ammonia vessel through 2018
     Production                                            ▪ North African assets have freight time and cost advantage over other producers to Europe
                                                             and Americas
     Storage                                                  – Freight routes don’t incur any charges v. Arab Gulf producers who pay Suez Canal fees
     Distribution / JVs                                       – No import duty into EU or US

     Agents*                                               Access to major waterways in Europe
                                                           ▪ Stein harbour directly links to Rotterdam, Terneuzen, Antwerp, Ghent
                                                           ▪ River connections to Belgium, France, Netherlands and Germany

                                                           Rail access in NL and USA
                                                           ▪ 250 rail tank cars available on-site at OCIN – largest fleet in Europe
                                                           ▪ 476 rail tank cars available on-site at IFCO
                                                           Ability to truck across markets
                                                           ▪ Dedicated loading arms at each site for key products enable efficient trucking

                                                           Direct pipelines
                                                           ▪ Direct pipeline access to key ports, harbors and customers                       20

 * External agents also in CIS countries
Production Capacity Overview
Max. Proven Capacities¹                                                                                                                             Total                                     Total
('000 metric tons)                                                                                                                         Fertilizer For                              Fertilizer &
                                                                                                                                                     Sale                               Chemicals
                                                                                                                                                                                          For Sale
Plant                            Country             Ownership2       Ammonia Ammonia               Urea           UAN4           CAN                       Methanol Melamine5   DEF
                                                                        Gross    Net3

Egyptian Fertilizers Company     Egypt                   100%                876             -     1,648                -             -            1,648           -         -     -         1,648

Egypt Basic Industries Corp.     Egypt                    60%                730         730             -              -             -              730           -         -     -           730

OCI Nitrogen                     Netherlands             100%              1,184         350             -           730         1,542             2,622           -       219     -         2,841

Sorfert Algérie                  Algeria                  51%              1,606         803       1,259                -             -            2,062           -         -     -         2,062

OCI Beaumont6                    USA                    88.25%               357         357             -              -             -              357         913         -     -         1,269

BioMCN7                          Netherlands             100%                    -           -           -              -             -                 -        934                           934

Iowa Fertilizer Company8         USA                     100%                883         195         437           1,566              -            2,198           -         -   820         3,018

Natgasoline LLC                  USA                      50%                    -           -           -              -             -                 -      1,825         -     -         1,825

Total MPC                                                                  5,636       2,435       3,344           2,296         1,542            9,618        3,671       219   820       14,328

 ▪ Current total MPC is 12.1 million metric tons:
        ➢ BioMCN capacity includes second methanol line, expected to start commissioning in Q4 2018
        ➢ Natgasoline expected to start production in April 2018
___________________________________
¹ Capacities are maximum proven daily capacity (MPC) achievable x 365 days. Natgasoline LLC capacities are estimates based on 5,000 tpd
² Capacities in table not adjusted for OCI’s stake in considered plant
³ Net ammonia is estimated remaining capacity after downstream products are produced
⁴ Excludes EFC UAN swing capacity of 325 ktpa; OCI Nitrogen max. UAN capacity cannot be achieved when producing max. CAN capacity
⁵ Split as 164 ktpa in Geleen and 55 ktpa in China (Chinese capacity does not account for 49% stake and exclusive right to off-take 90%)
⁶ OCI Beaumont debottlenecking initiative completed in April 2015
⁷ Acquired June 2015, second line currently being refurbished
⁸ IFCo capacities apart from net ammonia are maximum capacities and cannot all be achieved at the same time

                                                                                                                                                                                              21
Disclaimer

NOT FOR RELEASE, PUBLICATION OR DISTRIBUTION IN WHOLE OR IN PART, IN, INTO OR FROM ANY JURISDICTION WHERE TO DO SO WOULD
CONSTITUTE A VIOLATION OF THE RELEVANT LAWS OF SUCH JURISDICTION. THIS DOCUMENT IS NOT AN OFFER TO SELL SECURITIES OR THE
SOLICITATION OF AN OFFER TO BUY SECURITIES IN THE UNITED STATES OR ANY OTHER JURISDICTION.

This document has been provided to you for information purposes only. This document does not constitute an offer of, or an invitation to invest or
deal in, the securities of OCI N.V.

Certain statements contained in this document constitute forward-looking statements relating to OCI N.V. (the "Company"), its business, markets
and/or industry. These statements are generally identified by words such as "believe," "expect," "anticipate," "intends," "estimate," "forecast,"
"project," "will," "may," "should" and similar expressions. Forward-looking statements involve known and unknown risks, uncertainties and other
factors, many of which are outside of the Company's control and are difficult to predict, that may cause actual results to differ materially from any
future results expressed or implied from the forward-looking statements.

The forward-looking statements contained herein are based on the Company's current plans, estimates, assumptions and projections. Various
factors could cause actual future results, performance or events to differ materially from those described in these statements. The Company does
not make any representation as to the future accuracy of the assumptions underlying any of the statements contained herein. The information
contained herein is expressed as of the date hereof and may be subject to change. Neither the Company nor any of its controlling shareholders,
directors or executive officers or anyone else has any duty or obligation to supplement, amend, update or revise any of the forward-looking
statements contained in this document.
For OCI N.V. investor relations enquiries contact:

Hans Zayed
hans.zayed@oci.nl
T +31 (0) 6 18 25 13 67

OCI N.V. corporate website: www.oci.nl
You can also read