THE BURDEN OF LIVER DISEASE IN EUROPE - A REVIEW OF AVAILABLE EPIDEMIOLOGICAL DATA
←
→
Page content transcription
If your browser does not render page correctly, please read the page content below
The Burden
of liver disease
in Europe
 A review of available epidemiological data

Martin Blachier, Henri Leleu, Markus Peck-Radosavljevic,
Dominique-Charles Valla and Françoise Roudot-Thoraval

2013
2    EUROPEAN ASSOCIATION FOR THE STUDY OF THE LIVER	EASL

Table of contents

Table of contents                                            2

FIGURES                                                      3

TABLES                                                       4

Overview                                                     5

Introduction                                                 6

Methods                                                      7

Results
     Cirrhosis                                               8

     Primary liver cancer                                12

     Liver transplantation                               16

     Alcohol and liver disease                           19

     Hepatitis A                                         22

     Hepatitis B                                         25

     Hepatitis C                                         28

     Hepatitis D                                         30

     Hepatitis E                                         31

     Non-alcoholic fatty liver disease (NAFLD)           32

     Drug induced liver injuries (DILI)                  36

     Haemochromatosis                                    37

     Autoimmune hepatitis                                40

     Primary biliary cirrhosis (PBC)                     41

     Primary sclerosing cholangitis (PSC)                42

ConclUsion                                               43

references                                               48
The burden of liver disease in Europe – a review of available epidemiological data 3
Figures
Fig. 1 Liver cirrhosis mortality in Mediterranean countries and in Hungary, males 20- 9
64 years, WHO.
Fig. 2 Age-standardized death rates per 100,000 population from liver cirrhosis in 11
European countries, males and females aged 20–64; WHO Mortality Database
2000-2002.
Fig. 3 Estimated age-standardized incidence rates of liver cancer per 100,000 in 15
2008; WHO, GLOBOCAN, 2008.
Fig. 4 Estimated age-standardized mortality rates per 100,000 for liver cancer in 15
2008; WHO, GLOBOCAN, 2008.
Fig. 5 Number of liver transplantations in European countries, May 1968 to December 16
2009; ELTR.
Fig. 6 Growth in the annual numbers of liver transplants in Europe. 17
Fig. 7 Primary liver diseases leading to liver transplantation in Europe, January 1988 18
to December 2009.
Fig. 8 Primary indications for liver transplantation in Europe among patients with 18
cirrhosis, January 1988 to December 2009.
Fig. 9 Mortality from alcohol-related liver diseases among men in European countries 19
in 2005; WHO 2010.
Fig. 10 Mortality from alcohol-related liver diseases among women in European 20
countries in 2005, WHO 2010.
Fig. 11 Alcohol consumption in Europe in 2005; WHO. 20
Fig. 12 Alcohol consumption in Europe between 1990 and 2006; WHO 2010. 21
Fig. 13 Hospitalisation for hepatitis A, incidence per 100,000 inhabitants in Europe; 22
EUROHEP.NET.
Fig. 14 Incidence rates of hepatitis B in EU27 countries in 2005; ECDC 2007. 26
Fig. 15 Primary indications for liver transplantation in Europe among patients with 29
virus-related liver disease (January 1988 to December 2009).
Fig. 16 Obesity rates among populations of European countries; OECD Health data 34
2008.4 EUROPEAN ASSOCIATION FOR THE STUDY OF THE LIVER EASL
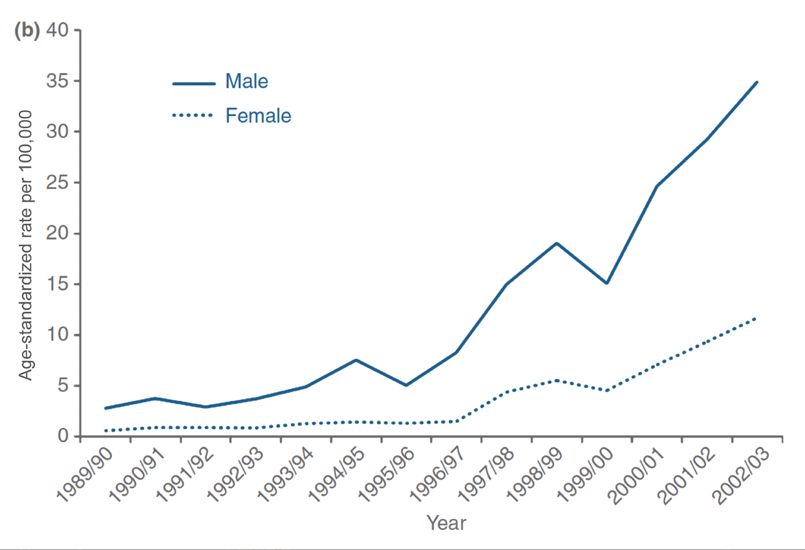
Fig. 17 Hospital admissions attributed to haemochromatosis in England from 38
1989/1990 to 2002/2003. (a) Age-standardized in-patient admission rate per
100,000 per year. (b) Age-standardized day-case admission rate per 100,000
per year.
Fig. 18 Primary indications for liver transplantation in Europe among patients with 42
cholestatic diseases, January 1988 to December 2009.
TABLES
Table 1 European studies assessing the prevalence or incidence of liver cirrhosis. 10
Table 2 European studies assessing incidence of primary liver cancer. 14
Table 3 Incidence rates of HAV infection in Europe. 23
Table 4 Prevalence rates of HAV infection in Europe. 24
Table 5 Age-specific HBV seroprevalence in European countries. 26
Table 6 HBV incidence in Europe. 27
Table 7 Seroprevalence of chronically HBV-infected patients in Europe. 27
Table 8 HCV prevalence in Europe. 29
Table 9 European studies assessing the prevalence of NAFLD. 35
Table 10 European studies assessing the prevalence and incidence of autoimmune 40
hepatitis.
Table 11 Incidence of liver diseases per 100,000 inhabitants per year in Europe (where 44
data is available).
Table 12 Prevalence (%) of liver diseases in Europe (where data is available). 45
Table 13 Inter-country comparison of the number of deaths associated with selected 46
diseases compared to liver diseases based on death certificates (age-
standardized); WHO, 2008.
Table 14 Inter-country comparison of the prevalence of HBV, HCV and HIV. 47The burden of liver disease in Europe – a review of available epidemiological data 5
Overview
The past 30 years have witnessed major progress Chronic viral hepatitis B is the second major cause
in the knowledge and management of liver disease, of both cirrhosis and liver cancer. Between 0.5%
yet approximately 29 million people in the European and 0.7% of the European population is affected
Union still suffer from a chronic liver condition. by chronic hepatitis B, with the highest prevalence
Difficulties in accessing data from individual countries being recorded in Romania (5.6%) and Greece
hinder global evaluation of liver disease in Europe. (3.4%). By comparison, HIV prevalence is only
This report reviews 260 epidemiological studies 0.2% (HIV is 50-100 times less infectious). The
published in the last five years to survey the current availability of a vaccine has resulted in a decrease
state of evidence on the burden of liver disease in in the prevalence of HBV, although it remains
Europe and its causes. responsible for 30% of cases of cirrhosis and 15%
of cases of primary liver cancer.
The incidence and prevalence of two conditions,
cirrhosis and primary liver cancer, are key to Chronic hepatitis C is an important risk factor for
understanding the burden of liver disease. They hepatocellular carcinoma, which develops several
represent the end-stage of liver pathology and thus decades after infection. Since the discovery of
are indicative of the associated mortality. Literature the virus in the late eighties, the number of new
on the prevalence and incidence of cirrhosis is cases of infection has dropped substantially.
scarce. However, available data suggest that Prevalence rates of hepatitis C virus (HCV) infection
about 0.1% of the European population is affected in the last decade in the European population were
by cirrhosis, corresponding to 14-26 new cases between 0.13 and 3.26%, the highest rates being
per 100,000 inhabitants per year or an estimated found in Italy and Romania. These HCV-infected
170,000 deaths per year [2]. There are, however, populations will develop complications in the years
large intra-European variations. About 0.1% of to come, leading to a substantial increase in the
Hungarian males will die of cirrhosis every year burden of disease. It is of great concern that about
compared with 0.001% of Greek females. 90% of people in Europe infected by viral hepatitis
are unaware of their status.
Hepatocellular carcinoma (constituting 70-90%
of cases of primary liver cancer) is the fifth most Non-alcoholic fatty liver disease (NAFLD) is
common cause of cancer in Europe and one of becoming a major concern with the increasing
the most serious outcomes of cirrhosis. European incidence of obesity in Europe. In this condition,
epidemiological data show that there are 1-13 new accumulation of fat in the liver leads to chronic liver
cases of hepatocellular carcinoma and 1-10 deaths disease. Available data suggest the prevalence
per 100,000 inhabitants per year. WHO estimate rate of NAFLD is 2–44% in the general European
that liver cancer is responsible for around 47,000 population (including obese children) and 42.6–
deaths per year in the EU. 69.5% in people with type 2 diabetes. NAFLD
increases the risk of cirrhosis and liver cancer.
The four leading causes of cirrhosis and primary liver
cancer in Europe are harmful alcohol consumption, Each of these four major causes of liver disease
viral hepatitis B and C and metabolic syndromes is amenable to prevention and treatment, reducing
related to overweight and obesity. the burden of liver disease in Europe and saving
lives. However, epidemiological data are scarce.
Chronic alcohol consumption is the main cause Additional surveys are urgently needed to provide
of cirrhosis in Europe. Alcohol consumption reliable information, without which it will not be
decreased in the 1990s, but has increased again in possible to implement cost-effective prevention
the last decade to stabilize at a high level of >9 litres programmes and novel treatments to tackle liver
of pure alcohol per year on average, although there disease and avoidable deaths in Europe.
are large variations among European countries.6 EUROPEAN ASSOCIATION FOR THE STUDY OF THE LIVER EASL Introduction The past 30 years have witnessed major progress in the knowledge and management of liver disease yet approximately 29 million persons in the European Union still suffer from a chronic liver condition. Difficulties in accessing data from individual countries hinder comprehensive evaluation of the burden of liver disease in Europe and comparison with other diseases. Moreover, very few reviews have studied both chronic liver conditions, such as cirrhosis and cancer, and their major causes, such as viral hepatitis, alcohol intake and metabolic syndrome. It is likely that the causes of chronic liver diseases differ from country to country but no reliable data exist about this. A large systematic review of all epidemiological data available for European countries has hitherto not been undertaken. Here we review evidence of the burden and causes of liver disease in Europe, drawing on a survey of all epidemiological data published over the course of the last five years.
The burden of liver disease in Europe – a review of available epidemiological data                    7

Methods

MEDLINE, EMBASE, and the Cochrane Library             All available data on liver disease incidence and
were searched for relevant articles using the         prevalence and on associated mortality and
following medical subject headings (MeSH)             trends were extracted from the reviewed articles.
terms ‘liver’ and [‘disease’ or ‘epidemiology’].      Most mortality statistics were derived from official
The search encompassed articles published             causes of death recorded on death certificates.
throughout the last five years in any European        Of 4,256 reviewed studies, 260 met the inclusion
language. Studies were included if: (1) they          criteria.
presented epidemiological data; (2) they included
patients who lived in the European Union (EU27)       The European Liver Transplant Registry (ELTR)
or Norway (but not necessarily exclusively so); (3)   was used to describe the epidemiology of liver
they were published or accepted for publication       transplantation in Europe as it represents more
as full-length articles. Studies were excluded if:    than 95% of all official published European data
(1) they estimated prevalence or incidence from       (Fig. 5, page 16).
data collected before 1995; (2) they studied very
specific populations; (3) they were published         Geographical factors necessitate caution in
only in abstract form so that the methodological      the interpretation of parts of this review for two
quality could not be assessed. When the results       reasons: (1) inter-country variation in death-
of a single study were reported in more than one      reporting processes; therefore caution must be
publication, only the most recent and complete        exercised when making comparisons between
data were included in the systematic review.          countries; (2) the definition of the European zone
                                                      varies according to the source, so care must
A manual search of references cited in retrieved      be taken when assessing data reported at the
articles was also conducted to identify studies       European level. According to WHO, European
not found in the database search. Data presented      countries include all eastern and central European
in World Health Organization (WHO) reports, in        countries as well as the Russian Federation. By
European Centre for Disease Prevention and            contrast, data given for the EU27 refer only to
Control (ECDC) reports and on EUROHEP.NET             countries that belong to the European Union.
were also included.
8 EUROPEAN ASSOCIATION FOR THE STUDY OF THE LIVER EASL
Results
Cirrhosis
According to WHO, liver cirrhosis accounted Union countries such as Estonia, Latvia, Lithuania
for 1.8% of all deaths in Europe (using WHO’s and Poland). For the reasons already stated, it is
wide geographical definition), causing around difficult to compare mortality rates from one country
170,000 deaths per year. In the last decades of to another, but the trends are unmistakable. In
the 20th century, a very strong east-west gradient contrast, in the Mediterranean region (France, Italy,
in mortality rates was observed, with the level of Spain, Portugal and Greece) appreciable declines
liver cirrhosis mortality in south-eastern Europe in cirrhosis mortality were observed in populations
(especially in Hungary and Moldova but also in that historically had the highest cirrhosis mortality
Slovakia, Slovenia and Romania) and in north- levels in both sexes. HBV vaccine, reduced alcohol
eastern European countries achieving rates never consumption and reduction of HCV transmission
before seen in Europe [1, 2] (figs. 1 and 2, see page have probably contributed to this decrease. A recent
9 and 11). However, in recent years, liver cirrhosis French study might appear to buck this trend, finding
has also become a serious health threat in some 0.3% of screened males aged more than 40 years
Western European countries, such as the United old to have liver cirrhosis [5]. However, these results
Kingdom and Ireland, where over the last 10 years should be interpreted with caution as the subjects
the associated mortality has increased. were seen within a free screening programme and
therefore were potentially at high risk of liver fibrosis
Alcohol has long been identified as the strongest [5]. The associated causes of liver disease in this
risk factor for liver cirrhosis [3, 4]. In fact, cirrhosis study were a combination of alcoholic and NAFLD
mortality has traditionally been used as a valid (66%), NAFLD only (13%), alcohol (9%), HCV
indicator for tracing the health consequences of (6%), and other causal factors (6%) [5]. Factors
alcohol abuse. However, infections by the hepatitis independently associated with fibrosis were age,
B and C viruses (HBV and HCV) are also important male gender, waist circumference, presence of
determinants of cirrhosis, and their possible HCV antibody and alcohol consumption [5]. These
contribution to temporal trends should be taken results suggest that alcohol and NAFLD are two
into account. Zatonski et al. studied the temporal causal factors with the potential to keep levels of
trends of liver cirrhosis in European countries, liver cirrhosis relatively high in western European
based on the WHO mortality database (http://data. countries.
euro.who.int) [2]. Radical increases in liver cirrhosis
mortalities were observed from the 1970’s within a Among north European countries, there was
group of several South-Eastern European countries. about a two-fold increase in cirrhosis rates in the
Hungary was an especially dramatic example. UK and Ireland until the 1990s, according to the
From the mid-1970’s to the mid-1990’s, cirrhosis WHO mortality database [2]. This is confirmed by a
mortality rates in Hungary increased from 20 to 148 study based on the UK General Practice Research
per 100,000 males (the highest level ever registered Database (GPRD), where the prevalence of liver
in any European country) and from about 8 to 48 cirrhosis increased by almost 50% between 1992
per 100,000 females [2]. By 2002 these rates had and 2001 to 76.3 per 100,000 persons (Table 1,
slightly declined to 103 per 100,000 males and 32 page 10) [6]. In another UK study, the incidence rate
per 100,000 females [2]. Another group of countries of cirrhosis was 26 per 100,000 women between
in which dramatic changes were observed were the 1996 and 2005 [7]. In a nationwide, population-
North-Eastern European countries (former Soviet based registry study in Denmark, liver cirrhosisThe burden of liver disease in Europe – a review of available epidemiological data 9
prevalence remained high between 1996 and 2005 stable incidences of the disease were reported
[8]. In 2005, the alcoholic cirrhosis incidence rates in the published studies (Table 1, page 10). In
were 26.5 (25.7-17.4) and 11.8 (11.2-12.4) per Mediterranean countries, alcohol consumption and
100,000 per year for men and women, respectively, the obesity epidemic threaten to halt the recently-
and the prevalence rates were 132.6 (130.7-134.5) improving trend in liver cirrhosis prevalence, or
and 70.1 (68.8-71.5) per 100,000 for men and even to reverse it. Amongst northern European
women, respectively. In Sweden, liver cirrhosis countries such as Denmark and Sweden, liver
incidence was close to that of Denmark, estimated cirrhosis prevalence has not decreased and still
at 15.3 ± 2.4 per 100,000 inhabitants, and did not represents a non-negligible factor of morbidity and
decrease between 1996 and 2005 [9]. mortality. Finally, in the UK and Ireland, all studies
agreed on the worrying increase in the incidence of
In summary, liver cirrhosis is responsible for liver cirrhosis.
1-2% of all deaths in most European countries
according to the WHO database. Increasing or
Fig. 1 – Liver cirrhosis mortality in Mediterranean countries
and in Hungary, males 20-64 years, WHO [2].10 EUROPEAN ASSOCIATION FOR THE STUDY OF THE LIVER EASL
Country Author Study years and Diagnosis Prevalence or Trends in prevalence
population incidence rates or incidence rates
(95% CI)
Denmark Jepsen [8] 1988-2005; alcoholic Histology In 2001–2005, the The alcoholic cirrhosis
cirrhosis: a nationwide alcoholic cirrhosis prevalence and
population-based, hospital incidence rates were incidence rates for men
registry study 22.5 (25.7-17.4) and and women of any
11.8 (11.2-12.4) per age did not change
100,000 per year for significantly from 1996
men and women, to 2005
respectively, and the
prevalence rates were
132.6 (130.7-134.5)
and 70.1 (68.8-71.5)
per 100,000
France Poynard [5] 2006-2008; 7,463 Histology The estimated
consecutive subjects aged prevalence of fibrosis
40 years or older, seen for was 1.3% (1.1%-1.7%)
a free voluntary screening and of cirrhosis was
program in two French 0.3% (0.2%-0.5%)
Social Security health
examination centres, 95%
male
Sweden Gunnarsdottir [9] 1994-2003; all patients Histology The mean annual The incidence rate
diagnosed with liver incidence rate per and the proportion of
cirrhosis in Gothenburg 100,000 inhabitants alcohol aetiology were
(600,000 inhabitants) in Sweden was 15.3 fairly constant over the
(± 2.4) study period
UK Fleming [6] 1992-2001; the UK Any diagnostic Crude incidence was The cirrhosis incidence
General Practice Research or therapeutic 14.55 per 100,000 increased from 12.05
Database (GPRD), code for person years. to 16.99 per 100,000
persons aged 25 and cirrhosis, Prevalence of cirrhosis person years from
over, 58% male oesophageal was an estimated 76.3 1992 to 2001
varices or portal per 100,000 population
hypertension aged over 25 in mid-
2001
UK Liu [7] 1996-2005; The Million ICD-10 After a mean follow-up
Women Study (an on- diagnosis code of 6.1 years (1996-
going prospective study K70, K73, or 2005), incidence rate
of 1.3 million United K74 of cirrhosis was 26 per
Kingdom women aged 50 100,000 per person-
and over) years in women
Table 1 – European studies assessing the prevalence or
incidence of liver cirrhosis.The burden of liver disease in Europe – a review of available epidemiological data 11
lic
b
pu
Re
ch
ze
C
Fig. 2 – Age-standardized death rates per 100,000
population from liver cirrhosis in European countries,
males and females aged 20–64; WHO Mortality
Database 2000-2002 [2].12 EUROPEAN ASSOCIATION FOR THE STUDY OF THE LIVER EASL
Primary liver cancer
Hepatocellular carcinoma (HCC), accounts for These calculations were based on published data
70–90% of primary liver cancers (PLC). Without where available or were estimated from national
any treatment, HCC is rapidly fatal, with a 5-year mortality and incidence data or from mortality
survival rate of around 5%. When liver resection data provided by local cancer registries. Recent
with curative intention is performed, 5-year incidence data (up to 2007) were extracted
survival rates reach 26-40% in French studies [10, by GLOBOCAN from reports available on the
11]. The management of HCC is complicated by Internet from the national cancer registries in
the presence of liver cirrhosis in more than 80% of Austria, Belgium, Bulgaria, Croatia, Cyprus,
patients. Liver cirrhosis is often the direct cause of Czech Republic, Ireland, Luxembourg, Malta,
death and may hinder cancer treatment. Over half the Netherlands, Slovakia, Slovenia and Ukraine.
a million new cases of HCC are diagnosed each Data for the five Nordic countries, Denmark,
year worldwide [12-14]. In recent years decreasing Finland, Iceland, Norway and Sweden, were
incidence has been reported in some high obtained from the NORDCAN database of the
incidence countries, while significant increases Association of the Nordic Cancer Registries. In
have been reported in several low incidence the United Kingdom, historical incidence data
countries [12, 15, 16]. These trends coincide with were available for the populations of England,
changes in the consumption of alcohol and the Scotland and Wales. Additional historical national
prevalence of HBV or HCV infection, which are incidence data for Belarus, Estonia, Latvia and
major risk factors for HCC [12]. Cancer registry Lithuania, together with local incidence data used
data must be preferred for survey purposes as for modelling purposes, were extracted from the
it is not selective, reporting data for virtually all ‘Cancer Incidence in Five Continents’ series of
primary liver cancers. By contrast, clinical studies monographs published by WHO.
adopt rigorous selection criteria and are typically
performed by tertiary referral hospitals that are In the EU27 in 2008, liver cancer incidence was
likely to be centres of excellence. Clinical studies 10.6 and 3.6 per 100,000 persons for men and
may provide indications as to the best outcomes women, respectively [17]. For men, the highest
possible and usually show better survival than incidence was in Italy (19.9 and 6.8 per 100,000
registry data. persons for men and women, respectively) and
the lowest was in the Netherlands (2.8 and 1.1
Thanks to the GLOBOCAN project (http:// per 100,000 persons for men and for women,
globocan.iarc.fr), we have estimates of liver respectively) [17]. As expected, estimated
cancer incidence rates for each EU27 country. mortality rates were very close to incidence rates,
GLOBOCAN is a project led by the WHO and indeed the two measures were exactly the same
provides estimates of national rates of incidence, for the EU27 overall [17]. Complete results for all
mortality and prevalence for every country in EU27 countries are given on Figs. 3 and 4, page 15.
the world, based on national population-based
cancer registries and death registration systems.
GLOBOCAN 2008 took into account delays in the
availability of data by computing predictions of
national incidence and mortality rates to the year
2008, wherever possible.The burden of liver disease in Europe – a review of available epidemiological data 13
Few European studies have investigated the In summary, PLC rates exceed 10 per 100,000
incidence of PLC. Those that have were all inhabitants in Southern European countries,
based on local or national registries (Table 2, reaching 13 per 100,000 in Italy and Greece. It is
page 14). In a study based on three Danish also common in Germany and Eastern European
registries, the incidence rate of PLC between countries, with incidence rates of 5-10 per
1985 and 2003 was 5.9 (95% CI 5.4–6.3) and 100,000 inhabitants. Unlike other cancers, the
3.7 (95% CI 3.4–4.0) per 100,000 person-years mortality rate is very close to the incidence rate
in men and in women, respectively [18]. In the because of the very low associated survival rate.
same study, the standardized incidence rate Thus, liver cancer is responsible for many deaths
of PLC increased from 3.2 (95% CI 2.2–4.2) to in Europe, around 47,000 per annum according
5.0 (95% CI 3.8–6.2) per 100,000 person-years to the WHO mortality database. This is lower than
between 1985 and 2003 [18]. These results were the rate for cirrhosis-related mortality (Table 13,
consistent with data from GLOBOCAN which page 46).
found incidence rates for Denmark in 2008 of
5.8 and 1.9 per 100,000 persons for men and
for women, respectively [17]. Three studies
published for France estimated PLC incidence
rates during the 1990’s to be between 9.5 and
13.8 for men and between 0.8 and 1.7 for women
[19-21]. GLOBOCAN found similar rates, with
10.5 and 2.2 per 100,000 persons for men and
for women, respectively [17]. Finally, in an Italian
study based on 20 local registries, the overall
standardized incidence rate of PLC was 21.1 per
100,000 person-years in men and 6.0 in women
[22]. Rates varied widely among different regions
and the results were consistent with those from
GLOBOCAN [17].
~ 47,000
Is the number of deaths in Europe caused
each year by liver cancer according to the
WHO mortality database.14 EUROPEAN ASSOCIATION FOR THE STUDY OF THE LIVER EASL
Country Author Study year(s) and Diagnosis Standardized incidence Trends in incidence
population rates per 100,000 rates
person-years
EU27 Ferlay [17], 2008; local cancer Histology or clinical 10.6 in men, 3.6 in
GLOBOCAN registries and imaging findings women
Denmark Erichsen [18] 1985-2004; the three Histology or clinical 5.9 (95% CI 5.4–6.3) in Increased from 3.2
Danish counties of North and imaging findings men, 3.7 (95% CI 3.4–4.0) (95% CI 2.2-4.2) to
Jutland, Aarhus and in women in 1985–2003 5.0 (95% CI 3.8-6.2)
Viborg from 1985 to 2003
France Borie [20] 1997-1998; 9 regional Histology or clinical 9.5 in men, 1.7 in women
French registries and imaging findings
France Caumes [21] 2002-2003; the Finistère Histology or clinical 13.8 in men, 0.8 in
cancer registry and imaging findings women
France Binder- 1990-1999; the cancer Histology or clinical 11.7 in men, 1.5 in No incidence trend
Foucard [19] registry of Bas-Rhin and imaging findings women for men or women
(p=0.75)
Italy Dal Maso [22] 1998-2002; 20 Italian Histology or clinical 21.1 in men, 6.0 in The change in
cancer registries and imaging findings women. annual incidence rate
In Naples, the world- between 1988 and
standardized incidence 2002 was 0.8% in
rates for persons aged men (95% CI 0.5-
0–79 were 29.5 and 8.3 2.1%) and 1.1%
per 100,000 in men and in women (95% CI
women, respectively, 0.2-2.1%).
approaching those found
in highest risk areas of
Asia.
Table 2 – European studies assessing incidence
of primary liver cancer.The burden of liver disease in Europe – a review of available epidemiological data 15
ic
bl
pu
Re
ch
ze
C
Fig. 3 – Estimated age-standardized incidence rates of liver
cancer per 100,000 in 2008; WHO, GLOBOCAN, 2008.
ic
bl
pu
Re
ch
ze
C
Fig. 4 – Estimated age-standardized mortality rates per 100,000
for liver cancer in 2008; WHO, GLOBOCAN, 2008.16 EUROPEAN ASSOCIATION FOR THE STUDY OF THE LIVER EASL
Liver transplantation
801
12
734
663
13,684
1,645
1,972
4,318
14,116
1,089
2,193 425
16,366
11,697
1,645
15,714
Fig. 5 – Number of liver transplantations in European countries,
May 1968 to December 2009; ELTR [23].The burden of liver disease in Europe – a review of available epidemiological data 17
More than 5,500 orthotopic liver transplantations Liver transplantation for malignant diseases is
(OLTs) are currently performed in Europe per year feasible, resulting in excellent outcomes in selected
[23]. Figure 5, on page 16, shows the number of patients, and comprises 14% of all liver transplants
OLTs that were performed in 16 European countries in the ELTR [23]. It is currently a treatment option for
between 1968 and 2009. After rapid growth in the patients with primary carcinomas of the liver, HCC
1980s and 1990s, the annual number of OLTs has representing 84% of OLTs for cancer. Other types of
stopped growing over the last 10 years, limited primary liver carcinomas eligible for transplantation
by the availability of organs (Fig. 6, below). Donor include cholangiocarcinoma, hepatoblastoma,
shortage currently represents the most important and hemangioendothelioma. The most common
limiting factor for OLTs [24, 25] and alternatives secondary carcinomas that are considered for
to standard cadaveric OLTs (a liver from someone OLT include metastases from carcinoid tumours,
that has died), such as split (one liver is divided for neuroendocrine tumours and gastrinomas [28, 29].
two recipients), domino (the original liver from a Reduced liver, split liver, living donor and domino
transplantation patient is transplanted into someone transplants have been used increasingly in recent
else), or living related (a portion of a healthy person’s years as alternatives to full-size OLT procedures.
liver is used) OLTs are increasingly used, accounting
for 11% of all procedures [26, 27]. In general, OLTs One of the most important findings in the evolution
are considered for any patient with chronic liver of OLTs is the significant improvement in results
disease that leads to life-threatening complications with time. Currently the 1-year survival rate is
and a survival prognosis of one year or less. The reported to be 83% (all indications considered).
main indications for liver transplantation in Europe This improvement is probably due to greater
are cirrhosis and tumours, mainly related to viruses technical expertise, better selection of patients, and
and alcohol (Figs. 7 and 8, page 18). improved post-OLT management of complications
and immunosuppressive therapy.
5761
5630
5336
5255
Fig. 6 – Growth in the annual numbers of liver transplants in Europe.
* The decrease in 2009 is due to the absence of updated figures from some centres.18 EUROPEAN ASSOCIATION FOR THE STUDY OF THE LIVER EASL
Benign liver tumors or Polycystic disease 8%
Budd Chiari 0.8%
Parasitic
Benign liver tumors diseases
or Polycystic 0.08%
disease 8%
Metabolic diseases 6%
Acute hepatic failure 8% Budd Chiari 0.8%
Parasitic diseases 0.08%
Metabolic diseases 6%
Cholestatic diseases 10%
Acute hepatic failure 8%
Cirrhosis 59%
Cholestatic diseases 10%
Cancers 14%
Cirrhosis 59%
Cancers 14%
Fig. 7 – Primary liver diseases leading to liver transplantation in
Secondary biliary cirrhosis 1%
Europe, January 1988 to December 2009.
Unknown 7%
Secondary biliary cirrhosis 1%
Autoimmune 40%
Primary biliary cirrhosis 10% Unknown 7%
Autoimmune 40%
Virus related 40%
Alcohol + Virus 5%
Primary biliary cirrhosis 10%
Virus related 40%
Alcohol 5%
Alcohol + Virus 33%
Alcohol 33%
Fig. 8 – Primary indications for liver transplantation in Europe among
patients with cirrhosis, January 1988 to December 2009.The burden of liver disease in Europe – a review of available epidemiological data 19
Alcohol and liver disease
Europe is the heaviest drinking region in the world Standardized mortality rates for alcohol-related
in terms of the prevalence of alcohol consumption, liver diseases among men and women during
according to the WHO report ’European Status 2000-2005 are available for 24 European countries,
Report on Alcohol and Health 2010’ [30]. Over 20% based on death certificates (Fig. 9, below and Fig.
of the European population aged ≥15 reported 10, page 20). They show a significant impact of
heavy episodic drinking (defined as five or more chronic alcohol consumption on health in Europe,
drinks on one occasion, or 50g alcohol) at least though the figures vary greatly between countries,
once a week [30]. ranging from 3 per 100,000 men in Latvia to more
than 47 per 100,000 men in Hungary. However, this
Alcohol is the main cause of liver disease, including data needs to be interpreted cautiously as there is
liver cirrhosis (see section on cirrhosis, page 8). variability between countries in the way mortality
The mortality rate associated with cirrhosis has is declared and how alcohol related diseases
traditionally been considered a good indicator of are recorded in death certificates. Nevertheless,
alcohol-related mortality [2]. Cirrhosis can lead to when considering alcohol consumption (Fig. 11,
HCC. In France, excessive alcohol consumption is page 20) and alcohol related mortality (Figs. 9 and
responsible for 69% of the cases of PLC, making 10) simultaneously, countries on the lower end
it the main risk factor, although viral aetiology is of both figures (e.g. Norway or Sweden) give an
increasing [20]. An increase in alcohol-related indication of what could be achieved in terms of
cirrhosis has been observed in Estonia [31] and mortality reduction should proper alcohol policies
in Denmark [32] in the last decade, in line with be implemented.
increases in alcohol consumption in the 1990s in
those countries.
Fig. 9 – Mortality from alcohol-related liver diseases among men
in European countries in 2005; WHO 2010 [30].20 EUROPEAN ASSOCIATION FOR THE STUDY OF THE LIVER EASL
Fig. 10 – Mortality from alcohol-related liver diseases among women in
European countries in 2005, WHO 2010.
e
ag
er
av
pe
ro
Eu
Fig. 11 – Alcohol consumption in Europe in 2005: WHO.The burden of liver disease in Europe – a review of available epidemiological data 21
Data on the acute consequences of alcohol This was followed by an increase and stabilization
consumption are scarce. From 1999 to 2008, the at a higher level between 2004 and 2006 (Fig.
annual incidence rate of alcoholic hepatitis in the 12, below). There are huge variations in alcohol
Danish population rose from 37 to 46 per 100,000 consumption among European countries (Fig. 11,
for men and from 24 to 34 per 100,000 for women, page 20). The burden of liver disease attributable to
according to an epidemiological study of a national the use of alcohol is significant compared to other
cohort. The 5-year mortality was 47% without aetiologies. Moreover, in many countries alcohol
cirrhosis, 69% with cirrhosis and 56% overall [33]. consumption causes substantial health, social and
economic burdens, not only in relation to public
Trends in alcohol consumption over the last two health problems including liver and psychiatric
decades, estimated from surveys in each member disease but also in terms of accidents and alcohol-
state as well as from alcohol industry statistics, related violence.
showed a decrease during the 1990s.
Fig. 12 – Alcohol consumption in Europe between 1990
and 2006; WHO 2010 [30].22 EUROPEAN ASSOCIATION FOR THE STUDY OF THE LIVER EASL Hepatitis A Hepatitis A is caused by infection with the hepatitis has changed in Europe over past decades because A virus (HAV). It has an incubation period of of improvements in hygiene and sanitation, coupled approximately 28 days and is primarily transmitted with economic and social advancement. Most by the faecal-oral route, either by person-to-person European countries have observed a dramatic drop contact or consumption of contaminated food in the level of hepatitis A incidence, and a shift in the or water. HAV infection does not result in chronic age-specific seroprevalence rates (Table 3, page 23 infection or chronic liver disease. Manifestations of and Table 4, page 24). As a consequence, a smaller infection vary with age. Most infected adults have a fraction of the population is immune, especially early symptomatic form whereas most infections in children in life when HAV infection is mainly asymptomatic. are asymptomatic or unrecognized. About 0.5 % of The yearly incidence rate of hepatitis A in Europe cases of hepatitis A will result in acute liver failure and today is between 0.55 and 1.5 cases per 100,000 death, but mortality reaches up to 2.1% in adults over inhabitants, based on data from epidemiological 40. HAV antibodies persist for many years after the surveillance systems (Table 3) and there are infection has resolved, providing long term immunity large differences between European countries. [34]. HAV vaccines are available today and are Hospitalization rates for HAV infection range from 0.2 routinely used in European countries for populations per 100,000 inhabitants in the Netherlands to 94 per and travellers at risk. The picture of HAV epidemiology 100,000 in Romania (Fig. 13, below). Fig. 13 – Hospitalisation for hepatitis A, incidence per 100,000 inhabitants in Europe; EUROHEP.NET.
The burden of liver disease in Europe – a review of available epidemiological data                                        23

Declining HAV incidence and seroprevalence have                  HAV still poses a serious threat to public health
delayed the age at which individuals become                      in Europe, despite declining incidence, because
infected until adulthood, at which time the                      reduced population protection leads to more
likelihood of developing the symptomatic illness                 symptomatic cases and to outbreaks. Epidemics
is considerably higher. Several countries have                   were responsible for a 10-fold increase in the
considered systematic vaccination because of                     incidence rate in the Czech Republic in 2008 [37,
the greater disease burden of late HAV infections.               38] and an incidence rate of 124 per 100,000
These vaccination programs have shown to be                      inhabitants in Latvia in 2008 [39]. Two epidemics
effective in reducing incidence, outbreaks, mortality            reported in Finland in 1994-1995 and 2002-2003
rates and hospitalisation [35]. One strategy is                  started with intravenous drug users and spread to
to combine HAV and hepatitis B virus (HBV)                       the rest of the population [40]. Luyten et al. have
vaccination. Cost-effective analyses performed in                estimated that a HAV outbreak can have a major
Ireland showed vaccination to be the strategy of                 economic impact, ranging from USD 3,824 to USD
choice where HAV immunity is 45% or less [36].                   200,480 per case [41].

 Country          Author              Study year(s) and          Case                  Incidence     Trends in incidence
                                      population                 identification        rates         rates
                                                                                       per 100,000

 Czech Republic   Fabianova [38]      2003-2007; general         Mandatory case        1.48
                                      population                 declaration

 Italy            Tosti [42]          2006; general population   Epidemiological       1.4           Decreased from 4.0
                                                                 surveillance system                 in 1991

 Netherlands      Suijkerbuijk [43]   2005; general population   Mandatory case        1.3           Decreased from 6.5
                                                                 declaration                         in 1995

 Poland           Baumann [44]        2007; general population   Mandatory case        0.09          A decrease of 31%
                                                                 declaration                         compared to 2006
                                                                                                     (part of a downward
                                                                                                     trend since 1997)

 Poland           Baumann [45]        2008; general population   Mandatory case        0.55          Increased from 0.09
                                                                 declaration                         in 2007

 Spain            Arteaga [46, 47]    2008; general population   Hospitalisation       1.36          Decreased from 1.87
                                                                                                     in 2005

Table 3 – Incidence rates of HAV infection in Europe.
24 EUROPEAN ASSOCIATION FOR THE STUDY OF THE LIVER EASL
Country Author Study year(s) and Diagnostic method Prevalence rates Trends in
population (95% CI) prevalence rates
Belgium Quoilion [48] 2007; general population Oral (saliva) testing for 20.2% (19.43 –
antibodies 21.08) weighted
for age
Finland Broman [40] 1990-2007; patient sample Oral (saliva) testing for 30-45%*
antibodies
Greece Kyrka [49] 2008; unvaccinated children Oral (saliva) testing for 17.1%
0-14 years old antibodies
Italy D’Amelio [50] 2005; military recruits Oral (saliva) testing for 5.3% Decreased from
antibodies 66.3% in 1981 to
29.4% in 1990
*Finland has a HAV vaccination program
Table 4 – Prevalence rates of HAV infection in Europe.The burden of liver disease in Europe – a review of available epidemiological data 25 Hepatitis B Hepatitis B is caused by infection with the hepatitis Chronic HBV infections translate into a heavy B virus (HBV). Primary risk factors for HBV disease burden in Europe. Cirrhosis occurs in 20 to transmission are sexual contact, percutaneous 30% of infected patients [55, 57] with about 25% exposure to infectious body fluids, perinatal at risk of developing hepatocellular carcinoma, exposure to an infected mother and prolonged close thus HBV is responsible for 10-15% of primary personal contact with an infected person [51]. Acute liver cancers [58]. HBV infections also translate HBV infection is symptomatic in 30-50% of adults into excess mortality risk. Estimation from mortality over 5 years, with a case-fatality of approximately registers suggests that HBV infected patients have 1% [52]. The risk of HBV infection becoming chronic an excess risk of all-cause mortality and liver- is 90% for infants, 30% for infected children aged related mortality [59]. About 46% of this excess
26         EUROPEAN ASSOCIATION FOR THE STUDY OF THE LIVER	EASL

Fig. 14 – Incidence rates of hepatitis B in EU27 countries in 2005; ECDC 2007.
Caution: there is no of standardized definition of new HBV cases; sometimes reactivations are included.

 Country                                             % anti-HBC                              % HBsAg

 Belgium                                                 1.3                                    0.7

 Czech Republic                                          2.5                                    0.3

 Germany                                                 6.0                                     -

 Italy                                                   5.6                                    0.6

 Luxembourg                                              2.9                                     -

 Romania                                                20.5                                    5.6

 Slovakia                                               10.5                                    0.6

 Finland                                                 2.7                                    0.2

 Ireland                                                 1.7                                    0.1

 Netherlands                                             1.7                                    0.1

 France*                                                 7.0                                    0.65

*Data added from Institut de Veille Sanitaire, 2004 [65]

Table 5 – Age-specific HBV seroprevalence in European countries [64].
The burden of liver disease in Europe – a review of available epidemiological data                                        27

 Country       Author                 Study year         Case identification     Incidence rates   Trends in incidence rates
                                      and population                             per 100,000

 Poland        Czarkowski [66, 67]    2006; general      Mandatory declaration   4.4               Stable since 2005 when the
                                      population                                                   rate was 4.5

 Romania       Pitigoi [68]           2004; general      Mandatory declaration   8.5               Decreased from 43 in 1989
                                      population

Table 6 – HBV incidence in Europe.

                                        Study year and              Diagnostic                               Trends in
 Country         Author                                                                   Seroprevalence
                                        population                  method                                   seroprevalence

 Belgium         Quoilin [48]           2006; general population    HBs antigen testing   0.66%
                                                                    in saliva

 France          Meffre [69]            2004; general population    HBs antigen testing   0.65%
                                                                    in serum

 Greece          Zacharakis [63]        2006; general population    HBs antigen testing   3.4%               Decreased from
                                                                    in serum                                 5.4% in 1994

 Greece          Papaevangelou [70]     1998; children              HBs antigen testing   0.6%
                                                                    in serum

 Italy           Fabris [71]            2007; general population    HBs antigen testing   1%
                                        in northern Italy           in serum

 Netherlands     Baaten [72]            2004; general population    HBs antigen testing   0.4%
                                        in Amsterdam                in serum

 Romania         Voiculescu [73]        2009; general population    HBs antigen testing   5.6%
                                        SE Romania                  in serum

 Spain           Salleras [74]          2002; general population    HBs antigen testing   0.7% (0.4-1)       Decreased from
                                        in Catalonia                in serum                                 1.5% in 1989

Table 7 – Seroprevalence of chronically HBV-infected patients in Europe.
28 EUROPEAN ASSOCIATION FOR THE STUDY OF THE LIVER EASL
Hepatitis C
Hepatitis C is caused by infection with the the general population, due to both drug use and
hepatitis C virus (HCV). HCV is transmitted through liver disease [86]. It is estimated that there are 2.5
percutaneous exposure to infected blood, e.g. HCV-associated deaths per 100,000 inhabitants in
through intravenous drug use, transfusion [75, 76] France, 95% with cirrhosis and 33% with HCC at
and medical procedures [77, 78]. About 90% of death [61]. In Spain, the mortality rate due to HCV
HCV infection remains asymptomatic. In Europe, infection is 11.25 per 100,000 inhabitants [60].
a significant number of persons acquired hepatitis Cost analysis, including the cost of complications,
C virus in the 1970’s and 1980’s before the virus shows that the median lifetime cost for treating
was identified and a diagnostic test was available. one patient with dual therapy (pegylated interferon
Since then, the transmission of infection has been and ribavirin) is between EUR 7,517 and EUR
greatly reduced and it is now mainly concentrated 21,229, depending on the virus genotype [87].
in intravenous drug users. However the disease has In cost effectiveness analyses of new protease
a prolonged time-course, individuals developing inhibitors for treating chronic hepatitis C universal
cirrhosis within 20 years [79], and so the disease triple therapy costs an additional USD 70,100 per
burden of HCV in Europe is at its peak only now. quality-adjusted life year (QALY) (mild fibrosis) and
USD 36,300 QALY (advanced fibrosis) compared
There is a lack of reliable epidemiological data on with standard pegylated interferon plus ribavirin
HCV in Europe [80]. An annual average incidence therapy [88].
rate of 6.19 per 100,000 inhabitants (95% CI 4.90-
7.48) can be estimated, based on rates reported Models suggest that HCV-related morbidity will
from the European region to the WHO [80]. Available rapidly increase in the short-term. In the UK,
literature suggests that the overall prevalence in models based on the natural development of HCV
Europe, estimated from serum antibodies, varies and on epidemiological data suggest that HCV-
between 0.12% and 3.23% (Table 8, page 29). This related cirrhosis and death from HCC are likely to
accords with the 0.003 % to 4.5% prevalence rate increase dramatically in the next decade, reflecting
reported by WHO for the wider European region (as the increased incidence of HCV infection in the early
geographically-defined by WHO) [80]. Intravenous 1980’s [89]. A recently published model suggests
drug users are particularly exposed to the risk of that treatment with pegylated interferon and
HCV infection, with prevalence rates of up to 50% additional effects of triple therapy with a protease
in Cyprus [81], 59.8% (95% CI 50.7-68.3) in France inhibitor could reduce HCV genotype 1-related
[82], 75% for those admitted for opiate detoxification cumulative incidence by 17.7% and mortality by
in Germany and 83.2% in Italy [83]. 9.7% between 2012-2021 [90].
Studies on the natural history of the disease show Although HCV transmission has been greatly
that up to 85% of infected patients develop a reduced and prevention strategies have been
chronic infection, with 10 to 20% progressing to effective [91], the issue of patients now chronically
cirrhosis [75]. About 7% of cirrhosis patients will infected with HCV needs to be addressed as these
develop hepatocellular carcinoma (HCC) [84] and patients will represent a heavy disease burden in
HCV is an important risk factor for this cancer [58]. the coming years.
HCV is the main indication for virus-related liver
transplantation (Fig. 15, page 29). Current studies in
patients diagnosed with hepatitis C show increased
morbidity, with higher hospital admission rates [85]
and mortality rates three times higher than that ofThe burden of liver disease in Europe – a review of available epidemiological data 29
HBV + HCV + HDV 1%
HBV + HCV 4%
HBV + HDV 8%
HCV 63%
HBV 24%
Fig. 15 – Primary indications for liver transplantation in Europe among patients
with virus-related liver disease (January 1988 to December 2009).
Study year and Trends in
Country Author Case identification Prevalence
population prevalence
Belgium Quoilin [48] 2007; general population Anti-HCV testing in saliva 0.12%
France Meffre [69] 2004; general population Anti-HCV testing in serum 0.65%
France Delarocque- 2004; adults aged 20-59 Anti-HCV testing in serum 0.71% Decreased from
Astagneau [91] 1.05% in 1994
Italy Cozzolongo [92] 2007; southern Italian town Anti-HCV testing in serum 2.6%
Italy Fabris [71] 2008; nothern Italy Anti-HCV testing in serum 2.6%
Netherlands Baaten [72] 2004; general population Anti-HCV testing in serum 0.6%
Romania Gheorghe [93] 2008; general population Anti-HCV testing in serum 3.23%
Table 8 – HCV prevalence in Europe.30 EUROPEAN ASSOCIATION FOR THE STUDY OF THE LIVER EASL
Hepatitis D
Hepatitis delta virus (HDV) is a small, defective RNA Estimated survival and complication-free survival
virus. It can infect only an individual who has also during 12 years were 72% and 45% in cirrhotic
been infected by HBV, either after concomitant patients compared to 100% in non-cirrhotic
transmission of the two viruses (so called co- patients (p < 0.008 and p < 0.0001, respectively)
infection), or via a subsequent infection of a HBV [103].
infected patient (so-called super-infection) [94].
HDV co-infection may cause a benign, self-limited Among 737 patients from a large cohort of HBsAg-
disease. However, it has been consistently shown positive patients in central Italy, 4.2% and 17% of
that most patients with HBV and HDV co-infection Italian patients and patients from outside of the
develop chronic infection and have more severe liver EU, respectively, had anti-HDV antibodies [104].
disease [95, 96], more rapid progression to cirrhosis The prevalence of HBV and HDV in Liguria, Italy
[97, 98] and increased hepatic decompensation, (1,572,000 inhabitants), was assessed in a network
and death [99] compared with patients who have of 12 referral centres for liver diseases. All patients
chronic HBV infection alone. with HBsAg followed throughout 2006 were
included. 445 (71% male) were evaluated, in whom
The highest prevalence is seen in central Africa, the prevalence of HDV infection was 5.7% [105].
the Horn of Africa, the Amazon Basin, Eastern and In southern Italy, 1,336 HBsAg positive subjects
Mediterranean Europe, the Middle East, and parts consecutively observed in 79 Italian hospitals were
of Asia [100]. However, prevalence rates are also evaluated over a 6-month period. The proportion
high in some Eastern European countries. Most of of patients co-infected with HDV was 9.7% [106].
the cases recorded in other European countries
are found in populations originating from endemic A retrospective analysis of 962 consecutive HBV-
regions. Limited data are available for basing an infected adult patients referred to King’s College
estimate of HDV prevalence in European countries. Hospital in London was performed between January
1st 2000 and March 31st 2006. Excluding non-UK
Among 16,597 HIV patients enrolled in EuroSIDA, 61 residents, the prevalence of anti-HDV antibodies
of 422 (14.5%) HBsAg-positive carriers were anti- was 7.1%. Most HDV-infected subjects were born
HDV-positive. HDV predominated in intravenous in regions where HDV is endemic, for example
drug users and in southern and/or eastern Europe. southern or eastern Europe (28.1%), Africa (26.8%)
Serum HDV-RNA was detectable in 87% of anti- or the Middle-East (7.3%) [107].
HDV-positive patients [101].
In Switzerland the prevalence of HDV infection in
1,699 patients with chronic hepatitis B was 5.9%
[102]. For two decades (1989 to 2008), 1,307
HBsAg carriers were followed for a mean of 7 ± 6
years at Düsseldorf University hospital. Hepatitis D
87%
prevalence increased from 4.1% to 6.2% among
HBsAg carriers during the two decades (p < 0.06).
The proportion of patients originating from the
former Soviet Union (32.1 vs. 46.2%) and Africa
(0 vs. 17.9%) increased whereas the proportion Percentage of serum HDV-RNA detected
of patients from southern Europe decreased (46.5
among anti-HDV-positive patients.
vs.17.9%; p < 0.03).The burden of liver disease in Europe – a review of available epidemiological data 31
Hepatitis E
Hepatitis E virus (HEV) is the causative agent Among 184 patients infected with HIV in Marseille,
of an acute form of hepatitis identified in 1983. the prevalence of serum anti-HEV antibodies and
Infection in severely immunocompromised patients HEV RNA was 4.4% (8/184) and 1.6% (3/184),
produces a chronic form of the disease. Hepatitis respectively [116].
E is also known to cause infections in animals,
particularly, but not exclusively, in pigs. Epidemics In Italy, 92 workers at risk from zoonoses and 3,511
have occurred regularly in many countries across controls from the general population of Rome and
south and southeast Asia and in Africa. Although Rieti were tested for anti-HEV antibodies. The
hepatitis E has been reported from many European prevalence was 2.9% in the general population
countries [108], its incidence in Europe is largely compared with 3.3% among pig breeders. The
unknown, and the seroprevalence of HEV infection prevalence in subjects recruited in Rome and Rieti
is also unknown for most countries in this region. was 2.5% and 5.5%, respectively (p = 0.0004)
[117].
Three studies investigated the prevalence of
HEV infection in Spain. Anti-HEV antibodies were
detected in fifty samples (2.17%) of 2,305 serum
samples taken from the general population (aged
2-60 years) in Madrid [109]. In a representative
sample of 1,249 healthy children from North-
Eastern Spain aged between 6 and 15 years; anti-
HEV antibodies were detected in 57 (4.6%) children,
suggesting that some children are exposed to HEV
in early childhood [110]. In a community-based
seroepidemiological survey of HEV infection in
Catalonia, anti-HEV antibodies were detected in 96
(7.3%) of the 1,280 samples analysed [111].
Two studies provide estimations of the prevalence
of HEV infection in Switzerland. Among 735
HIV-infected patients with unexplained alanine
1983
aminotransferase elevation the prevalence of Year when Hepatitis E virus (HEV)
anti-HEV antibodies was 2.6% [112]. Among 550 was identified.
consecutive blood donor samples collected in
the region of Lausanne, anti-HEV antibodies were
found in 27 (4.9%). The seroprevalence was 5.4%
(18/332) in men and 4.1% (9/218) in women [113].
In southwest France the prevalence of anti-HEV
antibodies among 529 samples from rural and
urban blood donors was 16.6%, (19.1% in rural
donors and 14.2% in urban donors) [114]. In the
Paris area, the prevalence of anti-HEV antibodies
in blood donors was 3.2% [115].32 EUROPEAN ASSOCIATION FOR THE STUDY OF THE LIVER EASL
Non-alcoholic fatty liver disease
(NAFLD)
NAFLD is defined by the presence of liver fat In the Barcelona and DIONYSOS studies, NAFLD
accumulation exceeding 5% of hepatocytes in the prevalence was 26%, in the SHIP study it was
absence of significant alcohol intake (20 g per day 30.4% and in the RISC study 33% of patients had
for men and 10 g per day for women), viral infection, a high probability of having the disease [119-121].
or any other specific aetiology of liver disease.
NAFLD encompasses a histological spectrum A recent Romanian study using ultrasonography
ranging from simple steatosis (SS) to non-alcoholic estimated NAFLD prevalence to be 20% in a large
steatohepatitis (NASH), which is characterized sample of patients hospitalized for internal and
by SS plus necroinflammation. NASH can have gastrointestinal diseases [123]. A study in Greece
different stages of fibrosis ranging from absent revealed evidence of NAFLD in 31% and of NASH
(stage F0) to cirrhosis (stage F4). SS, NASH, and in 40% of autopsied cases of ischaemic heart
different fibrosis stages can only be differentiated disease or traffic accident death (after exclusion
by liver biopsy [118]. of hepatitis B seropositivity or known liver disease)
[124]. One German [125] and two Italian [126,
More than 50% of adults in the EU 27 countries are 127] studies have investigated NAFLD prevalence
considered to be overweight or obese. According in children. A high prevalence (36-44%) of NAFLD
to the OECD, 34.6% of the adult population in the was found in obese children, regardless of the
EU 27 is overweight and 15.5% is obese (Fig. 16, manner used to diagnose the disease. NAFLD is
page 34). Obesity presents greater health risks than known to be highly correlated with diabetes. Two
being overweight. The prevalence of obesity varies major European studies [128, 129] reported NAFLD
threefold among EU 27 countries, from less than prevalence rates of 42.6-69.5% in large samples of
10% in Romania, Switzerland and Italy to over 20% type 2 diabetic patients.
in the United Kingdom, Ireland, Malta and Iceland.
Overweight and obesity rates are much lower than
average in France, Italy and Switzerland but are
increasing in these countries. In this context, NAFLD
is highly endemic in Europe where it represents a
major potential threat to public health.
Our search retrieved 11 European studies that
estimated NAFLD prevalence (Table 9, page 35).
Four were population-based studies: the Study
of Health in Pomerania (SHIP) [119]; a study in
the province of Barcelona [120]; the DIONYSOS
study in Italy [121]; and the RISC study (a large
study by the European Group for the Study of
Insulin Resistance on the relationship between
34.6%
insulin sensitivity and cardiovascular disease) [122].
NAFLD was diagnosed by ultrasonography except
in the RISC study where the fatty liver index was
calculated using an algorithm based on body mass
index (BMI), waist circumference, triglycerides Of the adult population in the EU27 is
(TG’s), and gamma-glutamyl transpeptidase (GGT), overweight according to the OECD.
giving an accuracy of 0.84 (95% CI 0.81-0.87) in
detecting fatty liver [122].The burden of liver disease in Europe – a review of available epidemiological data 33
The age, sex, and calendar-period adjusted
mortality ratio was 1.69 (95% CI 1.24-2.25) for
26% NAFLD compared to the general population, even
after excluding cirrhotic patients at the baseline.
CVD, malignancy and liver disease were the top
three causes of death. In the Cremona study on
higher over-all health costs at 5 year follow incidence and duration of diabetes in Italy, >2,000
up for individuals with sonographic fatty liver middle-aged individuals were followed for 15 years.
disease and increased serum ALT. The fatty liver index was significantly associated
with a higher liver-related mortality in a multi-
adjusted analysis [132].
NAFLD already represents an important burden for
European countries. A German study investigated
the SHIP cohort for the relationship between fatty
The presence of NAFLD carries an increased liver disease, self-reported health-care utilization
risk of overall mortality and of mortality related to and costs. The average annual overall health-care
cardiovascular disease (CVD) and liver disease. A costs were significantly higher at baseline and
cohort of 1,804 patients with hospital-diagnosed at follow-up measurements for individuals with
NAFLD from the Danish National Registry of evidence of NAFLD [133]. For example, controlling
Patients were followed during 16 years [130]. for comorbid conditions, subjects with sonographic
After adjustment for sex, diabetes and cirrhosis fatty liver disease and increased serum alanine
at the baseline, NAFLD-associated age-adjusted amino transferase (ALT) levels had 26% higher
standardized mortality ratios (SMR) were 2.3 (95% overall health-care costs at 5-year follow-up.
CI 2.1-2.6) for all causes, 19.7 (95% CI 15.3-
25.0) for hepatobiliary disease, and 2.1 (95% CI
1.8-2.5) for CVD [130]. In the SHIP study [119],
4,160 subjects were followed during 7 years. The
odd ratios for all-cause mortality and CV mortality
of ultrasonographic steatosis and highest GGT
quintile in men were 1.98 (95% CI 1.21-3.27) and
2.41 (95% CI 1.05-5.55), respectively. The risk
was not increased in women. The analyses were
adjusted for age, waist circumference, alcohol
consumption, physical activity, educational level,
civil status, equalized income and functional co-
morbidity index. A cohort of Swedish subjects with
NAFLD that had been identified by elevated liver
enzymes and liver biopsy between 1980 and 1984,
were assessed for mortality in comparison with
the general Swedish population during a 28 year
follow-up period [131].You can also read