OFFICE MARKET REPORT Q4 metro vancouver - NAI Commercial

Page created by Kirk Osborne
 
CONTINUE READING
OFFICE MARKET REPORT Q4 metro vancouver - NAI Commercial
Q4 metro vancouver

OFFICE
MARKET
REPORT

 4 2019
OFFICE MARKET REPORT Q4 metro vancouver - NAI Commercial
METRO VANCOUVER
office market report | quarter four 2019

The beginning of a new decade is an excellent time to reflect,          katchewan, Quebec, Manitoba or Alberta how they did it,
not only on 2019 but on how our market has changed over the             and how over 600 world-class cities have been able to
last 10 years. During Q1 2010, the Greater Vancouver vacancy            adopt it. At some point, this simple issue becomes a joke
rate overall was 10.0%. In Q4 2015, the rate peaked at 12.0%,           and a reminder of the challenges of accomplishing anything
and in Q2 2019 it hit a low of 5.5%. We finished Q4 with modest         through government channels.
gains to 6.0% overall vacancy.
                                                                        We encourage you, anytime you can’t get a taxi, or are
The last quarter of 2019 proved interesting. Canadians re-elected       tired of the taxi offering, write to the Premier: premier@gov.
Justin Trudeau for another term, despite the 2015 electoral             bc.ca and the Transportation Minister Claire Trevena: claire.
promise to balance the budget by 2019/2020. Come election               trevena.MLA@leg.bc.ca and let them know that you would
time 2019, it was predicted the deficit (not balanced) will be          like the option of using Uber and Lyft.
$19.8 billion. Post-election on December 16th, Finance Minister
                                                                        Moving on, Vancouver’s City Council recently approved a 7%
Bill Morneau provided an update: for the period ending March
                                                                        property tax increase. We commend all the good services
2020, the deficit will be closer to $26.8 billion, not balanced. The
                                                                        that the City of Vancouver offers, but budget and cost control
2010s were Canada’s worst decade for economic growth since
                                                                        cannot be handled by a council with limited elected terms.
the 1930s. Furthermore, government spending does not seem
                                                                        A 7% increase is a good indication that costs are not being
to be trickling down to BC, as job growth locally was just 0.3%.
                                                                        properly monitored or controlled within the city. Perhaps it
On the provincial side, with the start of a new decade companies        is time that large capital projects be costed and vetted with
are now fully saddled with paying the MSP for their employees.          outside service providers. When it takes years to retrofit the
As well, the NDP is supporting its backers and steering billions        Burrard Street Bridge, you have to wonder and challenge the
of dollars towards union workers for key infrastructure projects        status quo. It may not be about the items on the budget but
under the new Community Benefits Agreement, which stipulates            value and practicality. Who is challenging costs and expendi-
workers must be unionized. It is also interesting to see the BC         tures to make sure value is being received? Whether it is the
Teachers’ Federation, a long-time supporter of the NDP, having          seismic work on the Granville Street Bridge or the water main
to campaign against the NDP to negotiate their contract.                replacement on West Georgia (that will take four months to
                                                                        go four blocks), is the city being a good steward of your tax
If you had trouble getting a cab during the holiday season, you are
                                                                        dollars? We’d like to see the city start serving the interest of
right to be disappointed in the provincial government’s delay, and
                                                                        the tax payers, get costs under control and look where they
what some feel is the blocking, of ride-sharing. Despite promises
                                                                        can remove and reduce the “nice-to-haves” and put in place
that ride-sharing would arrive in 2017, then 2018, and finally
                                                                        policy that provides an incentive to all departments of the city
2019, the province has failed to deliver the much-needed ser-
                                                                        to reduce their expenditures and reward them for efficiencies.
vice. Recently, the NDP announced that Green Coast Ventures
                                                                        We commend the City of Port Coquitlam for limiting their tax
has been approved for Tofino, Ucluelet and Whistler. This is not
                                                                        increase to 0.48%, and we hope that Vancouver City Council
ride-sharing, and this is not relevant to British Columbians. An
                                                                        can work diligently and review on a deeper level their budget
unproven ride-sharing company with no intention to scale will
                                                                        and work with departments to find greater efficiencies.
not be effectively able to meet demand; who in the world would
look for a Green Coast app? Instead, it would seem better that          So for 2020, we wish you well, we wish for Uber and Lyft
the government simply allows the widely requested Uber / Lyft           to be able to operate in our city, and we look forward to the
combo to serve our market. Uber / Lyft primarily win not on a           announcement of lower taxes and less bureaucracy. Lastly,
cost basis, but by reducing the friction of the experience, and a       may permits be issued quickly by City Hall and may all of
local solution is not the answer. If the province is so challenged      you prosper.
in approving ride-sharing, perhaps they could ask Ontario, Sas-
                                                                        Moving on to the Metro Vancouver Office market.

                                                   % Change        Spaces      Spaces        % Change         Total Area   # of Spaces
              Vacancy Rate     Vacancy Rate     from Previous       Added       Added     from Previous    Space Added          Leased
                  Q3 2019          Q4 2019            Quarter      Q3 2019     Q4 2019          Quarter     Q3 2019 (SF)       Q4 2019

 Downtown            3.90%            4.00%            2.56%           130         147          13.08%          492,244             86

 Suburban            8.40%            8.60%            2.38%           213         119         -44.13%          790,122             62

 Vancouver           4.30%            4.70%            9.30%            34          45          32.35%          306,385             19
 Periphery

2   | NAI Commercial Metro Vancouver Office Report | Q4 2019
OFFICE MARKET REPORT Q4 metro vancouver - NAI Commercial
DOWNTOWN
snapshot
                                                Availability Rate                                                                                    Availability Rate                                                                                                           Inventory Size                                                                                                Inventory Size
 Office Class
                                                        Q3 2019                                                                                              Q4 2019                                                                                                               (SF) Q3 2019                                                                                                  (SF) Q4 2019
 A                                                                                           3.3%                                                                                                3.3%                                                                                        15,644,316                                                                                                     15,659,462
 B                                                                                           2.6%                                                                                                3.0%                                                                                                6,866,149                                                                                                     6,866,149
 C                                                                                           8.9%                                                                                                9.3%                                                                                                3,545,070                                                                                                     3,519,413

In Q4, the downtown market saw a slight uptick in vacancy, increasing to                                                                                                                                                                                                                   Q4 2019 Absorption
4.0% from 3.9% (Q3) and 3.8% (Q4 2018). New spaces added to the market                                                                                                                                                                                                                          ADDED                              LEASED                            REMOVED                                       ABSORPTION
were up 17 to 147 in the quarter, bringing 492,244 SF to the market, while
                                                                                                                                                                                                                                                                                            800,000
86 spaces leased, and 19 spaces removed, resulting in a slight negative
absorption of 92,589 SF. The vacancy rate in Q1 2010 was 6.8% on an
inventory of 23,785,847 SF. We finished the decade at 4.0% vacancy with an                                                                                                                                                                                                                  600,000
inventory of 26,045,024 SF. Within the decade, vacancy peaked in Q4 2015
at 11.1% and occupied space increased by 2,259,177 SF, which equals a
                                                                                                                                                                                                                                                                                            400,000
growth rate of 12.7%.
                           Average Size of                                                                Average Size of                                                           Average Size of
                                                                                                                                                                                                                                                                                            200,000
 Market                    Space Added in                                                                Space Leased in                                                          Space Removed in
                             Q4 2019 (SF)                                                                   Q4 2019 (SF)                                                               Q4 2019 (SF)
 Downtown                                                         3,349                                                                           2,789                                                                            4,447                                                                           0
 Suburban                                                         6,640                                                                           3,285                                                                            6,162
 Vancouver                                                                                                                                                                                                                                                                                 -200,000
                                                                  6,963                                                                           2,274                                                                        11,528
 Periphery
                                                                                                                                                                                                                                                                                           -400,000
Below is a graph tracking Greater Vancouver vacancy rates by quarter over                                                                                                                                                                                                                                                          Downtown                                Suburban                                Vancouver
the decade, laid over the occupied space per quarter for the same period.                                                                                                                                                                                                                                                                                                                                          Periphery

                       Vacancy Rates by Quarter vs. Occupied Space by Quarter
                                                  Greater Vancouver (2010 –2020)
60,000,000                                                                                                                                                                                                                                                                                                                                                                                                                    12.00%
58,000,000                                                                                                                                                                                                                                                                                                                                                                                                                    10.00%
56,000,000
                                                                                                                                                                                                                                                                                                                                                                                                                              8.00%
54,000,000
                                                                                                                                                                                                                                                                                                                                                                                                                              6.00%
52,000,000
50,000,000                                                                                                                                                                                                                                                                                                                                                                                                                    4.00%

48,000,000                                                                                                                                                                                                                                                                                                                                                                                                                    2.00%
46,000,000                                                                                                                                                                                                                                                                                                                                                                                                                    0.00%
             Q1 2010
                       Q2 2010
                                 Q3 2010
                                           Q4 2010
                                                     Q1 2011
                                                               Q2 2011
                                                                         Q3 2011
                                                                                   Q4 2011
                                                                                             Q1 2012
                                                                                                       Q2 2012
                                                                                                                 Q3 2012
                                                                                                                           Q4 2012
                                                                                                                                     Q1 2013
                                                                                                                                               Q2 2013
                                                                                                                                                         Q3 2013
                                                                                                                                                                   Q4 2013
                                                                                                                                                                             Q1 2014
                                                                                                                                                                                       Q2 2014
                                                                                                                                                                                                 Q3 2014
                                                                                                                                                                                                           Q4 2014
                                                                                                                                                                                                                     Q1 2015
                                                                                                                                                                                                                               Q2 2015
                                                                                                                                                                                                                                         Q3 2015
                                                                                                                                                                                                                                                   Q4 2015
                                                                                                                                                                                                                                                             Q1 2016
                                                                                                                                                                                                                                                                       Q2 2016
                                                                                                                                                                                                                                                                                 Q3 2016
                                                                                                                                                                                                                                                                                           Q4 2016
                                                                                                                                                                                                                                                                                                     Q1 2017
                                                                                                                                                                                                                                                                                                               Q2 2017
                                                                                                                                                                                                                                                                                                                         Q3 2017
                                                                                                                                                                                                                                                                                                                                   Q4 2017
                                                                                                                                                                                                                                                                                                                                             Q1 2018
                                                                                                                                                                                                                                                                                                                                                       Q2 2018
                                                                                                                                                                                                                                                                                                                                                                 Q3 2018
                                                                                                                                                                                                                                                                                                                                                                           Q4 2018
                                                                                                                                                                                                                                                                                                                                                                                     Q1 2019
                                                                                                                                                                                                                                                                                                                                                                                               Q2 2019
                                                                                                                                                                                                                                                                                                                                                                                                         Q3 2019
                                                                                                                                                                                                                                                                                                                                                                                                                   Q4 2019

                             Inventory Size (SF)                                                                                     Occupied Space (SF)                                                                                     Vacancy Rate

                        # Spaces                                      Total Area                                             # of Spaces                                               # of Spaces                                             Total Area                                                      Total # of                                Total Area                                            Absorption
                          Leased                                          Space                                                Removed                                                   Removed                                                 Spaces                                                          Spaces                                   Taken Off                                                for the
                         Q4 2019                                     Leased (SF)                                                 Q3 2019                                                   Q4 2019                                          Removed (SF)                                                       Removed                                 Q4 2019 (SF)                                           Quarter (SF)

 Downtown                                  113                                     315,160                                                                  16                                                       19                                                84,495                                                      102                                 399,655                                               -92,589

 Suburban                                     86                                   280,715                                                                  13                                                       21                                         129,400                                                             75                                 410,115                                           -380,007

 Vancouver                                    24                                     54,582                                                                        5                                                     6                                             69,168                                                       24                                 183,982                                           -122,403
 Periphery

 Total                                                                                                                                                                                                                                                                                                                                                                                                                   -594,999
                                                                                                                                                                                                                                                                                                                                                       Statistics provided by Altus Insite

                                                                                                                                                                                                           Q4 2019 | NAI Commercial Metro Vancouver Office Report | 3
DOWNTOWN VACANCY RATES                              SUBURBAN VACANCY RATES                          PERIPHERY VACANCY RATES
Quarterly:  2.56%                                  Quarterly:  2.38%                              Quarterly:  9.30%
Q3 2019: 3.90% | Q4 2019: 4.00%                     Q3 2019: 8.40% | Q4 2019: 8.60%                 Q3 2019: 4.30% | Q4 2019: 4.70%
Yearly:  5.26%                                     Yearly:  11.69%                                Yearly:  95.83%
Q4 2018: 3.80% | Q4 2019: 4.00%                     Q4 2018: 7.70% | Q4 2019: 8.60%                 Q4 2018: 2.40% | Q4 2019: 4.70%

  Significant Transactions
  ` PI Financial Corporation made a commitment to relocate to 753
    Seymour St, Vancouver Centre II for about 45,000 SF, joining
    B2Gold who committed there as well for 37,000 SF
  ` Collliers is rumoured to have committed to 41,000 SF at 1090
    West Pender St
  ` Charest Reporting will relocate to 28,000 SF within 885 West
    Georgia St
  ` Procurify expanded to 22,000 SF at 717 West Pender St
  ` Vancouver Fraser Port Authority leased the 25th floor of 1066
    West Hastings St
  ` D22 leased the 19th floor of 355 Burrard St
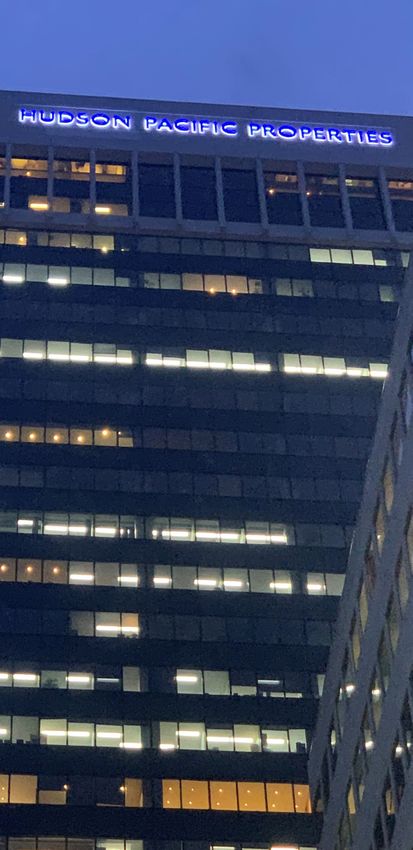
  ` Hudson Pacific leased 72,000 SF to a technology company in
    Bentall IV and secured Epic Games in 505 Burrard St for 7,500 SF
  Speaking of Hudson Pacific, we’ve noticed more activity at Bentall,
  where the complex has a sense of a new beginning. If you have not
  looked up, check out the new signage on top of Bentall IV. “Hudson
  Pacific Properties” is making their mark on the skyline, and it does
  not stop there. The landscaping in front of Bentall II is being replaced,
  crown LED’s are being installed, and rumours of more repositioning
  plans for the retail and common areas are to follow. It is great to see
  the iconic complex getting new energy and innovation.
  Despite the leasing activity, it is still a challenge for your typical tenant
  to find quality space at a reasonable cost. Most tenants renewing
  or relocating face an increase in their taxes and operating costs, as
  well as their basic rent. These escalations are seeing rents increase
  for many in the 30%–70% range depending on when they executed
  their previous lease, and that is forcing many business to consider
  their options and how to be more efficient in their premises, and if in
  fact they need their premises.
  An interesting note: the downtown core inventory size is currently
  26,045,024 SF, and Amazon is slated to occupy 14,000,000 SF in
  Seattle. That would represent nearly 54% of Vancouver’s total inventory!
  With Amazon bailing on its HQ2 plans in NYC, many believe they have
  turned to Vancouver as an unofficial HQ2. With their commitment to
  both properties at the Post building representing over a million square
  feet, their existing offices will be poised to be the largest single tenant      Growth in Occupied Space
  in our market. How much larger will Amazon get in Vancouver?
                                                                                  Metro Vancouver (2010–2020)
                        10-Year           % of         Growth In     % of Increase                                                 % of
                                                                                       Inventory      Occupied Space
   Market             Inventory       Inventory        Occupied       in Occupied                                              Occupied
                                                                                        Size (SF)                (SF)
                    Growth (SF)         Growth        Space (SF)            Space                                                Space
   Downtown          2,259,177          27.76%         2,834,814            29.10%    26,045,024           25,003,223             44.46%
   Suburban          3,493,167          42.93%         4,464,530            45.83%    24,005,676           21,941,188             39.01%
   Vancouver
                     2,384,582          29.31%         2,442,060            25.07%     9,756,451            9,297,898             16.53%
   Periphery
   Total             8,136,926        100.00%          9,741,403          100.00%     59,807,151           56,242,309           100.00%
                                                                                                          Statistics provided by Altus Insite

  4   | NAI Commercial Metro Vancouver Office Report | Q4 2019
SUBURBAN                                                        VANCOUVER PERIPHERY
snapshot                                                        snapshot

Over in the suburban market, the vacancy rate increased         The vacancy rate in the periphery market increased slightly to
slightly to 8.6% up from 8.4% in Q3. The suburban market        4.7% from a Q3 vacancy of 4.3%. However, 45 spaces were
started the decade with a vacancy rate of 14.8% and an          added to the inventory totalling 306,385 SF and 24 spaces
inventory of 20,512,509 SF and finished with an inventory of    leased and six spaces removed totalling 123,750 SF, leading
24,005,676 SF. Growth in occupied space over the decade         to negative absorption of 182,635 SF. Reviewing the decade
was 4,464,530 SF for a total of 21,941,188 SF occupied          once again, in Q1 of 2010 the vacancy rate was 7.0% with
space, an increase of 25.5% in 10 years. The vacancy            an inventory of 7,371,869 SF and we finish the decade with
peaked in Q3 of 2011 at 15.8%.                                  a vacancy of 4.7% and an inventory of 9,756,451 SF, growth
                                                      Total     of 2,384,582 SF in inventory and 2,272,507 SF in occupied
                     # of       Inventory                       space, a growth of 32% over the decade. The decade’s peak
 Area                                           Availability
               Buildings         Size (SF)
                                                      Rate      in vacancy was Q4 of 2016 at 10.4%, all in all showing a steady
 Burnaby             119        9,944,939            6.90%      growth in the market that is very efficient.
 Langley               5          198,271          10.40%       The periphery market activity was made up mostly of renewals,
 New
                                                                and this is due in part to a lack of quality premises available for
                      23        1,438,584            6.90%      lease and a low vacancy rate.
 Westminster
 North Shore          47        2,225,058            4.60%
 Richmond             74        4,417,840          13.70%       Significant Transactions
 Surrey               65        4,054,560          12.30%       ` Lasalle College renewed for 82,000 SF at 2665 Renfrew St
 Tri-Cities           11          559,052            1.40%      ` The Vancouver Police renewed 74,000 SF at 2120 Cambie St

Only 113 spaces were added to inventory in Q4, total-                                                                       Total
                                                                 Office               # of           Inventory
ling 790,122 SF, and 86 spaces totalling 280,715                                                                      Availability
                                                                 Class          Buildings             Size (SF)
SF leased and 129,400 SF removed. The net neg-                                                                              Rate
ative absorption for the quarter was 380,000 SF,                 All Classes          171            9,756,451             4.60%
so we predict there will be an increase again in the vacancy     A                     70            5,623,511             1.60%
for Q1 of 2020.
                                                                 B                     56            2,489,219             6.40%
The most significant growth in occupied space over the           C                     45            1,643,721            13.00%
decade took place in the suburban market, with an increase
of 46.6%.                                                       It may be time to pay more attention to developing offices in the
                                                                periphery, especially with the coming Millenium Line Broadway
                                                      Total
 Office              # of       Inventory                       Extension Project.
                                                Availability
 Class         Buildings         Size (SF)
                                                      Rate
 All Classes
 A
                     368
                     175
                               24,005,676
                               15,126,469
                                                     8.10%
                                                     9.60%
                                                                                   NAI COMMERCIAL
 B                   140        7,023,618            5.90%                                                office team
 C                    53        1,855,589            5.00%
                                                                NAI Commercial appreciates those landlords who have asked
                                                                us to review and assist with their leasing program. For tenants
As to market activity there were a couple of transactions to
                                                                who have engaged us to help with their office renewals and
report but overall activity was with smaller tenants.
                                                                relocations, we remind you that we remain an interested party.
Significant Transactions                                        We are available to answer questions and concerns, even after
                                                                your lease is signed.
` Worley Parsons leased 29,190 SF at 4321 Still Creek
  Dr, where Huawei also leased 15,000 SF                        We continue to appreciate the reminders and suggestions of
                                                                agents to join our team. We have openings in both our Van-
` Rise People leased 25,000 SF at 3777 Kingsway                 couver and Langley office and we welcome the referrals of
` Translink committed to 22,000 SF at 4555 Kingsway             agents looking to enhance their career in commercial real estate
                                                                that may be a good fit for our firm.

                                                               Q4 2019 | NAI Commercial Metro Vancouver Office Report | 5
WEWORK
Worries or Winning?
We have recently been awed by Amazon and WeWork’s commitment to premises
                                                                                                                   By Edward Sim, NAI Commercial
in our market. Since our Q3 report on WeWork’s woes, they have been correcting
their model to be able to effectively operate in the real world. Leading up to their
proposed IPO, WeWork faced massive public backlash over their unsustainable
business model. With significant long-term lease commitments, large losses on
high-end buildouts, and questionable corporate practices (including CEO Adam
Neumann leasing space to WeWork in buildings he had personal ownership
interest in), it was understandable that the IPO was cancelled.
Our take is that WeWork will take one to two years to restructure and operate
profitably at a valuation in the low billions. For example, IWG (Regus) is a com-
                                                                                                                   Edward Sim
parable company to WeWork, with $4 billion in revenue and $4.41 billion market
                                                                                                                   Commercial Sales & Leasing
cap. Softbank has deep pockets and has already begun stabilizing WeWork by
                                                                                                                   604 691 6613
laying off 20% of the global work force and slowing down new lease signings. One
                                                                                                                   esim@naicommercial.ca
reservation is that WeWork has basically been built since 2008, rising steadily on
increasing rents and business confidence. With a recession, will WeWork’s model
be sustainable? In 2019, they reported that 40% of their leases were longer-term
commitments with large clients. Anecdotally, we know that Amazon heavily leaned
on WeWork during their transition period as they waited for their new office spaces
to come online, but what happens longer term or in a downturn?
During WeWork’s positive run, they secured space in iconic buildings in major
cities and developed productive relationships with some of the world’s biggest
landlords. We see WeWork continuing to succeed as a co-working option spe-
cifically for large tech-oriented companies as they transition and land in a new
city. In a city like Vancouver, which is still missing major corporate offices for large
tech companies (ie. LinkedIn, Google, Intel, Oracle, etc.) and which brings new
inventory online at a reasonable pace, we see WeWork remaining effective through
a downturn. Particularly in Vancouver, we see an employment environment with
lower than average wages, the benefit of a favourable Canadian dollar, and pre-
dict that tech companies will continue to place a portion of their operations here.

             Vancouver Office:                            Brian Mackenzie                           Langley Office:             Angie MacDonald
                                                          Cole Maedel                                                           Don MacDonald
             Rob DesBrisay                                Conor Finucane                                                        Gary Niesner
             Managing Partner                             Edward Sim                                                            Ken Kiers
             604 691 6602                                 Irene Yung                                                            Ted Weibelzahl
             rdesbrisay@naicommercial.ca                  Jesse Godin
                                                          Ruby Wang

             NAI Commercial | 1075 W Georgia St, Suite 1300, Vancouver, BC V6E 3C9 | naibc.ca

© 2020 NAI Commercial (BC) Ltd. All Rights Reserved.
No warranty or representation, express or implied, is made as to the accuracy of the information contained herein, and the same
is submitted subject to errors, omissions, change of price, rental or other conditions, prior sale, lease or financing, or withdrawal
without notice, and of any special listing conditions imposed by our principals no warranties or representations are made as to
the condition of the property or any hazards contained therein are any to be implied.
You can also read