Omnivore and Vegetarian Diet Comparison at a Sustainable Consumption Conference - CBS
←
→
Page content transcription
If your browser does not render page correctly, please read the page content below
Omnivore and Vegetarian Diet Comparison
 at a Sustainable Consumption Conference

                    Course 42372 - Case Study - Group 5
           Life Cycle Assessment of Products and Systems

                             Andrea Leoni (s173026)
                              Haotian Ma (s172126)
                            Ibrahim Nemer (s134738)
                             Jeska Naujoks (s162412)
                            Lorenzo Soncina (s155396)
                             Paolo Beccheti (s155371)

Technical University of Denmark (DTU), Lyngby
4th December 2017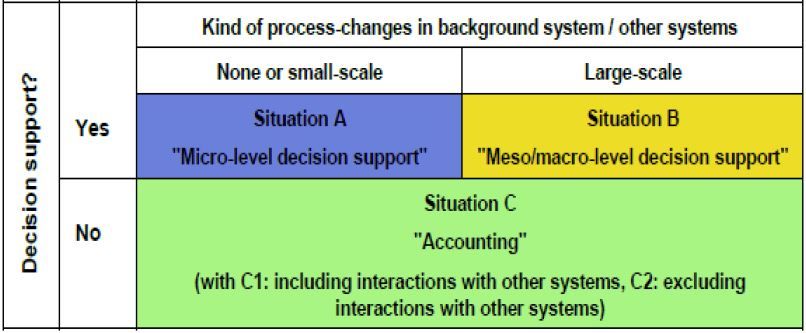
Group 5                 Life Cycle Assessment of Products and Systems                  04.12.2017

Executive Summary
The present paper reports the full comparative Life Cycle Assessment (LCA) between a meat-
based and vegetarian menu proposed by CBS’s catering company for a conference hosted by
”The Sustainable Consumption Research and Action Initiative” (SCORAI), taking place at CBS
in June 2018. The conference is called ”Fostering Good Practices and Confronting the Challenges
of the 21st Century” and covers topics regarding sustainable consumption. By performing an
LCA, this report aims to examine whether one diet is environmentally friendlier than the other
and, if no substantial difference is found, propose potential changes to the menus. This is
done by identifying the hot-spots, else referred as the highest contributors, and presenting more
sustainable alternatives in terms of environmental impacts. The results of this comparative study
will only be used as a decision making incentive and hence won’t be disclosed to the general
public.
The LCA is performed using the commercial software SimaPro 8.4.0 for calculating the final
environmental impact assessment with a cradle-to-grave approach. Methods employed are ReCiPe
2016 (H) for characterised results and ReCiPe (H) for normalised and weighted results. The
functional unit expressing the object of assessment is “Provide food complying with valid hygiene
standards for two lunches and one dinner for 130 people during the three-day conference at CBS”
and reference flows for each menu are calculated based on the total mass of food served. An
inventory analysis is performed identifying first and foremost the raw materials needed for the
menu composition, including processed foods; secondly transportation and packaging are added
to the inventory. Cooking processes are included to account for some emissions arising from
them. Lastly, waste management (WM) is modelled as a combination of compost, incineration
and anaerobic digestion. Due to assumptions and simplifications, parameter uncertainties are
caused in the system. Nonetheless, the model is found to be robust when results are generated
with another method. After carrying out the impact assessment and interpretation of results,
the following conclusions are drawn.
When assessing each menu individually, cow milk-derived products and ingredients from outside
the EU are found to be the highest contributors. When comparing the diets through the two
menus, a better performance is seen in the vegetarian menu in most of the impact categories. A
single score obtained by normalisation and weighting at endpoint level further proves a preference
towards the vegetarian menu in terms of environmental impact to the areas of protection. Most
importantly, it should be stressed that the results reported in this report do not apply to a
general comparison between omnivore and vegetarian diet, but only apply to the exemplary
menu provided to the LCA practitioners by the hosts of the conference. Additionally, given the
amount of assumptions and simplifications necessary to involve, results should not be considered
as absolutely certain. Nonetheless, they are reliable enough to present this preference for the
vegetarian menu.

                                                i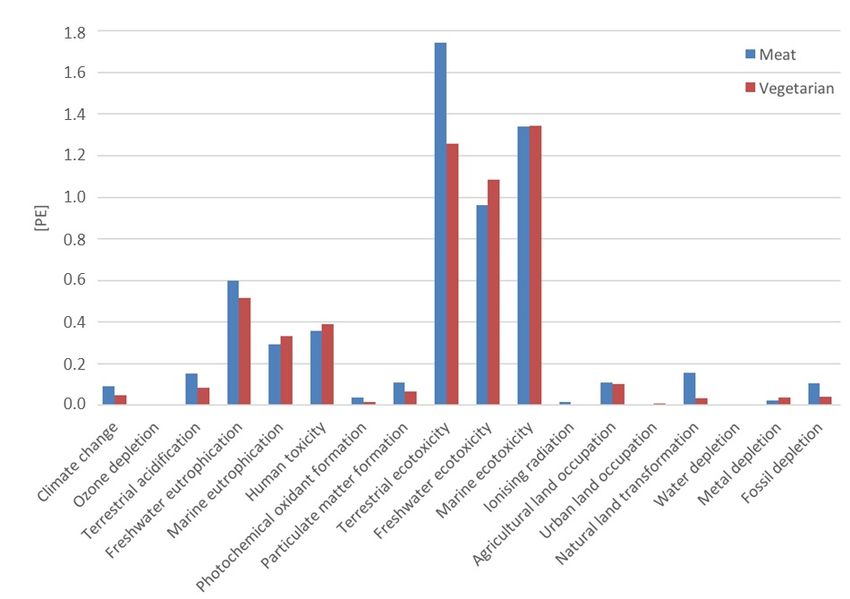
Group 5 Life Cycle Assessment of Products and Systems 04.12.2017
Technical Summary
The Sustainable Consumption Research and Action Initiative (SCORAI) is hosting an interna-
tional conference on sustainable consumption in collaboration with Copenhagen Business School,
Washington State University and New Jersey Institute of Technology. The conference invites 120
academics and practitioners to discuss and build on their knowledge of the topic: “Fostering
Good Practices and Confronting the Challenges of the 21st Century”.
The objective of this paper is to assess the environmental impact of a meat-based and a vegetarian
menu that will be served at the conference via Life Cycle Analysis. This ISO certified method
consists of four stages of assessment. The first phase is the goal and scope definition in which
the frame to follow in the whole LCA is set. In the goal definition, the purpose of the study
is defined together with limitations and general working parameters. As a matter of fact, this
assessment only compares two scenarios and it thereby cannot provide a full assessment on the
sustainability of an omnivore or a vegetarian diet. In addition, some aspects such as the social
and the economic consequences are neglected while the data representativeness in temporal,
geographical and technological scale are set to the conference’s constraints.
From the scope definition, the defined functional unit states that the object of the assessment
is to ”Provide food complying with valid hygiene standards for two lunches and one dinner for
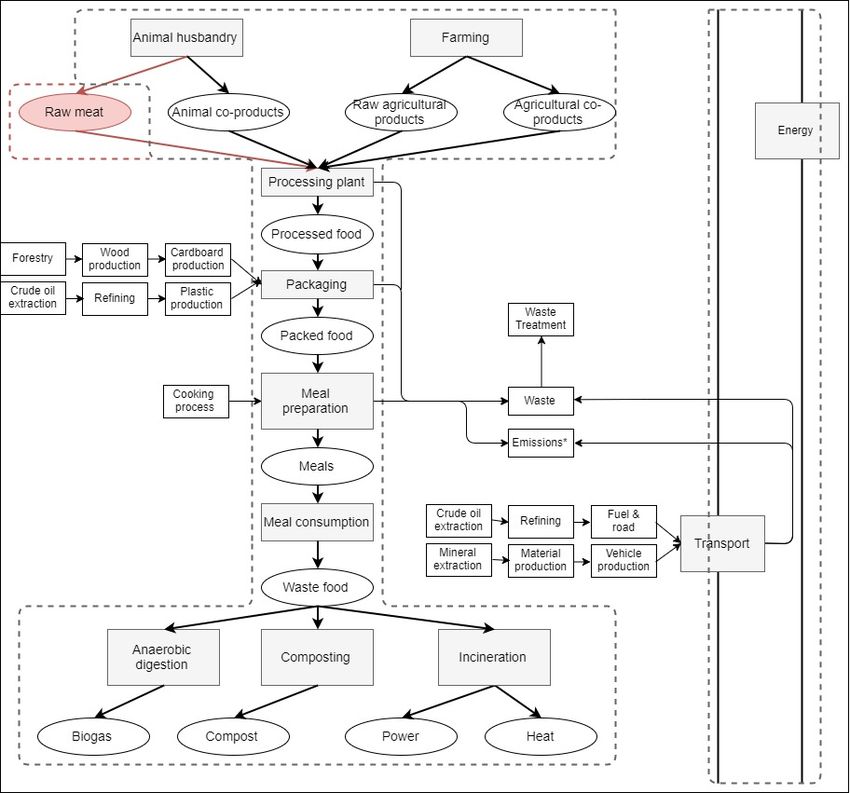
130 people during the three-day conference at CBS”. The overall flow diagram of the studied
system depicted in figure 3 graphically shows the system boundaries. Representative data is
most crucial in a geographic sense and less in the other two.
ii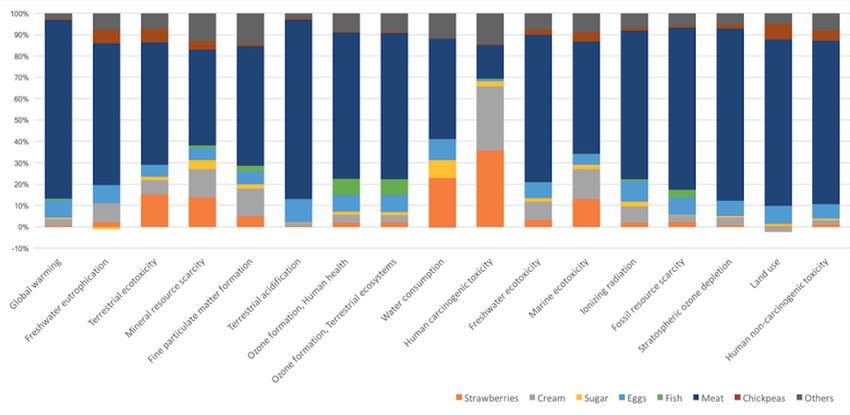
Group 5                  Life Cycle Assessment of Products and Systems                   04.12.2017

Figure 1: Flow Diagram for both menus, where red colour indicates an extension only present in
the meat-based scenario. Dashed lines mark the foreground system while solid lines represent
the system boundaries

The inventory analysis (LCI) is the phase in LCA for the data collection to build the model with
all processes. Two iterations are applied to increase data detail. The LCI is carried out with
the commercial software SimaPro 8.4.0.. The data for all processes during the food supply
chain are collected, including food ingredients, transport, packaging, cooking process and waste
treatment. The results of the LCI model are the implemented in the next phase.
The impact assessment is a vital phase of the LCA, during which the elementary flows are
translated into potential environmental impacts. This analysis is performed both at midpoint
and endpoint level employing ReCiPe Midpoint (H) and ReCiPe Endpoint (H) from years 2016
and 2008, with a final assessment of the consequences on the areas of protection (AoP).
Interpretation is the last phase of the study which explains the reasons for the outcomes of the
assessment. First, the interpretation is given for each type of diet and then the different diets are

                                                 iii
Group 5 Life Cycle Assessment of Products and Systems 04.12.2017
compared. The life cycle stage that contributes most to the environmental impact for both diets
is the meal assembly which is the process most easily changeable by the host of the conference
by changing some food ingredients. On the other hand, some processes contributing a lot are
far upstream and cannot be influenced easily. The remaining processes that contribute to the
environmental impact are given by the input of the raw food and some changes can be made in
order to improve the conference’s sustainability. Such improvement are presented below.
The data used in the assessment are mainly from CBS and the catering company, with some
additions from the scientific literature and other internet sources. Due to lack of data in the
software, some assumptions and estimations are required. The sensitivity analysis has proven
the system to be robust towards the choice of method, however.
Overall, the results of the diet comparison show the vegetarian diet to be the preferable menu.
As general recommendations valid for both menus, the transport distances should be kept low
by selecting food suppliers within a close range of the catering company. Furthermore, lorry
transport should be preferred over air freight and ship transport. Lastly, recommendations
regarding hot-spot food processes are found below:
• Substitute berries from the USA to berries being imported from the EU/Scandinavia
• Cow milk and butter to be substituted by plant based products.
• Egg use minimized as they cannot be easily substituted
As the recommendations show, the results of this comparative study can be used as a decision
making incentive.
ivGroup 5 Life Cycle Assessment of Products and Systems 04.12.2017
Contents
1 Introduction 1
2 Goal and Scope Definition 2
2.1 Goal Definition . . . . . . . . . . . . . . . . . . . . . . . . . . . . . . . . . . . . . 2
2.1.1 Intended Application of the Results . . . . . . . . . . . . . . . . . . . . . 2
2.1.2 Limitations due to Methodological Choices . . . . . . . . . . . . . . . . . 3
2.1.3 Decision Context and Reasons for Carrying Out the Study . . . . . . . . 3
2.1.4 Target Audience . . . . . . . . . . . . . . . . . . . . . . . . . . . . . . . . 3
2.1.5 Comparative Studies to be Disclosed to the Public . . . . . . . . . . . . . 4
2.1.6 Commissioner of the Study and Other Influential Actors . . . . . . . . . . 4
2.2 Scope Definition . . . . . . . . . . . . . . . . . . . . . . . . . . . . . . . . . . . . 4
2.2.1 Deliverables . . . . . . . . . . . . . . . . . . . . . . . . . . . . . . . . . . . 4
2.2.2 Object of Assessment . . . . . . . . . . . . . . . . . . . . . . . . . . . . . 5
2.2.3 LCI Modelling Framework . . . . . . . . . . . . . . . . . . . . . . . . . . . 9
2.2.4 System Boundaries and Completeness Requirements . . . . . . . . . . . . 10
2.2.5 Representativeness of LCI Data . . . . . . . . . . . . . . . . . . . . . . . . 12
2.2.6 Preparing the Basis for the Impact Assessment . . . . . . . . . . . . . . . 12
2.2.7 Special Requirements for System Comparisons . . . . . . . . . . . . . . . 14
2.2.8 Critical Review Needs . . . . . . . . . . . . . . . . . . . . . . . . . . . . . 14
2.2.9 Planning Reporting of Results . . . . . . . . . . . . . . . . . . . . . . . . 14
3 Inventory Analysis 15
3.1 Basis for Developing the Inventory . . . . . . . . . . . . . . . . . . . . . . . . . . 15
3.2 Processes for the LCI Model . . . . . . . . . . . . . . . . . . . . . . . . . . . . . . 16
3.3 Transport Data . . . . . . . . . . . . . . . . . . . . . . . . . . . . . . . . . . . . . 17
3.4 Packaging Data . . . . . . . . . . . . . . . . . . . . . . . . . . . . . . . . . . . . . 18
3.5 Model Construction and Result Calculation . . . . . . . . . . . . . . . . . . . . . 20
3.6 LCI Results . . . . . . . . . . . . . . . . . . . . . . . . . . . . . . . . . . . . . . . 20
4 Impact Assessment 21
4.1 Analysis at Midpoint Level . . . . . . . . . . . . . . . . . . . . . . . . . . . . . . 21
4.1.1 Characterised Results . . . . . . . . . . . . . . . . . . . . . . . . . . . . . 21
4.1.2 Contribution Analysis . . . . . . . . . . . . . . . . . . . . . . . . . . . . . 22
4.1.3 Normalised Results . . . . . . . . . . . . . . . . . . . . . . . . . . . . . . . 28
4.2 Analysis at Endpoint Level . . . . . . . . . . . . . . . . . . . . . . . . . . . . . . 29
4.2.1 Characterised Results . . . . . . . . . . . . . . . . . . . . . . . . . . . . . 30
4.2.2 Area of Protection . . . . . . . . . . . . . . . . . . . . . . . . . . . . . . . 31
4.2.3 Weighted Results . . . . . . . . . . . . . . . . . . . . . . . . . . . . . . . . 31
5 Interpretation 32
5.1 Hot-Spot Analysis Meat Menu . . . . . . . . . . . . . . . . . . . . . . . . . . . . 32
5.2 Hot-Spot Analysis Vegetarian Menu . . . . . . . . . . . . . . . . . . . . . . . . . 32
5.3 Diet Comparison . . . . . . . . . . . . . . . . . . . . . . . . . . . . . . . . . . . . 33
5.4 Completeness Check . . . . . . . . . . . . . . . . . . . . . . . . . . . . . . . . . . 34
5.5 Consistency Check . . . . . . . . . . . . . . . . . . . . . . . . . . . . . . . . . . . 34
5.6 Uncertainty Analysis . . . . . . . . . . . . . . . . . . . . . . . . . . . . . . . . . . 34
5.7 Sensitivity Analysis . . . . . . . . . . . . . . . . . . . . . . . . . . . . . . . . . . . 35
vGroup 5 Life Cycle Assessment of Products and Systems 04.12.2017
6 Conclusion 37
6.1 Single menu assessment . . . . . . . . . . . . . . . . . . . . . . . . . . . . . . . . 37
6.2 Diet comparison . . . . . . . . . . . . . . . . . . . . . . . . . . . . . . . . . . . . 37
6.3 Limitations . . . . . . . . . . . . . . . . . . . . . . . . . . . . . . . . . . . . . . . 37
6.4 Recommendations . . . . . . . . . . . . . . . . . . . . . . . . . . . . . . . . . . . 38
A Confidential Supplementary Data A1
A.1 Calculated LCI Results . . . . . . . . . . . . . . . . . . . . . . . . . . . . . . . . A1
A.2 Exemplary Menus . . . . . . . . . . . . . . . . . . . . . . . . . . . . . . . . . . . A5
viGroup 5 Life Cycle Assessment of Products and Systems 04.12.2017
List of Tables
1 Summary of the dishes provided in the meat-based menu . . . . . . . . . . . . . 6
2 Summary of the dishes provided in the vegetarian menu . . . . . . . . . . . . . . 7
3 Nutritional values calculated based on the exemplary meal using conversion rates
from Fddb Internetportale GmbH (n.d.) . . . . . . . . . . . . . . . . . . . . . . . 8
4 Obligatory and positioning properties of food provision . . . . . . . . . . . . . . . 8
5 Summary of ILCD recommendations on LCI modelling choices . . . . . . . . . . 10
6 Food ingredients and their mode of simulation . . . . . . . . . . . . . . . . . . . . 16
7 Geographical origin of ingredients and according transport modes and distances
(* geographical origin has been assumed) . . . . . . . . . . . . . . . . . . . . . . 18
8 Type of packaging of the meal ingredients (* material based on literature search) 19
9 Characteristics for the packaging material . . . . . . . . . . . . . . . . . . . . . . 19
10 Characterised results at midpoint level (ReCiPe 2016 Midpoint (H)) . . . . . . . 22
11 Major process contribution for the meat-based and vegetarian menu based on
characterised results at midpoint level (ReCiPe 2016 Midpoint (H)) . . . . . . . . 27
12 Characterised results at endpoint level (ReCiPe 2016 Endpoint (H)) . . . . . . . 30
13 Characterised results for damage assessment (ReCIPe 2016 Endpoint (H)) . . . . 31
14 Sensitivity Analysis: Diet with higher impact for each category based on charac-
terised results at midpoint with method ReCiPe 2016 Midpoint (H) and ILCD
2011 Midpoint+ . . . . . . . . . . . . . . . . . . . . . . . . . . . . . . . . . . . . 36
15 Overview of SimaPro processes included for the proxies . . . . . . . . . . . . . . A1
16 Overview of SimaPro processes included for the packaging . . . . . . . . . . . . . A2
17 Overview of SimaPro processes included in the meat menu analysis . . . . . . . . A3
18 Overview of SimaPro processes included in the vegetarian menu analysis . . . . . A4
19 Extensive ingredient list meat-based menu . . . . . . . . . . . . . . . . . . . . . . A5
20 Extensive ingredient list vegetarian menu . . . . . . . . . . . . . . . . . . . . . . A6
List of Figures
1 Flow Diagram for both menus, where red colour indicates an extension only present
in the meat-based scenario. Dashed lines mark the foreground system while solid
lines represent the system boundaries . . . . . . . . . . . . . . . . . . . . . . . . . iii
2 Decision context classification (Hauschild (2017)) . . . . . . . . . . . . . . . . . . 3
3 Flow Diagram for both menus, where red colour indicates an extension only present
in the meat-based scenario. Dashed lines mark the foreground system while solid
lines represent the system boundaries . . . . . . . . . . . . . . . . . . . . . . . . . 11
4 Life cycle stage contribution for the meat-based menu, based on characterized
results at midpoint level (ReCiPe 2016 midpoint (H)) . . . . . . . . . . . . . . . 23
5 Life cycle stage contribution for the vegetarian menu, based on characterized
results at midpoint level (ReCiPe 2016 midpoint (H)) . . . . . . . . . . . . . . . 24
6 Process contribution for the ingredients of the meat-based menu, based on charac-
terised results at midpoint level (ReCiPe 2016 midpoint (H)) . . . . . . . . . . . 25
7 Process contribution for the ingredients of the vegetarian menu, based on charac-
terised results at midpoint level (ReCiPe 2016 midpoint (H)) . . . . . . . . . . . 26
8 Normalised results at midpoint level in person equivalents (ReCiPe Midpoint (H)) 29
9 Weighted results at endpoint level in weigthed person equivalents (ReCiPe End-
point (H)) . . . . . . . . . . . . . . . . . . . . . . . . . . . . . . . . . . . . . . . . 31
viiGroup 5 Life Cycle Assessment of Products and Systems 04.12.2017
1 Introduction
Sustainability, and climate change more specifically, are increasingly discussed in both the public
and companies worldwide. Ongoing and past research points to many man-made phenomenons
that have an influence on the environmental challenges we are facing today. Therefore, interest
arose to tools that could provide a classification of the sustainability of industrial processes,
products and services.
One of these tools is Life Cycle Assessment (LCA). It looks at the object of interest from the
early life cycle stage of raw material extraction and follows through until the end-of-life. For all
of these stages, processes are defined with inputs outputs and according emissions, thus enabling
the establishment of mass balances of potentially harmful substances within the system and so
called elementary flows leaving the system. These can then be related to environmental impact
categories by employing a predefined method that uses specific relation factors, whereupon an
assessment of the system’s environmental performance becomes possible.
The aim of this study is to show the complete comparative assessment of an omnivore and a
vegetarian diet in terms of environmental sustainability provided by a catering service during the
“Fostering Good Practices and Confronting the Challenges of the 21st Century” conference. This
event with 120 invited participants and ten additional internal participants will take place at
Copenhagen Business School (CBS) in June 2018. The assessment will be achieved by applying
the LCA methodology as proposed by ISO 14040 (2006) and ISO 14044 (2006) and utilizing the
commercial LCA software SimaPro 8.4.0. The commissioner of this study is CBS, whereas the
authors of this report performed the evaluation with their support. The project aims to provide
the help and knowledge required in order to choose the environmentally friendlier menu based
on the two diet alternatives. A direct implementation of the results is likely, as the catering
provided at the conference will depend on this evaluation.
1Group 5 Life Cycle Assessment of Products and Systems 04.12.2017
2 Goal and Scope Definition
The goal and scope definition serves to set a frame to the whole life cycle assessment (LCA)
study. It answers central questions of why and in what way the LCA is conducted, which parts
are in- or excluded and what the results are supposed to be used for. It furthermore states how
the system is defined, determines the method to treat multifunctional processes and addresses
objectives and targets which will then be provided with data in the consecutive section Inventory
Analysis (LCI, section 3).
2.1 Goal Definition
To be able to conduct a study on life cycle assessment, the purpose of the results has to be defined
first. Thus, the goal definition focuses on setting limitations and general working parameters for
the whole assessment on these six aspects (Hauschild et al. (2017)).
1. Intended applications of the results
2. Limitations due to methodological choices
3. Decision context and reasons for carrying out the study
4. Target audience
5. Comparative studies to be disclosed to the public
6. Commissioner of the study and other influential actors
2.1.1 Intended Application of the Results
The following study is conducted to compare the environmental impact of a vegetarian and a
meat-based diet at the example of food provision during a conference. Thus, it is an assertive
comparison. However, since thorough analysis of the impacts of all process units included in
the study will be performed, environmental hot-spots may be identified. The conference is
called ”Fostering Good Practices and Confronting the Challenges of the 21st Century” and will
successively be meant when ”the conference” is mentioned for readability purposes. This LCA is
requested by the hosts of the conference, ”The Sustainable Consumption Research and Action
Initiative” (SCORAI), Copenhagen Business School (CBS), Washington State University (WSU)
and New Jersey Institute of Technology (NJIT). The results of the study can be used to support
a decision on what food to serve during the conference based on environmental favors. Thus,
changes due to this LCA will be limited to the conference and its participants at first. On the
long term minor personal changes on alimentation might be induced by the information provided
by this report, the results presented and the actions taken.
2Group 5 Life Cycle Assessment of Products and Systems 04.12.2017
2.1.2 Limitations due to Methodological Choices
As this study only compares two scenarios and neither provides a full assessment on sustainability
for vegetarian food nor a meat diet, results cannot be used to determine how overall environmen-
tally friendly each diet is. Furthermore, the sustainability is only evaluated in environmental
terms, social and economic aspects are neglected. Additionally, both the geographical and
temporal frame are set within the tight constraints of the conference taking place in Copenhagen,
Denmark, meaning that the resulting conclusions are not valid at any other location in the world.
As the time for conduction the assessment is limited, only two iterations will be performed after
which the conclusions will be drawn.
2.1.3 Decision Context and Reasons for Carrying Out the Study
The study’s main incentive is to find out which choice of catering is more environmentally
sustainable. Depending on that, SCORAI might decide on what food to order from the catering
company ”Spisestuerne”. Thus, there is a clear decision-supporting character in the study.
Depending on the results, these decisions might include the choice of alternative ingredients,
the way of production, handling or origin of the food or the way of preparing the meals from
the ingredients. As only one conference is regarded and no structural changes to this or any of
the product systems which this study may relate to are expected to arise, it is to be considered
a small scale study. Therefore it can be classified as Situation A: Micro-level decision support
according to figure 2.
Figure 2: Decision context classification (Hauschild (2017))
2.1.4 Target Audience
The results of the LCA will be primarily used by the organization hosts SCORAI, CBS, WSU
and NJIT to make decisions on food provision. As it is also planned to present findings in form
of a poster at the conference, a secondary audience will be the participants to the conference.
Hence, in general terms both the company and consumers are targeted. Since it cannot be
expected that this audience is familiar with the methodology of LCA, results will be presented
and discussed keeping this limitation in mind.
3Group 5 Life Cycle Assessment of Products and Systems 04.12.2017
2.1.5 Comparative Studies to be Disclosed to the Public
Disclosure to the general public is not intended for this comparative study. However, the study
will be presented to the participants attending the conference and the plenum of the DTU
course 42372 - Life Cycle Assessment of Products and Systems - offered by DTU department
Management Engineering. Hence if there were to be any confidential data, these will be kept
in an supplementary appendix and not presented within the two above described situations.
Disclosure at the conference in form of the poster will be reviewed by SCORAI ensuring that no
confidential data is published.
2.1.6 Commissioner of the Study and Other Influential Actors
This study is commissioned by the Sustainable Consumption Research and Action Initiative
(SCORAI). Since the LCA is being performed as a case study in the previously mentioned DTU
course, no financing exists as such, however. Another important actor involved is Mrs. Louise
Kofod Thomsen from CBS, who provided valuable data and support in cooperation with the
catering company ”Spisestuerne”.
2.2 Scope Definition
In accordance to the above declaration of the goal, further terminology and parameters of the
system have to be defined within the scope definition. This includes explanations of the following
nine categories:
1. Deliverables
2. Object of assessment
3. LCI modelling framework
4. System boundaries and completeness requirements
5. Representativeness of LCI data
6. Preparing the basis for the impact assessment
7. Special requirements for system comparisons
8. Critical review needs
9. Planning reporting of results
2.2.1 Deliverables
The scope of assessing the two different diets is to both obtain a life cycle inventory analysis
(LCI) and translate those results into impact categories within an impact assessment (LCIA). A
full life cycle assessment report including interpretation and conclusion on the final results is to
4Group 5 Life Cycle Assessment of Products and Systems 04.12.2017
be completed. Moreover, the identification of environmental hot-spots is included. This way the
study is compatible to the ISO 14044 (2006) framework. The optional steps of normalisation
and weighting under this norm are intended for this study to improve the presentation of the
comparison and facilitate a categoric understanding both for the LCA practitioners and the
target audience.
2.2.2 Object of Assessment
The object of this assessment is to give the commissioner a feedback regarding the environmental
impacts deriving from all the upstream and downstream processes related to the main meals
that will be served during the conference. These are listed here, along with snack foods which
will be provided in breaks, in chronological order:
• June 27th : reception snacks
• June 28th : morning break (fruits, nuts), lunch (buffet), afternoon break (fruits, nuts),
dinner
• June 29th : morning break (fruits, nuts), lunch (buffet), afternoon break (fruits, nuts),
goodbye reception (cheese)
As the goal focuses solely on the comparison of two different diets, all the snacks are excluded
from the assessment, as they are the same for both diets. The same is applied for the cheese at
the goodbye reception. The dinner is assumed to be provided in as a buffet, as will the lunches.
Throughout this report, whenever meat-based is mentioned it is understood to include fish as
well, meaning an overall omnivore diet. With the aid of one exemplary vegetarian menu and
one meat-based menu provided to us by the commissioner, as listed in table 1 and table 2, the
nutritional value of each is calculated. An extensive list of amounts and contained calories for
each ingredient is attached as table 20 and table 19 in appendix A.2.
5Group 5 Life Cycle Assessment of Products and Systems 04.12.2017
Table 1: Summary of the dishes provided in the meat-based menu
MEAT-BASED MENU
Meatballs with
Chick pea patty with
cauliflower and parsley
smoked salmon topped
on cold saute of
with sour fennel salad
mayonnaise, rye bread
and fresh cress
and sweet & sour cucumbers
Filo pastry Minced meat
Chick peas Glutenfree oat meal
Spinach Egg
Eggs whole Water
Soy milk Onions
Smoked salmon Cauliflower
Nutmeg, cumin Parsley
Curry and pepper Nutmeg
Salt, pepper Salt, pepper
Fennel Turnip
Oil Cucumber
Apple vinegar Oil
Apple vinegar
Rye bread (Chips)
Mashed potato salad
with spinach,
Red fruit porridge with cream
smoked spelt and
wideleaf parsley
Baked potato Berries (porridge)
Spelt (boiled and smoked) Sugar
Spinach Lemon balm
Parsley Cream
Oil Sugar
Apple vinegar Gelatine
Salt, pepper Vanilla
6Group 5 Life Cycle Assessment of Products and Systems 04.12.2017
Table 2: Summary of the dishes provided in the vegetarian menu
VEGETARIAN MENU—
Falafel with yellow
Asparagus with wood
peas, seasonal baked
garlic pesto, couscous,
carrots with pickled
cucumber and radish
mushrooms and sorrel
Green asparagus Chickpeas
Wood garlic Yellow peas
Salted almonds Seasoning herbs
Couscous Garlic
Water Seasonal carrots, baked
Parsley Oil
Lemon Pickled mushrooms
Cucumber Apple vinegar
Oil Water
Apple vinegar Salt/pepper
Salt/pepper Sorrel
Garden radish
Pickled pointed cabbage,
Chocolate mousse with
salt baked shallots and
rhubarb and caramel
celery
Pickled pointed cabbage Chocolate (mousse)
Apple vinegar Butter
Water Sugar
Salt baked shallots Egg
Oil Rhubarb
Celery Sugar
Salt/pepper Water
Vanilla
Sugar
Molasses
Cream
By the reported mass of each ingredient per serving, the nutritional value could be determined
to see if the catering company will be providing equal amount of calories in both menus. The
conversion rate from kilograms to nutritional values (kcal) for each ingredient are taken from
a calorie and food database (Fddb Internetportale GmbH (n.d.)) and the resulting amount is
displayed in table 3 alongside the total mass of one serving.
7Group 5 Life Cycle Assessment of Products and Systems 04.12.2017
Table 3: Nutritional values calculated based on the exemplary meal using conversion rates from
Fddb Internetportale GmbH (n.d.)
g per serving kcal per serving
Vegetarian 574 964
Omnivore 568 943
Based on these considerations and a list of obligatory and positioning properties shown in table 4,
the functional unit (FU) can be defined.
Table 4: Obligatory and positioning properties of food provision
Obligatory Properties Positioning Properties
provide nutritional functions taste/seasoning
comply with hygiene standards amount
price
variety
quality
origin
The functional unit for the meat or vegetarian diet is set as follows:
”Provide food complying with valid hygiene standards for two lunches and one
dinner for 130 people during the three-day conference at CBS.”
To achieve a common basis of the amount of vegetables or meat needed, it was first considered to
use the determined nutritional values as unit for the reference flow rather than mass as the two
diets provide different amounts of energy per unit of mass (cf. table 3). However, as the provided
calories are only very slightly different (average 953.5 kcal), it was decided to use the masses
instead to facilitate the simulation with the LCA software SimaPro in the inventory analysis
in section 3. A reference flow of fref ,v =223.86 kg is established for the vegetarian diet and
fref ,m =221.52 kg for the meat-based diet as follows.
The mass amounts from the meat based (fm ) and vegetarian diet (fv ) vary, so they are multiplied
by the number of meals N and participants P separately. This yield the reference flows according
to equation (2) and equation (3).
fref,i = fi · N · P (1)
fref,v = 0.574 kg · 3 · 130 = 223.86 kg (2)
fref,m = 0.568 kg · 3 · 130 = 221.52 kg (3)
8Group 5 Life Cycle Assessment of Products and Systems 04.12.2017
2.2.3 LCI Modelling Framework
This section delivers explanations of where multifunctionalities arise in the life cycle and how
they are treated in the system.
Secondary Functions and Multifunctional Processes
Both in the omnivore and vegetarian food production some secondary functions arise, making
many of the processes multifunctional. For instance, the meat production processes have
the primary function to produce meat but depending on the animal also provide additional
economically valuable products like milk, leather, bones, eggs or pet snacks. Depending on
the kind of meat that is required, these secondary functions vary, as milk and leather cannot
generally be obtained or only chicken production delivers eggs (assuming that chicken production
starts with hatchlings of both genders) and fish production fish meal.
The multifunctionality of the vegetarian food process production shows mainly in vegetable scrap
or waste, that is either discarded in the raw material stage or recycled as organic waste in the
disposal stage with the same purpose of producing compost, useful to fertilize the land and bring
nutrients back to the soil.
The ISO 14044 Hierarchy to Solving Multifunctionality
In order to solve the multifunctionality issue, the hierarchy of solution introduced in ISO 14044
(2006) is applied.
For some processes within the meat-based menu, neither subdivision of the multifunctional
processes nor a system expansion is possible, as animal co- or byproducts cannot be obtained
in another way. Hence, allocation has to be applied. A meaningful way to do this is physical
allocation based on the mass amounts of each product and by-product. The values of different
animal products are not considered distinguishable enough to utilize economic evaluation. System
expansion can be performed in the disposal stage, where the food waste is incinerated generating
heat and power. A conventional alternative to provide this function would be from power plants
and coal or natural gas. If the food waste is recycled instead of incinerated, a system expansion
can be performed where the resulting animal feed is produced from virgin materials instead of
recycled waste. Concerning the vegetable product systems, system expansion is possible only
in the last stages of the life cycle. Similar to the meat producing processes, waste incineration
generates power and heat that can be obtained in alternative ways. Compost, which may be
used to fertilize agricultural land, can be simulated by producing fertilizers from chemicals or
virgin materials instead of waste as well.
To sum it up, both allocation and system expansion are used in order to follow the framework
with the priority of system expansion whenever possible.
Attributional and Consequential LCA
Attributional and consequential modelling are two main LCI modelling frameworks. The
overall aim of attributional modelling is to look at a product system/service without taking the
surrounding technological environment into consideration directly. This way the full economy is
9Group 5 Life Cycle Assessment of Products and Systems 04.12.2017
neglected and the issue of ”what environmental impact can be addressed to product X” stands
in the foreground. Modelling of the background system of the object of assessment then focuses
on average processes.
Consequential modelling on the other hand attempts to include the technosphere and the overall
economy in the assessment. It poses the question ”what are the environmental consequences
of consuming X”. Changes in the market demand depending on the functional unit would be
included as far as possible.
For this case study, the focus is kept solely on the product system without taking the whole
technosphere into account. Thus, from this perspective, an attributional approach is applied
with average processes for the background systems. Due to database structure constraints in
SimaPro, a consequential approach will be employed instead.
Recommended Modelling Choices for the Identified Decision Context
The decision context was identified as ”Situation A: micro-level decision support” (cf. sec-
tion 2.1.3). As mentioned in Hauschild et al. (2017) and displayed in table 5, the ILCD
(International Life Cycle Data System) recommends an attributional modelling framework using
average market consumption mix for background processes. Multifunctionality should generally
be handled by system expansion, on the term that subdivision is not possible. Furthermore, the
ILCD recommends to use average processes in background systems, as it is difficult to identify
marginal processes i.e. market behaviour response to small changes.
Table 5: Summary of ILCD recommendations on LCI modelling choices
LCI Handling of multi- Modelling
Decision modelling functional processes of
context framework when subdivision is background
(ILCD terminology) not possible system
Situation A Attributional System expansion Average processes
Mix of Mix of long-term marginal
Situation B attributional and System expansion processes for processes
consequential Structurally changed.
Situation C1 Attributional System expansion Average processes
Situation C2 Attributional Allocation Average processes
2.2.4 System Boundaries and Completeness Requirements
Given the similarity between the systems and their boundaries of both diets, they are drawn
together in the same flow diagram in figure 3. The area surrounded by the dashed line is the
foreground system and the rest the background system. For this reason, waste is mentioned twice
within the diagram. Emissions are marked with a ”*” as they are leaving the system boundaries
but are drawn within for overview purposes. The only process differing is the meat production
and therefore the related system boundaries are highlighted in red colour.
10Group 5 Life Cycle Assessment of Products and Systems 04.12.2017
Figure 3: Flow Diagram for both menus, where red colour indicates an extension only present in
the meat-based scenario. Dashed lines mark the foreground system while solid lines represent
the system boundaries
As displayed in the flow-chart, this LCA is set with a cradle-to-grave approach. The foreground
system includes the production of all raw materials (vegetarian agricultural products, dairy
products, animal based products), the packaging processes, transportation, the meal preparation
process and finally waste management. Transport and energy use are illustrated as being on the
sideline as they take place throughout the whole life cycle. Cut-offs in terms of completeness
are factories for the processing of the foods, kitchen utensils and the kitchen itself and vehicles
and machinery or other materials needed during agricultural processes. Furthemore, electricity
and water use during the meal preparation are excluded as they are considered equal for both
scenarios.
11Group 5 Life Cycle Assessment of Products and Systems 04.12.2017
2.2.5 Representativeness of LCI Data
Another important factor of an LCA study is how representative the data used are. These topics
are explained in the following paragraphs for a geographical, time-related and technological
context.
Geographical Representativeness
The commissioner of the study provided data on the suppliers of food. The suppliers of meat,
vegetables, seafood, bakery ingredients and dairies, namely AB Catering, Grøntgrossisten,
Copenhagen Seafood & Dan Lacks, Condi and HKI Catering, respectively, have been contacted
in order to obtain data about the geographical origin of each ingredient. Reasonable assumptions
are carried out whenever information was not clear. This way, the data can be kept representative
on a geographical scope. Precise findings and modelling choices in this regard will be presented
in section 3.3.
Time-Related Representativeness
As innovation in terms of agricultural processes is assumed to be limited in a reasonable time
scale, having temporally representative data seems fairly straigt forward. During the modelling
process, the time horizon of the selected processes is remembered to be able to gauge uncertainties
that might arise from older data sets.
Technological Representativeness
As no highly technical and fast changing processes are included in this study, technological relation
are also not considered very crucial to the modelling of the system. Energy supply for instance is
connected to the geographical origin of the food or downstream processes. Transportation and
waste management that could easily be influenced by in a technological sense are not expected
to change in such a short time period.
2.2.6 Preparing the Basis for the Impact Assessment
The impact assessment will include both an evaluation at midpoint and endpoint level. The
characterised results are obtained by employing the impact assessment method ReCiPe 2016
Midpoint (H), which is the base case for this case study’s evaluation. The H therein stands
for a hierarchist approach which can be seen as an intermediate view when the categories time
perspective, manageability and required level of evidence are taken into account. It works with a
balance of short term and long term consequences, assumes that proper policies can facilitate
change and thus avoid a number of problems and includes effects proven and decided upon by
consent. As ReCiPe 2016 does not include normalisation factors and normalised results are
desired to achieve a better understanding of the magnitude of the results, ReCiPe 2008 Midpoint
(H) is used to obtain these. External normalisation using global person equivalents is applied
therein, namely World ReCiPe H. For the endpoint analysis, again ReCiPe 2016 and ReCiPe 2008
are utilised. Normalising and weighting results at endpoint level (with the set World ReCiPe
12Group 5 Life Cycle Assessment of Products and Systems 04.12.2017
H/H) enables an assessment of areas of protection and may yield a single score result, that can
be useful for a comparative LCA study.
As a measure of sensitivity analysis to gauge the robustness of the system, an evaluation with
the method ILCD 2011 Midpoint+ is carried out at midpoint level for characterised results.
For the base case method, the following impact categories are evaluated:
• global warming
• stratospheric ozone depletion
• ionizing radiation
• ozone formation, human health
• fine particulate matter formation
• ozone formation, terrestrial ecosystems
• terrestrial acidification
• freshwater eutrophication
• terrestrial ecotoxicity
• freshwater ecotoxicity
• marine ecotoxicity
• human carcinogenic toxicity
• human non-carcinogenic toxicity
• land use
• mineral resource scarcity
• fossil resource scarcity
• water consumption
During the characterisation phase, all elementary flows for the system are assessed according to
the degree to which they contribute to an impact. To do this, an impact score IS is calculated
with equation (4).
X
ISc = (CFi · Ei ) (4)
i
where E are all the elementary flows, c is an environmental issue of concern, i are the relevant
intervention and CF is the characterisation factor which represents the contribution per quantity
of an elementary flow to a specific impact category. This is done by SimaPro based on the choice
of method. A characterisation at midpoint level indicates an early stage in the cause-effect-chain,
giving a more measurable result although with less environmental relevance, whereas results at
endpoint level are less precise indicators further along the cause-effect-chain. The latter can give
a better understanding of the potential environmental impacts.
13Group 5 Life Cycle Assessment of Products and Systems 04.12.2017
While charactarised results represent the total impact that the product system has on each
specific category, normalisation can be seen as an interpretation aid because it helps understand
the relative magnitude of an environmental impact by expressing categories scores with a common
unit. A normalisation approach allows to put different impact categories into perspective making
them comparable to each other. The equation for normalisation is shown as equation (5).
CSisys
N Sisys = (5)
CSiref
where N Sisys is the normalised impact indicator score for impact category i of the system under
study, CSisys is the characterised impact indicator score for impact category i of the system
under study and CSiref is the characterised impact indicator score for impact category i of the
reference system under study. This reference depends on the method employed and the accuracy
of its evaluation may differ from impact category to impact category.
2.2.7 Special Requirements for System Comparisons
In order to be able to compare the omnivore and vegetarian alimentation during the conference,
a functional unit is found that is independent of the food type and applies for both. It can be
connected to a reference flow for each and the systems are hence comparable.
2.2.8 Critical Review Needs
Many of the judgments and assumptions made during the life cycle assessment are difficult to
confirm or discredit. Therefore, it is crucial to maintain objectivity and transparency and a
critical review is theoretically needed. However, there will be no critical review as there is no
panel of interested parties and the DTU course coordinators only provide feedback and guidance.
Since the study will not be disclosed to the general public, this complies with ISO standards.
2.2.9 Planning Reporting of Results
The reporting level of the LCA study is set to level 2 as given in the ILCD guideline. This
includes an executive, technical summary and a main final report serving as a decision support
tool. The latter includes a goal and scope definition, life cycle inventory analysis, life cycle impact
assessment, interpretation, conclusions, limitations and recommendations.
14Group 5 Life Cycle Assessment of Products and Systems 04.12.2017
3 Inventory Analysis
The inventory analysis is the LCA phase where data is collected in order to build all process
units that eventually will define the system under assessment when combined. Several iterations
of this phase are usually needed to meet the goal of the study. Each iteration provides insight on
which data are the ones most affecting the product system in terms of environmental impact and
hence the most important data to simulate in more detail in the inventory. As stated in section
2, two iterations only will be carried out for this case study, also due to time limitation. Thus
with each iteration, a better and more reliable interpretation of the LCA results is obtainable.
The following paragraphs guide through the decisions made in order to complete the inventory of
the system. The inventory analysis is carried out with the commercial software SimaPro 8.4.0.
The following libraries are activated for this project:
• Agri-footprint - mass allocation
• Agri-footprint - energy allocation
• Agri-footprint - gross allocation
• Ecoinvent 3 - consequential system
• Ecoinvent 3 - consequential unit
If possible Ecoinvent (unit) is preferred as it provides more possibilities to view the detailed
processes than Ecoinvent (system). Both of these use a consequential model instead of an
attributional and hence system expansion instead of allocation. Thus they are used if the
processes are available. If Agri-footprint has to be employed, mass allocation is selected because
physical allocation by mass simulates the situation better than the other two in this case, as also
explained in section 2.2.3.
One exemplary case of system expansion is found in the milk production for the vegetarian
menu. The aforementioned process takes into account the co-production of meat, hence includes
processes like ”Sheep for slaughtering, live weight {RoW} | sheep production, for meat | Conseq,
U” resulting in an accreditation to our model for the avoided emissions.
3.1 Basis for Developing the Inventory
As mentioned in section 2.2.2, an exemplary lunch meal was provided by the commissioner of
the LCA. As a simplification, this is used as basis for all three meals provided and simulated in
as much detail as possible to reduce uncertainties. By applying this simplification, it is assumed
that other meals would provide approximately the same amount of calories through their mass
and have similar processes included. For the implementation of the model, mass units of kg are
generally used as established in section 2.2.2. Thus, the total mass of the provided lunch meal is
multiplied by three to fulfill the functional unit.
15Group 5 Life Cycle Assessment of Products and Systems 04.12.2017
3.2 Processes for the LCI Model
The outcome of this step is a detailed depiction of all the product system’s processes. For this
study case we first identified the processes for the production of all raw materials (raw foods)
needed to deliver both the vegetarian and meat-based menus. Then processed ingredients are
included. Where the origin of production is known, the so called ”production” processes are
selected in SimaPro and later combined with the corresponding transportation process from this
country. The transportation processes are separated into transportation to the supplier from the
country of origin and the transport from the supplier to the location of the conference, i.e. CBS.
For those food ingredients where the origin is unclear (more than one possible) or unknown, the
so called ”market” process is chosen as it takes all the possible pathways the product might have
undertaken into account, including transportation, and considers the product as it is generally
found on the market. Table 6 lists the ingredients and the way they are approximated in SimaPro.
Ingredients that did not meet the threshold of 0.1 g per serving are generally neglected as they
are considered irrelevant to the study.
Table 6: Food ingredients and their mode of simulation
Vegetarian Menu Meat based menu
Ingredient Proxy Ingredient Proxy
mushroom neglected turnip potato
pointed cabbage white cabbage red berry strawberry
shallot onion parsley mint
rhubarb fennel oil canola oil proxy
wood garlic mint apple vinegar proxy
parsley mint water tap water
seasoning herbs mint oat meal oat mill feed
yellow pea pea spelt barley grain
oil canola oil proxy filo pastry proxy
apple vinegar proxy rye bread chips rye bread proxy
water tap water salmon landed fish
couscous wheat bran minced meat pig meat
chocolate proxy garlic onion
gelatine neglected
Meal ingredients not included in the databases we employed are considered by inserting proxies,
as can be seen in Table 6, which are either similar ingredients (if raw foods) or processes put
together using a simplified version that in the majority of the cases includes the upstream
ingredients and not the processes themselves (if processed foods). For a thorough understanding
of those processes, refer to the complete listing of processes enclosed in appendix A.1.
16Group 5 Life Cycle Assessment of Products and Systems 04.12.2017
The cooking process for vegetables is based on findings from the literature. This is achieved by
inserting the corresponding raw ingredients as inputs to the created process cooked vegetables,
which is assumed to be cooked with canola oil, first because it is commonly used in Denmark
and second because emission data to cooking with this oil could be obtained from Schauer et al.
(2002). These emissions are included as output to the ”cooked vegetables” process as far as they
cross our defined cut-off of 0.1 mg emission substance per kg of cooked vegetables. Similarly,
emissions from Rogge et al. (1991) of charbroiling regular hamburgers are used to estimate the
meat and fish cooking process. As a simplification, water and energy consumption during the
meal preparation for each menu are considered similar and hence not relevant for this comparative
study. They are both neglected.
Finally, for the waste treatment from food at the conference, a general biowaste treatment is
applied. In order to do this, 10 % food waste is estimated at the conference, partly by individual
waste on the plates, partly by left overs from the buffet.
3.3 Transport Data
As described in section 2.2.5, definite geographical origins could be obtained, so that representa-
tive modelling is possible for most of the ingredients. After estimating the origin of the remaining
ingredients and the type of transportation based on general customs, the distribution shown in
table 7 results.
Place A and place B therein refer to the starting and ending point of transportation. For
Denmark, a general approximation of 200 km distance is applied. The geographical location
for berries is found to be in the USA, however the exact location is assumed to be the state of
Oregon as it is found to be one of the largest berry production states (Oregon Berry Packing
(n.d.)). In relation to that the closest international airport (Portland) is chosen as a departure
point from the USA.
Modelling decisions for this section can be seen from the process data in appendix A.1. The lorry
transportation is divided into cooled lorries and non refrigerated ones. The distances from the
suppliers to CBS, where food preparation takes place are 28 km for vegetables, 6 km for meat,
18.7 km for dairy and 12.3 km for bakery goods. The remaining ingredients are assumed to be
transported 20 km to reach CBS from the wholesale. This last part of the transport is assumed
to take place in smaller trucks than the long distance hauls. The transportation of the packaging
materials, which are explained consecutively, is neglected at this point of the study.
17Group 5 Life Cycle Assessment of Products and Systems 04.12.2017
Table 7: Geographical origin of ingredients and according transport modes and distances (*
geographical origin has been assumed)
Ingredient Place A Place B Transport category Distance (km)
Portland company Airport (Portland) Lorry 17.5
Oregon company Airport (Portland) Lorry 53
Berries*
Airport (Portland) Airport(CPH) Airplane 8008
Airport (CPH) Grøntgrossisten Lorry 29
Chickpeas
Potato, Spinach
Cucumber
Cabbage*, Fennel*
Denmark Lorry 200
Mushrooms
Carrots, Onion
Turnip
Cauliflower*
Green asparagus Spain (company) Grøntgrossisten Lorry 2406
Lemon Spain (company) Grøntgrossisten Lorry 2625
Canola oil * Denmark Grøntgrossisten Lorry 200
Salmon Norway Ship 600
Meat* Denmark Lorry 200
Dairies* Denmark Lorry 200
3.4 Packaging Data
Depending on the supplier of the food, we also obtained some information about the packaging
of the food, which is specific for the kind of food. This section explains the choices made on raw
materials, sizes of packaging containers and demonstrates the implementation in SimaPro.
As many packaging materials are not predefined in the software, processes for packaging materials
are created manually based on findings from the literature of the specific items of packaging
we obtained. This entails many assumptions and simplifications as that information is not
all-encompassing. As a general assumption, all raw materials will be transported on EURO
pallets which are included in the database in SimaPro. Whenever no exact data could be found
for the amount of losses during packaging production, they are accounted for by increasing the
inputs by 10 %. The mode of packaging for the different ingredients of the menus can be found
in table 8 along with its implementation in the software. The precise manual processes that are
set up are attached in appendix A.1.
18Group 5 Life Cycle Assessment of Products and Systems 04.12.2017
Table 8: Type of packaging of the meal ingredients (* material based on literature search)
Ingredient Material of Packaging Implementation in SimaPro
Polystyrene box* manual process
Fish
Cardboard box* neglected
Vaccuum plastic foil wrapping neglected
Meat
E2 packaging box manual process
Paper pulp tray* manual process
Egg
Carton sleeve* neglected
Milk, Cream, Soy beverage Tetra Pak* manual process
Oil, Vinegar PET bottle* manual process based on in class example
Flour, Couscous, Sugar, Peas, Nuts Woven polypropylene bag* manual process
Vegetables, Fruits Cardboard Container P84 Corrugated cardboard box
In order to find the necessary amounts of packaging and model the processes, the characteristic
data compiled in table 9 for each material have been used.
Table 9: Characteristics for the packaging material
Material Material measures Weight (kg) Load Source
wall thickness: 30 mm Polymerdatabase (n.d.)
Polystyrene Box resulting volume: 0.216 l 0.225 25 kg Noel et al. (2001)
density: 1.05 g/cm³ JB Packaging (n.d.)
area: 929 cm² Ocampo et al. (2015)
assumed thickness: 5 mm The Egg Carton Store (n.d.)
Egg tray 0.032 30 eggs
volume: 46.45 cm³
AVCalc LLC (n.d.)
density: 0.689 g/cm³
Tetra Pak - 0.04 1l Tetra Pak (n.d.), Markwardt et al. (2017)
PET bottle - 0.19 5 kg Brilhuis-Meijer (2016), By et al. (2014)
area: 0.24 m²
Woven PP bag 0.034 20 kg QTL Bags (n.d.b), QTL Bags (n.d.a)
specific weight: ca 142.4 gsm
(65 gsm - 220 gsm)
E2 packaging box - 2 30 kg Industri-Emballage DK (n.d.)
Cardboard box P84 - 2.5 10 kg Smurfit Kappa (n.d.)
EURO pallet - 1 piece 500 kg EPAL (n.d.)
The polystyrene box is simulated with expandable polystyrene as input. The egg tray is
approximated by its input recycled paper. The Tetra Pak is approximated as 75 % woodfree
uncoated paper and 25 % LDPE transformed by injection moulding. The PET bottle is designed
as combination of a PET granulate and blow moulding for the body and both HDPE and LDPE
granulates formed into a cap by injection moulding. The woven PP bag is taken to be made
from PP granulate and the processes are approximated by film extrusion and bast fibre weaving.
Finally, the meat packaging box E2 is assumed to be produced from HDPE granulate by blow
moulding. Electricity use and process water requirements are included whenever they are found
in the literature (see detailed processes in appendix A.1).
19Group 5 Life Cycle Assessment of Products and Systems 04.12.2017
3.5 Model Construction and Result Calculation
The final LCI output needs to represent the functional unit and thus has to be scaled to the
reference flow, which is different for the vegetarian and omnivore diet (cf. section 2.2.2). The
model in this case is put together in the ”M LCA” and ”V LCA” processes for meat-based and
vegetarian menu, respectively. These are constructed from the assembled meal process including
raw foods, cooked foods and food proxies, the packaging, the transportation and food waste
treatment processes. As already discussed in section 3.2, energy, heat and water consumption
during the meal preparation is neglected as it can be expected to be similar for both diets.
The results calculated by SimaPro as elementary flows then serve as the basis for the subsequent
phase, i. e. the life cycle impact assessment.
3.6 LCI Results
Since calculations are done within the software, elementary flows are only obtained in the
background of the software and not visualized for the user. On the contrary, the flows are directly
translated into impact category indicators according to the method utilised. Thus, results will
only be discussed in the following section.
20You can also read